DOI:
10.1039/C7RA04046F
(Paper)
RSC Adv., 2017,
7, 40311-40320
Highly permeable and stable forward osmosis (FO) membrane based on the incorporation of Al2O3 nanoparticles into both substrate and polyamide active layer†
Received
9th April 2017
, Accepted 2nd August 2017
First published on 18th August 2017
Abstract
In the present study, hydrophilic Al2O3 nanoparticles were used as additives in both substrate and polyamide active (PA) layer to improve forward osmosis (FO) membrane properties. Via incorporation of 0.5 wt% Al2O3 into the substrate and 0.05 wt% Al2O3 into the PA layer (PS0.5-TFN0.05 membrane), the water flux reached 27.6 L m−2 h−1 with a relatively low solute reverse flux of 7.1 g m−2 h−1 using DI water as a feed solution and 1 M NaCl as a draw solution. Simultaneously, we found that the incorporation of Al2O3 nanoparticles into both the substrate and PA layer resulted in a better enhancement of FO performance and a higher increase in water flux than the simple incorporation of nanoparticles in substrate. Moreover, the PS0.5-TFN0.05 membrane remained stable during long-term FO tests and under serious water environment. To the best of our knowledge, this is the first study to report the effect of Al2O3 nanoparticles on FO performance, and the results verify the potential use of these nanoparticles in the fabrication of highly permeable FO membranes.
1. Introduction
Over the past few decades, the emergence of forward osmosis (FO) has attracted significant attention in membrane technology as FO is a potential cost-effective desalination process in addressing the shortage of water scarcity worldwide.1,2 Driven by osmotic pressure difference across the FO membrane, water molecules can freely pass through the membrane from the low osmosis pressure side to the high osmosis pressure side, whereas the solutes are retained.3,4 Low energy consumption,5 reduced fouling tendency,6 and high water recovery of FO process make it one of the most promising water purification and desalination technologies in energy generation, water supply, and food processing.7–9 However, the main obstacle in FO process is internal concentration polarization (ICP), which limits the performance of FO membranes.10–12 In general, dilutive ICP occurs when the active layer faces the feed solution (AL-FS) as a result of draw solute dilution around the support layer and accumulation of the feed solutes around the rejection layer. When the active layer faces the draw solution (AL-DS), the rejected feed solutes accumulate in the support layer, resulting in concentrative ICP.5 Both dilutive and concentrative ICP may cause reduction in effective osmotic pressure across the membrane, which induces a low water flux.13 It is generally agreed that to minimize the ICP effect on FO process, a small structural parameter S (S = thickness × tortuosity/porosity) is used for the support layer.14 Therefore, an ideal FO membrane should consist of (1) an active layer with high water permeability and low solute permeability and (2) a support layer with smaller structural parameters such as lower tortuosity, higher porosity, and thinner thickness.
Recently, addition of nanomaterials in substrate or polyamide active (PA) layer of thin-film composite (TFC) and thin film nanocomposite (TFN) FO membrane has emerged as a research hotspot for improving membrane properties. The majority of filled porous materials are inorganic nanoparticles, such as zeolite,15,16 mesoporous silica,17 carbon nanotubes18 and metal organic frameworks (MOFs).19 These nanomaterials with porous structure and hydrophilic nature could effectively improve substrate properties (porosity, pore size and hydrophilicity), as well as establish direct water channels in the dense PA layer for fast transportation of water molecules, leading to increasing water permeance of membranes.5 Emadzadeh et al.1 first reported a decreased S value by adding TiO2 nanoparticles in a PSf substrate. The reduction of S value indicated effective inhibition of ICP in FO performance, which contributed to considerable increase in water flux of the resultant FO membrane. Ma et al.10 investigated the influence of zeolite on FO performance by incorporating porous zeolite nanoparticles in PS substrate. Enhanced water flux was achieved using PS-zeolite substrate with a lower S value (0.34 mm) compared to that of TFC membrane prepared on a conventional PS substrate (S value was 0.96 mm). Similar results were also reported by other groups.20,21 Instead of incorporating nanomaterials in substrate, Niksefat et al.17 added silica nanoparticles in PA layer to improve FO membrane performance. They observed that water flux of TFN membranes was nearly 2 times higher than that of TFC membranes with 0.05 w/v% silica addition in PA layer. Besides, by dispersion of multi-walled carbon nanotubes in PA layer, Amini et al.5 also obtained a great enhancement in water flux of TFN membranes. All the results demonstrated that incorporation of nanomaterials in substrate or PA layer was an effective method to fabricate highly permeable FO membranes. Despite the significant achievements in nanomaterial-based FO membranes, there is still an urgent need for seeking for new nanomaterials to prepare high-performance membranes with enhanced water flux and improved salt rejection for good water quality.
Al2O3 nanoparticles have been widely used in various fields such as adsorbents, composite materials,22,23 and membrane preparation,24,25 because they possess many advantages such as high surface area, large pore volume26 and high porosity.27 Furthermore, a cheaper price compared to CNTs, TiO2 and MOFs is also an attractive point. Yan et al.24 fabricated Al2O3–PVDF composite membranes by addition of Al2O3 nanoparticles in PVDF ultrafiltration membrane, and they showed a great improvement in water flux and anti-fouling performance. Saleh et al.28 studied the effect of Al2O3 nanoparticles on reverse osmosis performance by incorporating them in PA layer, and both water flux and salt rejection exhibited an obvious elevation. These observations suggested that Al2O3 nanoparticles are of great potential for preparation of membranes with excellent separation performance. However, it has been observed that there is no report on the effect of Al2O3 nanoparticles on FO performance until now.
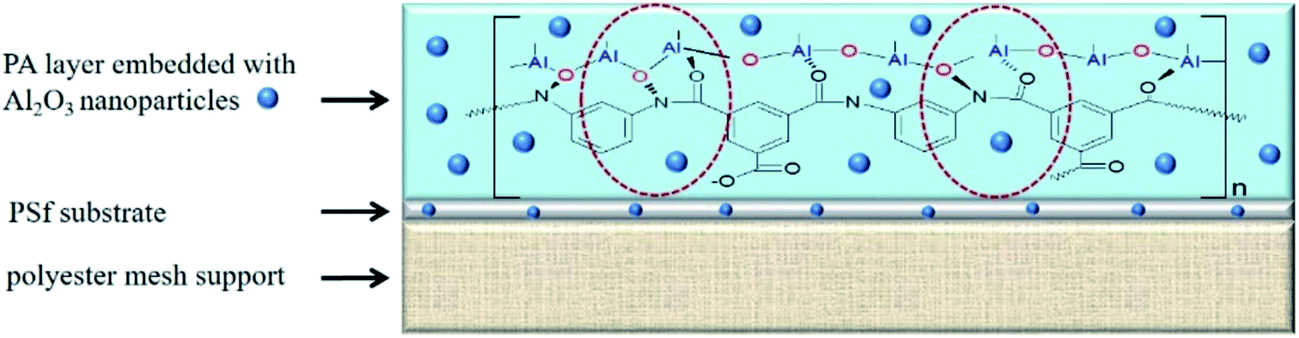
In view of this, the main objective of this work is to investigate the effects of Al2O3 nanoparticles on the FO performance upon their addition in PS substrate as well as PA layer. The proposed membrane structure between Al2O3 nanoparticles and polymer matrix is schematically depicted in Fig. 1. We first prepared two types of substrates, PS and PS-Al2O3, followed by the observation of property changes of the PS substrate. We further incorporated Al2O3 nanoparticles onto PA layer via interfacial polymerization and investigated the new layer by SEM, EDX, porosity and AFM characterization. Then, we conducted FO test to evaluate water flux and solute reverse flux, as well as membrane stability.
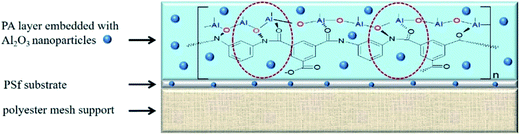 |
| | Fig. 1 Structure and mechanism of Al2O3 nanoparticles embedded in the membrane by coordination between Al2O3 nanoparticles and polymer matrix. | |
2. Experimental
2.1 Materials
Polysulfone (PS-3500P) was obtained from Solvay Advanced Polymers (Belgium). m-Phenylenediamine (MPD) and trimesoyl chloride (TMC) were purchased from Sigma-Aldrich (USA). Commercial aluminum oxide nanoparticles (<50 nm, γ-Al2O3, Sigma-Aldrich, USA) were used as additives in substrate and PA layer. A commercial polyester mesh (PE mesh, thickness ∼90 μm) was provided from Hebei Crane Achieves Network Industry Co., Ltd (China) and used as a backing layer for the substrate. Sodium chloride (NaCl) was used to prepare the draw solution and obtained from BASF chemical industry (China). Polyethylene glycol (Mw = 400) was obtained from Sinopharm Chemical Reagent Co. Ltd., China. Other materials were of the highest available purity and used without further purification. Milli-Q water (Millipore), with a resistivity of 18.2 MΩ cm, was used to prepare various solutions and for FO measurements.
2.2 Flat sheet TFC and TFN FO membranes
2.2.1 Preparation of PS and PS-Al2O3 substrates. The substrates were synthesized by using a phase-inversion method.18,29 The compositions of dope solutions are listed in Table 1. In brief, certain amounts of PS, PEG and LiCl were dissolved in DMAc. Then the dope solution was stirred using a magnetic stirrer for 24 h at 70 °C. After that, the resulting homogeneous dope solution was stored at room temperature for more than 24 h to remove air bubbles trapped within it. To prepare PS-Al2O3 substrate, 0.5 wt% Al2O3 nanoparticles were first added to the DMAc/PEG/LiCl mixed solution, followed by a 30 min ultra-sonication to minimize agglomeration. Soon after, PS beads were dissolved in the mixed solution system and the abovementioned procedure was repeated. Afterwards, the resulting homogeneous dope solution was spread over polyester mesh using an in-house casting device to form 90 μm mesh-embedded substrates. Finally, the resultant substrates were stored in a DI water bath for at least 24 h before use. The substrate with 0.5 wt% Al2O3 nanoparticles was denoted as PS0.5.
Table 1 Synthesis conditions for substrate, TFC and TFN membranes
| Membrane |
Composition of dope solution |
Composition of aqueous and organic solution during IP |
| PS (wt%) |
PEG (wt%) |
LiCl (wt%) |
DMAc (wt%) |
Al2O3 (wt%) |
MPD (wt/v%) |
TMC (wt/v%) |
Al2O3 (wt%) |
| PS substrate |
16 |
6 |
2 |
76.0 |
0.0 |
|
|
|
| PS0.5 substrate |
16 |
6 |
2 |
75.5 |
0.5 |
|
|
|
| PS-TFC |
16 |
6 |
2 |
76.0 |
0.0 |
2 |
0.1 |
0.00 |
| PS0.5-TFC |
16 |
6 |
2 |
75.5 |
0.5 |
2 |
0.1 |
0.00 |
| PS0.5-TFN0.05 |
16 |
6 |
2 |
75.5 |
0.5 |
2 |
0.1 |
0.05 |
| PS0.5-TFN0.1 |
16 |
6 |
2 |
75.5 |
0.5 |
2 |
0.1 |
0.10 |
2.2.2 Preparation of TFC and TFN membranes. TFC and TFN membranes were formed by an interfacial polymerization (IP) method with MPD and TMC.1,13 First, 2 wt% MPD aqueous solution containing 0.1 wt% SDS was poured onto the substrate upper surface and held horizontally at room temperature for 4 min. The excessive MPD solution was removed from the substrate using nitrogen gas, and then, 0.1 w/v% TMC in n-hexane solution containing various concentrations of Al2O3 nanoparticles, from 0.00 wt% to 0.1 wt%, was poured onto the substrate surface and contacted for 2 min. After removal of excess organic solution, the membrane was oven-dried for 5 min at 80 °C. Finally, the resultant membrane was washed thoroughly with DI water and stored in water base. To distinguish different TFC and TFN membranes, the membrane using PS substrate was denoted as PS-TFC, while the membranes using PS0.5 substrate were denoted as PS0.5-TFC and PS0.5-TFNx (x denotes the concentration (wt%) of Al2O3 nanoparticles in PA layer). The synthesis conditions for TFC and TFN membranes are summarized in Table 1. Because the prepared Al2O3-based FO membranes exhibited the highest water flux and acceptable solute reverse flux at 0.05 wt% addition of Al2O3 nanoparticles in PA layer (Fig. S1†), this loading concentration was selected. Besides, 0.1 wt% loading concentration in PA layer was selected to make a comparison.
2.3 Characterization of Al2O3 nanoparticles and membranes
2.3.1 Characterization of Al2O3 nanoparticles. The particle size of Al2O3 nanoparticles was determined by dynamic light scattering (DLS, Malvern Zetasizer Nano series, UK). To determine the crystal structure of Al2O3 nanoparticles, X-ray diffraction (XRD, RigakuD/Max 2200PC) with Cu Kα radiation (λ = 0.15418 nm) at room temperature with an applied tube voltage and electric current at 40 kV and 20 mA, respectively, was conducted. The Brunauer–Emmett–Teller (BET) theory was used at multiple points to calculate specific surface area and analyze pore size and pore volume of Al2O3 nanoparticles. The structure of Al2O3 nanoparticles was observed by using a JEM-2100 (JEOL, Japan) working at 200 kV.
2.3.2 Characterization of substrates and FO membranes. It is noted that all membranes were vacuum-dried at 40 °C overnight before characterization. To confirm the surface functional groups, attenuated total refection Fourier-transform infrared spectroscopy (ATR-FTIR, Tensor 27, Bruker, Germany) was applied. By using a scanning electron microscope (SEM, S-4800, Hitachi, Japan), the surface morphology and cross-section of membranes were analyzed. Notably, the isolated PA layer was separated from the PS support by dissolving PS using dichloromethane. An SEM microscope equipped with an energy-dispersive X-ray (EDX) spectroscope was used to determine elemental compositions of Al2O3 nanoparticles and composite membranes. Water contact angle was measured by using an automatic contact angle meter (DSA100, Kruss, Germany) to determine the hydrophilicity of membrane surface. To decrease data error, the measurement was repeated at least six times for each membrane. The membrane surface roughness was detected by in situ atomic force microscopy (AFM, Veeco, USA) with tapping mode measurements in air. The scanning area was 2 μm × 2 μm and Z-scale was 500 nm. The images showed that surface roughness was denoted as the root mean square (RMS) height. The membrane porosity (ε) was defined as the volume of the pores divided by the total volume of the membrane. It was obtained by gravimetric measurement using the following equation:18| |
 | (1) |
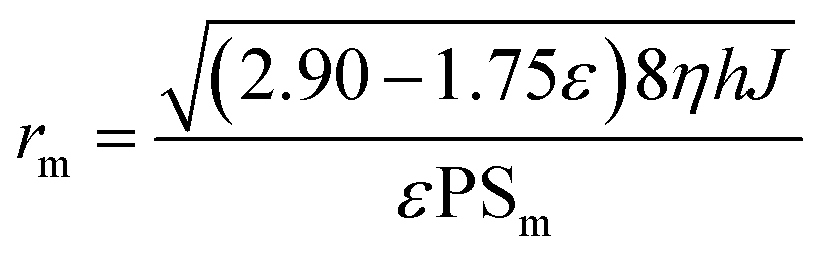
where m1 (g) and m2 (g) are wet and dry weights, ρw (1.00 g cm−3) is density of water, and ρP is density of polymer. It should be noted that the PE mesh was not removed while conducting porosity characterization.The average pore radius (rm) of PS substrate and PS0.5 substrate could be calculated by the Guerout–Elford–Ferry equation:30,31
| |
 | (2) |
where
η is water viscosity (Pa s),
J is water flux per unit time,
P is operational pressure (0.1 MPa),
Sm is effective membrane area,
h is membrane thickness and
ε is substrate porosity.
2.4 NF and FO performance
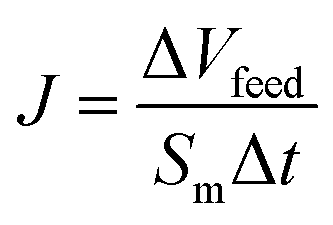
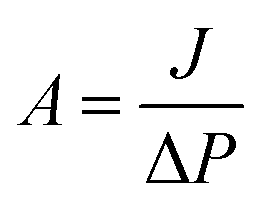
2.4.1 Water and solute permeability of substrates and FO membranes. The water and salt permeability of substrates and FO membranes were investigated by using a lab-scale circulating filtration unit to determine permeability and selectivity. The tests were conducted at room temperature with an effective membrane area of 7.065 cm2. The pure water permeability of PS and PS0.5 substrates were investigated using DI water at 1 bar with a cross-flow rate of 1 L min−1, while the water permeability of TFC and TFN membranes was investigated using DI water at 4 bar. Water flux (J, L m−2 h−1) and water permeability coefficient (A, L m−2 h−1 bar) were calculated using eqn (3) and (4), respectively:1,29| |
 | (3) |
| |
 | (4) |
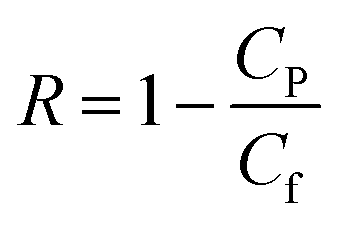
where Sm is effective membrane area, ΔVfeed is permeate volume, Δt is measuring time interval and ΔP is transmembrane pressure difference.The rejection (R) and solute permeability coefficient (B, L m−2 h−1) of TFC and TFN membranes were calculated using feed solution containing 2000 ppm NaCl at 4 bar by eqn (5) and (6), respectively:32
| |
 | (5) |
| |
 | (6) |
where
CP and
Cf are salt concentrations in the permeate and feed solution, respectively,
A is water permeability coefficient, Δ
P is pressure difference and Δ
π is osmotic pressure difference across the membrane.
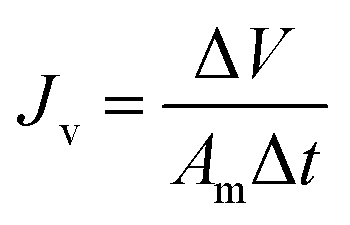
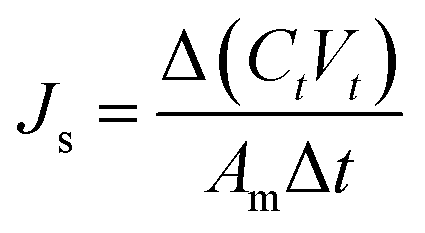
2.4.2 Water flux and solute reverse flux of TFC and TFN membranes. FO performance, water flux (Jv, L m−2 h−1) and solute reverse flux (Js, g m−2 h−1), was measured by a lab-scale cross-flow set-up with an effective membrane area of 10 cm2. All FO membranes were tested in two different operational modes: (1) AL-FS where active layer faces the feed solution and (2) AL-DS where active layer faces the draw solution. In the test, DI water and 10 mM NaCl were used as feed solution and 1 M NaCl as draw solution. The solution flow velocities during the tests were kept at 18.5 cm s−1 and each experiment lasted for 1 h and was repeated three times to obtain more accurate results. Jv and Js were determined by measuring the changes in weight and salt concentration in the feed solution, and calculated by eqn (7) and (8):15| |
 | (7) |
| |
 | (8) |
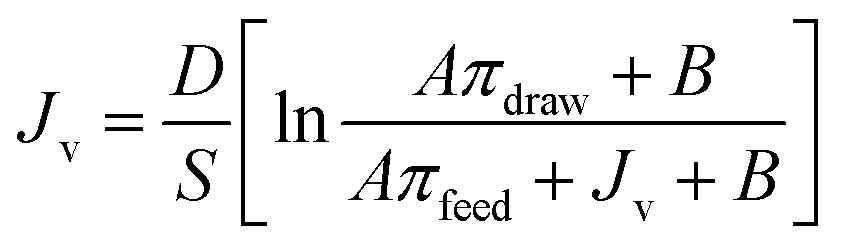
where ΔV is the volume change in feed solution, Am is effective membrane area, Δt is measuring time interval, and Ct and Vt are salt concentration and volume of the feed solution measured at the end of the time interval, respectively.Furthermore, the structural parameter (S) of FO membranes can be calculated in accordance with classical internal concentration polarization (ICP) model as expressed in eqn (9):5
| |
 | (9) |
where
Jv is FO water flux,
D is solute diffusion coefficient in water, and
πdraw and
πfeed are osmotic pressures of the draw and feed solutions, respectively.
In addition, FO performance of PS-TFC, PS0.5-TFC and PS0.5-TFN0.05 membranes was evaluated over a range of NaCl concentrations from 0.5 M to 2 M as draw solution and DI water as feed solution.
2.4.3 Stability of PS0.5-TFN0.05 membrane. To measure the stability of PS0.5-TFN0.05 membrane, 80 h long-term FO test was conducted to observe the changes in water flux and solute reverse flux. In addition, PS0.5-TFN0.05 membrane was stored in an acid solution (pH = 2) and alkali solution (pH = 12) for 7 days, and then the FO test was re-conducted to determine the stability of composite membranes under serious water environment.
3. Result and discussion
3.1 Characterization of Al2O3 nanoparticles
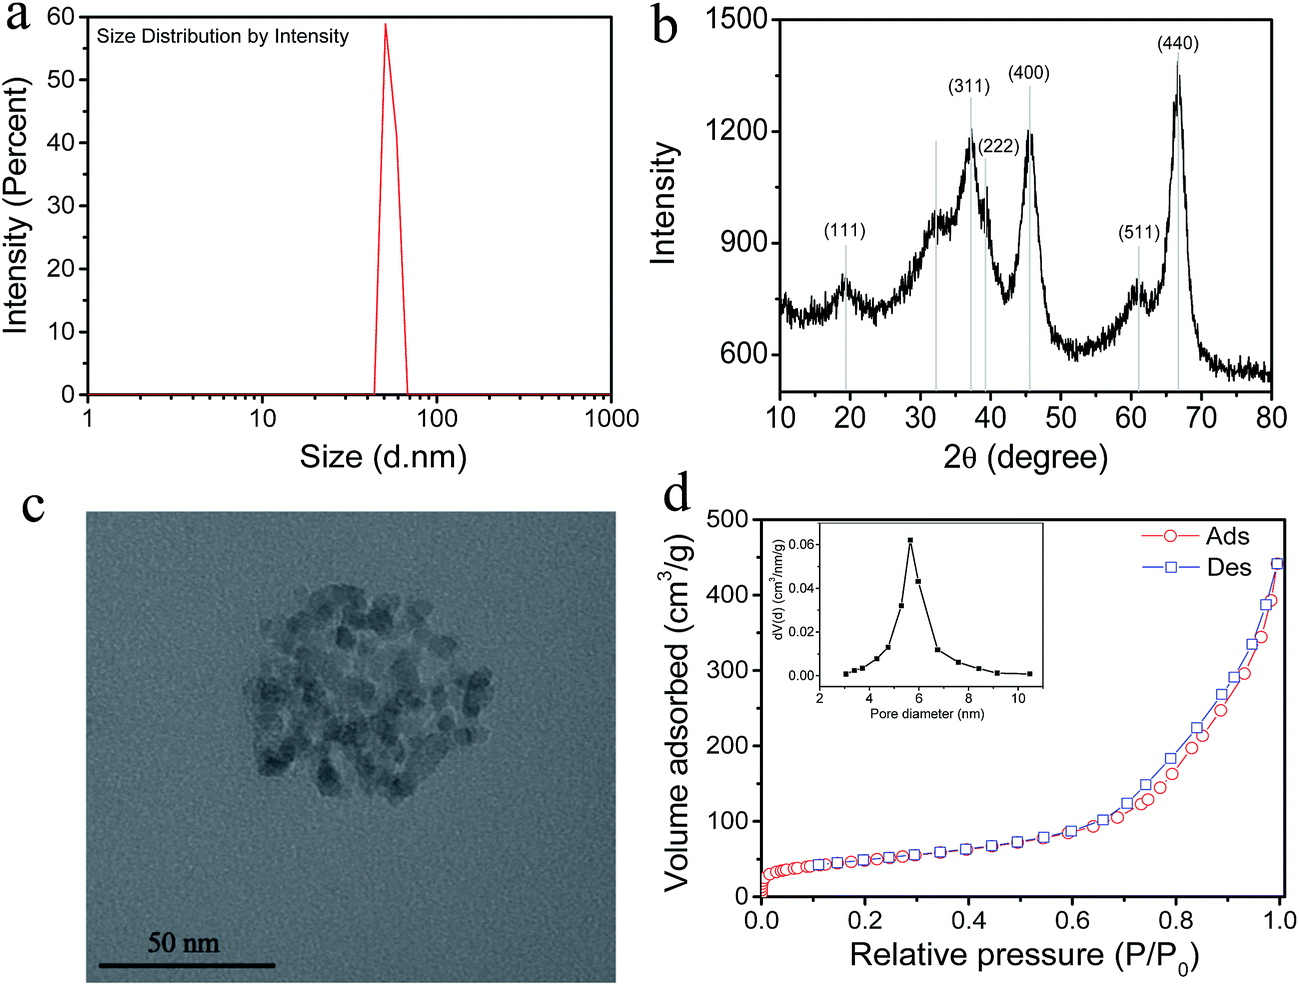
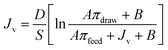
As shown in Fig. 2a, the average size of Al2O3 nanoparticles is 54.7 ± 4.0 nm with a narrow size distribution. The XRD patterns (Fig. 2b) exhibit two relatively strong peaks at 2θ values of about 46.6° and 66.7°, which are attributed to the (400) and (440) reflections of γ-Al2O3 (JCPDS 10-0425), respectively. The other peaks also correspond to the standard card,33,34 which demonstrated that only γ phase exists in commercial Al2O3 nanoparticles without any other phases such as α and β. It is generally accepted that among the seven transition phases, γ-Al2O3 is the most attractive one for its favorable textural properties (large surface area and high pore volume).23,35 The structure of Al2O3 nanoparticles is detected by TEM and presented in Fig. 2c. The Al2O3 nanoparticles are spherical and agglomerate to many fine crystallites with sizes ranging from 4 to 6 nm and have a porous structure.36 The pore diameter of Al2O3 nanoparticles is 5.6 ± 0.7 nm with a relative narrow pore size distribution. In addition, the BET specific surface area is 220 ± 13 m2 g−1 and the pore volume is 0.673 ± 0.055 cm3 g−1 using the Barrett–Joyner–Halenda (BJH) method. The mesoporous structure of commercial Al2O3 nanoparticles makes it an appropriate nanomaterial to serve as a water channel in the fabrication of FO membranes, such as TiO2, SiO2 and MOFs.19,37 The elemental composition of Al2O3 nanoparticles is shown in Fig. S2.†
 |
| | Fig. 2 (a) Average size of Al2O3 nanoparticles; (b) XRD patterns of Al2O3 nanoparticles; (c) TEM images of Al2O3 nanoparticles and (d) nitrogen adsorption–desorption isotherms and pore size distribution curve (inset) of Al2O3 nanoparticles. | |
3.2 Effect of Al2O3 nanoparticle addition on substrate properties
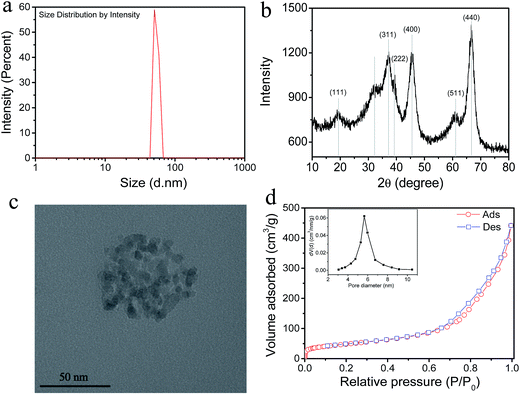
Fig. 3 displays the surface morphology and cross-section of PS substrate and PS0.5 substrate, as well as the distribution of Al element in PS0.5 substrate by EDX mapping. We can see that the surface morphology of PS0.5 substrate undergoes an obvious change due to incorporation of Al2O3 nanoparticles in the dope solution. The pore size together with the overall porosity of PS0.5 substrate both show an increase, as shown in Table 2. Compared to pure PS dope solution, the presence of hydrophilic Al2O3 nanoparticles in the dope solution may strongly facilitate diffusion of water from the water coagulation bath to the cast polymer film, leading to enlargement in overall porosity and pore size of PS0.5 substrate.38 However, little difference is observed in the cross-sectional images of PS and PS0.5 substrates, and both comprise a dense layer and a straight finger-like structure. It is acceptable that high porosity associated with finger-like structure of the substrate can cause minimization of the structural parameter (S) and a small S value unavoidably leads to lower ICP and better FO performance.17
 |
| | Fig. 3 Surface morphology and cross-section of PS substrate (a) and (d) and PS0.5 substrate (b) and (e). EDX mapping image (Al) and composition of PS0.5 substrate (c) and (f), respectively. | |
Table 2 Effect of Al2O3 nanoparticle addition on substrate properties with respect to water permeability, pore size, overall porosity, contact angle surface roughness and structure parameter
| Membrane |
Pure water permeability (L m−2 h−1 bar) |
Porosity (%) |
Pore size (nm) |
Contact angle (°) |
RMS (nm) |
S value (μm) |
| PS |
174 ± 8 |
63.2 ± 1.7 |
30.7 ± 0.7 |
80.4 ± 2.1 |
20.571 |
1422 |
| PS0.5 |
261 ± 14 |
71.1 ± 2.1 |
34.1 ± 0.9 |
67.7 ± 2.6 |
25.347 |
1028 |
EDX mapping results are presented in Fig. 3c. Slight aggregation of Al2O3 nanoparticles is detected in the PS0.5 substrate, which leads to increase in surface roughness from 20.571 nm for PS substrate to 25.347 nm for PS0.5 substrate, as shown in Table 2. Nevertheless, the water contact angle shows a reduction for the PS0.5 substrate, indicating the enhancement in hydrophilicity. During the phase inversion process, the hydrophilic nanoparticles present in dope solution tend to decrease the interface energy, and migrate fast towards to the upper layer of the fabricated membranes. This migration plays a positive role in increasing membrane hydrophilicity, thus decreasing contact angle.39 Combination of enhanced porosity and hydrophilicity significantly contribute to higher pure water permeability of PS0.5 substrate, as presented in Table 2.
3.3 Effect of Al2O3 nanoparticles on FO performance
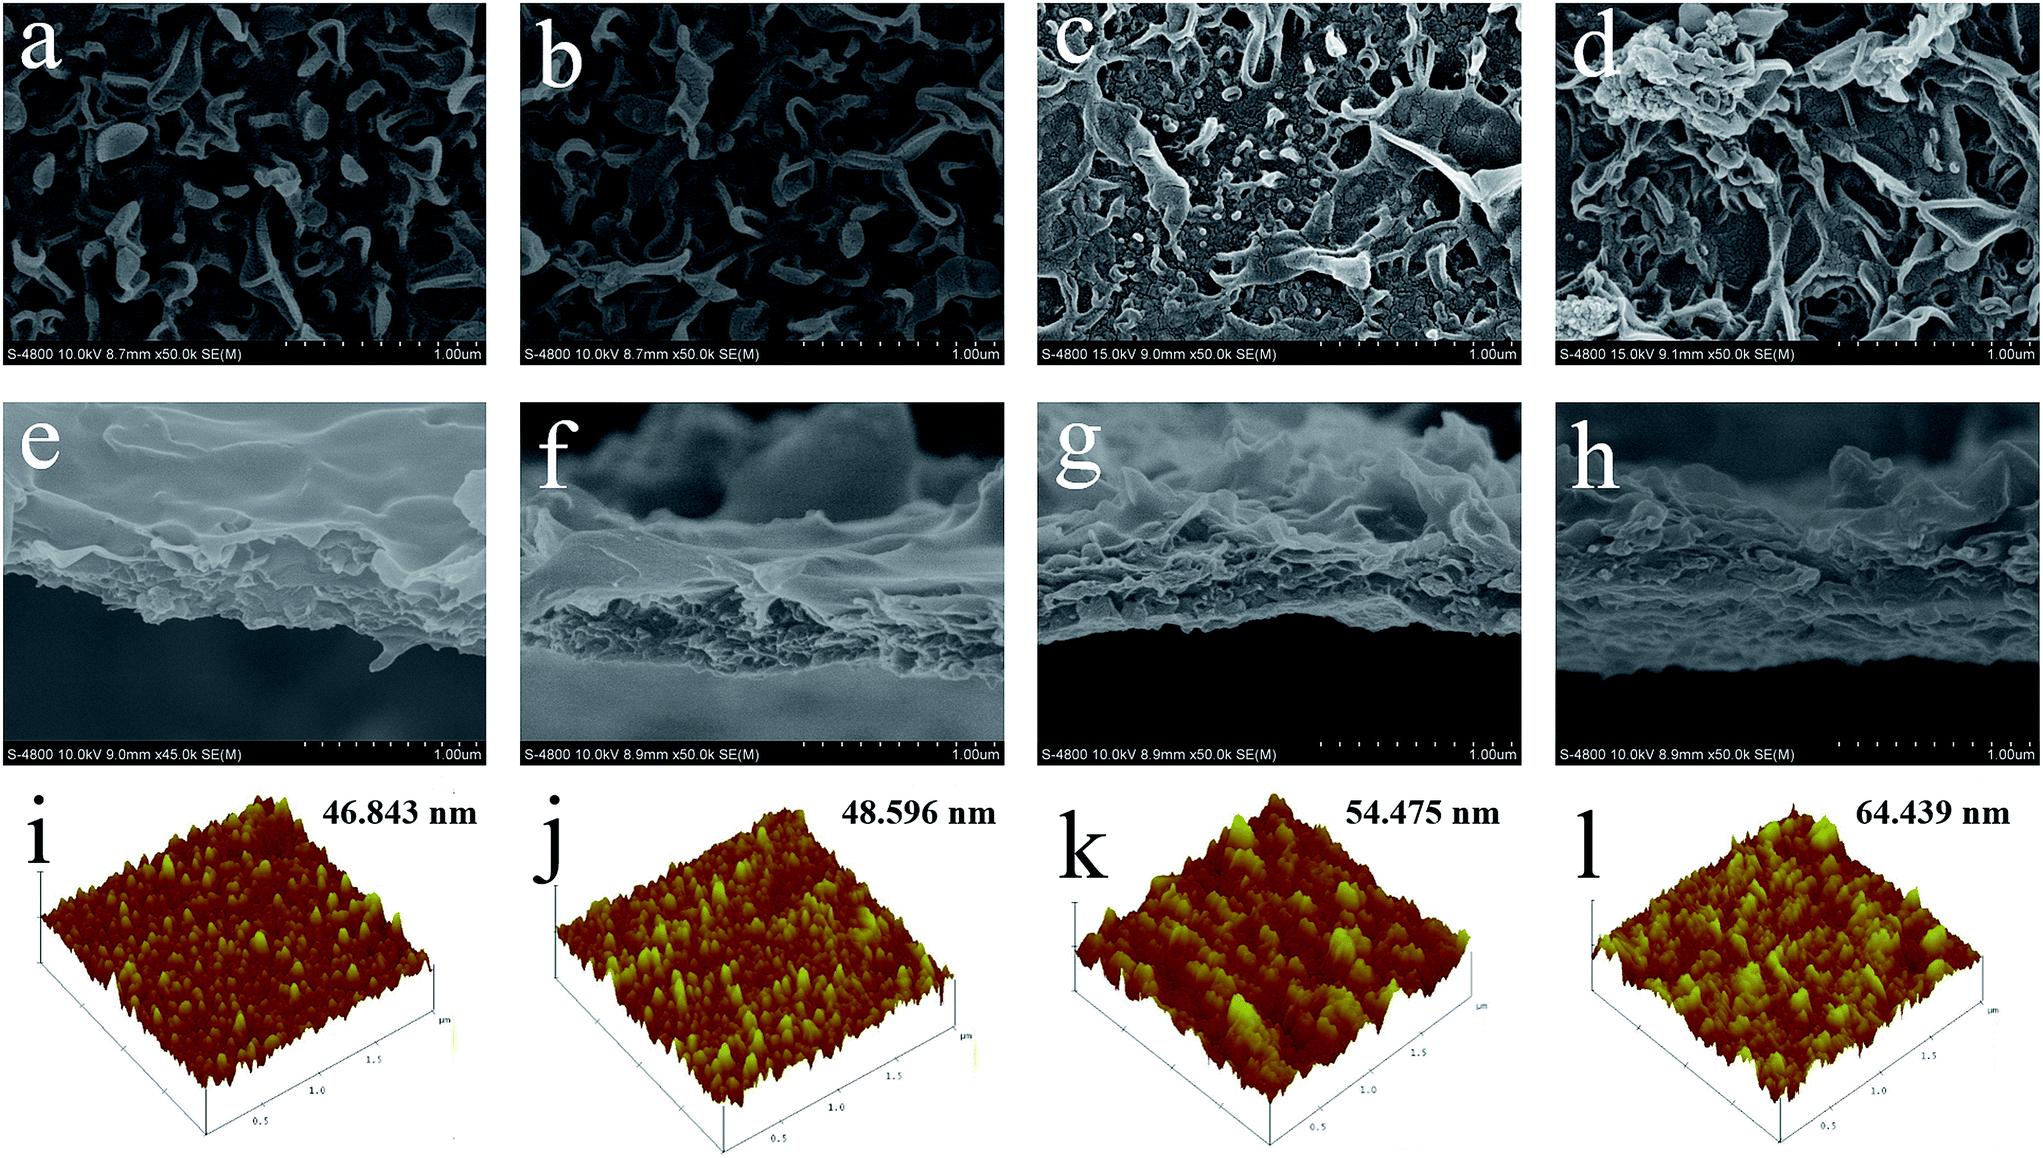
3.3.1 Surface morphology and surface roughness of FO membranes. Fig. 4 reflects the surface morphology, cross-section and roughness of TFC and TFN membranes. Apparently, the surface of PS-TFC membrane and PS0.5-TFC membrane exhibit typical “ridge-and-valley” structure of PA layer with a relatively smooth surface (Fig. 4a, b, e and f).40 When Al2O3 nanoparticles are added in organic phase, PS0.5-TFN membranes show large “leaf-like” morphological structures, and from the cross-section images, we can observe that their surface has become rougher than that of TFC membranes (Fig. 4g and h). Besides, the isolated PA layer of PS0.5-TFN membranes show a slight increase in thickness as compared to TFC membranes. Lind et al.16 have confirmed that the formation of expanded IP reaction zone induced by enhanced miscibility of aqueous and organic phases upon the addition of hydrophilic nanoparticles plays a vital role in membrane structure. When contacted with the aqueous phase, Al2O3 nanoparticles in organic phase hydrate and then release heat on the IP interface and broaden the reaction zone. Certain amount of MPD molecules may diffuse to broad reaction zone and form large “leaf-like” structures, which resulted in the increase of surface roughness and thickness of the PA layer. When the loading concentration of Al2O3 nanoparticles increases to 0.1 wt%, severe aggregation of Al2O3 nanoparticles is noted in the PA layer with a further increment in surface roughness. The serious aggregation of Al2O3 nanoparticles may induce the formation of macro-voids on the active layer and deteriorate structural integrity, thus decreasing salt rejection. Besides, the element composition of TFC and TFN membranes is summarized in Table S1.†
 |
| | Fig. 4 Surface morphology, cross-section and roughness of TFC and TFN membranes. (a) (e) and (i) PS-TFC membrane; (b), (f) and (j) PS0.5-TFC membrane; (c), (g) and (k) PS0.5-TFN0.05 membrane and (d), (h) and (l) PS0.5-TFN0.1 membrane (AFM image: scanning scale 2 μm × 2 μm and Z-scale is 500 nm). | |
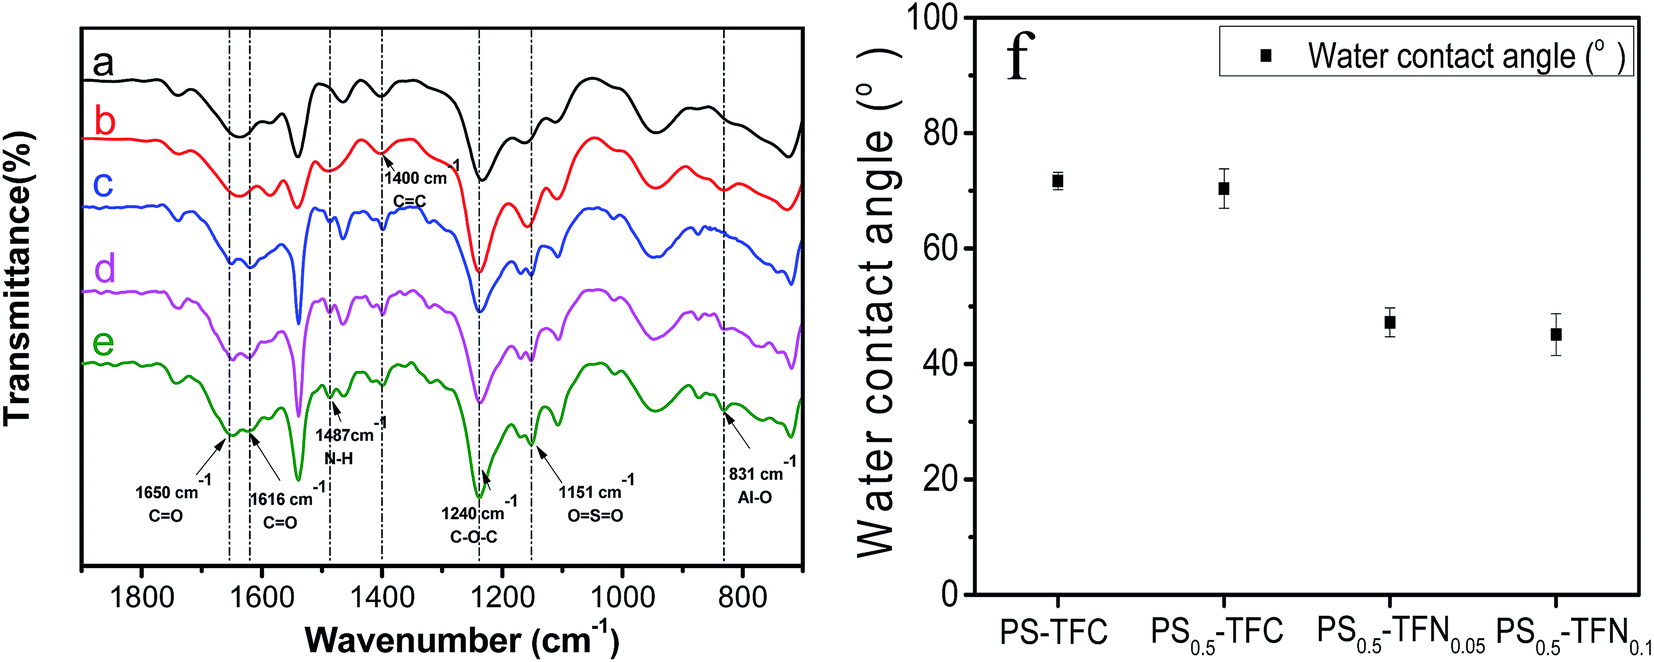
3.3.2 ATR-FTIR spectra and water contact angle of TFC and TFN membranes. Fig. 5 displays the ATR-FTIR spectra of substrates and FO membranes. For PS and PS0.5 substrate, the peaks at 1151 cm−1 are attributed to symmetric stretching of O![[double bond, length as m-dash]](https://www.rsc.org/images/entities/char_e001.gif) SO. The peak at 1240 cm−1 and 1400 cm−1 represent the asymmetric stretching of C–O–C and aromatic ring stretching of CC. These peaks correspond to specific functional groups of the substrate made of PS.1 For TFC and TFN membranes, the typical peaks of PA layer at are detected at 1650 cm−1, 1616 cm−1, and 1487 cm−1, which are attributed to amide I CO stretching vibrations, hydrogen-bonded CO stretching vibrations, and amide II N–H bending and torsional motion, respectively.40 Furthermore, a peak at 831 cm−1 representing Al–O stretching vibrations is also observed in PS0.5 substrate, PS0.5-TFC membrane and PS0.5-TFN0.05 membrane.28 These peaks indicate the successful incorporation of Al2O3 nanoparticles in both PS substrate and PA layer.
SO. The peak at 1240 cm−1 and 1400 cm−1 represent the asymmetric stretching of C–O–C and aromatic ring stretching of CC. These peaks correspond to specific functional groups of the substrate made of PS.1 For TFC and TFN membranes, the typical peaks of PA layer at are detected at 1650 cm−1, 1616 cm−1, and 1487 cm−1, which are attributed to amide I CO stretching vibrations, hydrogen-bonded CO stretching vibrations, and amide II N–H bending and torsional motion, respectively.40 Furthermore, a peak at 831 cm−1 representing Al–O stretching vibrations is also observed in PS0.5 substrate, PS0.5-TFC membrane and PS0.5-TFN0.05 membrane.28 These peaks indicate the successful incorporation of Al2O3 nanoparticles in both PS substrate and PA layer.
 |
| | Fig. 5 ATR-FTIR spectra of substrates and FO membranes. (a) PS substrate; (b) PS0.5 substrate; (c) PS-TFC membrane; (d) PS0.5-TFC membrane; and (e) PS0.5-TFN0.05 membrane. Water contact angle of TFC and TFN membranes (f). | |
The water contact angle of TFC and TFN membranes is presented in Fig. 5f. Little difference is observed between PS-TFC and PS0.5-TFC membranes due to their similar functional groups such as –NH2 and –COO− on the membrane surface. When Al2O3 nanoparticles are incorporated in the PA layer, an obvious decrease in water contact angle is observed for PS0.5-TFN membranes. It is agreed that a small contact angle represents high hydrophilicity of membrane surface.29 The contact angle can be influenced by membrane surface roughness and it is greater on rough solids than on relatively smooth surfaces because of the hysteresis of wetting increases with degree of roughness.39 However, as shown in Fig. 5f, the contact angle decreases with increase in surface roughness. Prakash et al.41 have proposed that roughness factor alone does not ensure hydrophilic behavior of membrane surface. Thus, the reduction of contact angle of PS0.5-TFN membranes suggest that the incorporation of Al2O3 nanoparticles decreases interface energy and develops nano-channels on surfaces, thus allowing easy water-droplet expansion on its surface.5
3.3.3 NF performance of TFC and TFN membranes. Table 3 summarizes the water permeability and solute permeability of TFC and TFN membranes during NF test. As can be seen, PS0.5-TFC and PS0.5-TFN membranes exhibit an increment in water flux compared to pure PS-TFC membrane, indicating that the incorporation of Al2O3 nanoparticles in substrate and PA layer has a positive effect (such as improved hydrophilicity of substrate and PA layer as well as the enlargement of pore size and porosity of substrate) on the enhancement of TFC membrane performance. It must be noted that we obtain a higher water flux and salt rejection of PS0.5-TFN0.05 membrane compared to the results reported by Saleh et al.,28 which is attributed to the combined improvement of substrate and PA layer properties. However, when Al2O3 nanoparticles addition in PA layer is increased to 0.1 wt%, a sharp increase in solute permeability is noted. This is most probably caused by severe aggregation of Al2O3 nanoparticles in the PA layer, thus inducing deterioration of integrity of the PA layer and decreasing salt rejection. The results correspond to SEM images observed in Fig. 4d. The solute permeability/water permeability ratio (B/A ratio) is also presented in Table 3. Multiple studies have reported that the B/A ratio is an important parameter related to membrane selectivity in FO processes, where a small B/A ratio is preferred to reduced solute reverse diffusion.1,15,37,38 Considering the high water permeability and low B/A ratio, the PS0.5-TFN0.05 membrane exhibits good potential for FO application.
Table 3 Separation properties of TFC and TFN membranes
| Membrane |
Water permeabilitya (L m−2 h−1 bar) |
Solute permeabilityb (L m−2 h−1) |
B/A (bar) |
| Water permeability was measured in NF testing mode at 4 bar and DI water as feed solution. Solute permeability was measured in NF testing mode at 4 bar and 2000 ppm NaCl as feed solution. |
| PS-TFC |
4.03 |
0.55 |
0.14 |
| PS0.5-TFC |
4.95 |
0.65 |
0.13 |
| PS0.5-TFN0.05 |
8.43 |
1.66 |
0.20 |
| PS0.5-TFN0.1 |
12.78 |
21.8 |
1.66 |
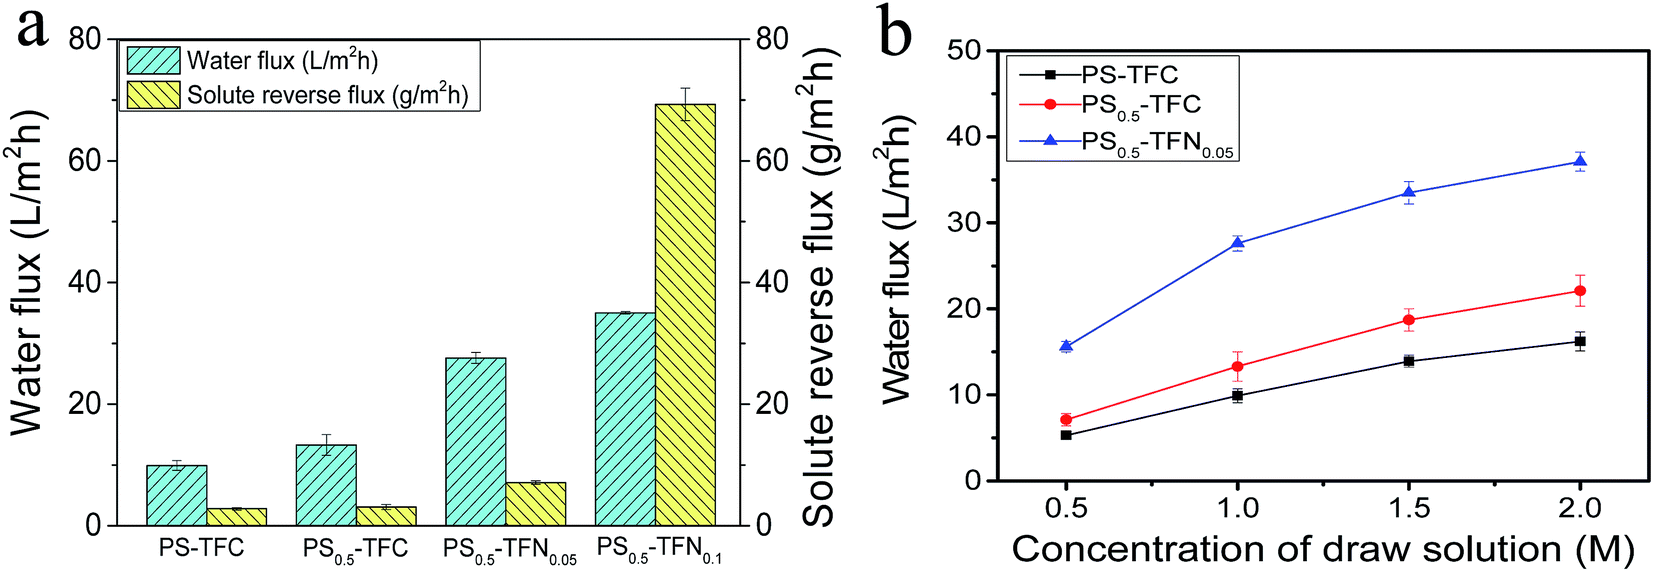
3.3.4 FO performance of TFC and TFN membranes. Fig. 6a compares the water flux and solute reverse flux of TFC and TFN membranes using DI water as feed solution and 1 M NaCl as draw solution. Clearly, PS0.5-TFC membrane (13.3 L m−2 h−1) exhibits higher water flux (13.3 L m−2 h−1) than PS-TFC membrane (9.9 L m−2 h−1) with slight increase in solute reverse flux. We believe that the enhancement in water flux resulted from substrate property (porosity and hydrophilicity) changes upon the addition of Al2O3 nanoparticles in substrate. These changes contribute to the much lower S value of PS0.5-TFC membrane than of PS-TFC membrane, as shown in Table 2, indicating that Al2O3 incorporation in substrate greatly improves mass transfer efficiency of the substrate, thus minimizing transport resistance against water permeation.10 When Al2O3 nanoparticles are incorporated in the PA layer, further enhancement in water flux of PS0.5-TFN0.05 membrane is observed. The PS0.5-TFN0.05 membrane shows a water flux of about 27.6 L m−2 h−1 with slight increase in solute reverse flux. We speculate that the improved water flux of PS0.5-TFN0.05 membranes was attributed to increased membrane surface roughness (and thus increased polyamide surface area) associated with improved hydrophilicity, which increases the transition rate of water molecules, thus leading to such water flux enhancement.5,15,17 Besides, the Al2O3 nanoparticles may also react as nanochannels in the PA layer. It should be noted that S value discussed here is the apparent value calculated from the flux-fitting method using eqn (9) instead of the intrinsic structural parameter of the substrate. Thus, the calculated apparent S value would be partially influenced by active layer properties, such as A and B values.42 However, further increase in Al2O3 nanoparticles at 0.1 wt% results in a slight enhancement in water flux and high solute reverse flux. The PS0.5-TFN0.1 membrane no longer possesses selectivity due to severe aggregation of Al2O3 nanoparticles and integrity destruction of PA layer. Similar change trends in water flux and solute reverse flux are also detected in AL-DS mode (Fig. S3†). Besides, the water flux and solute reverse flux of PS-TFC membrane, PS0.5-TFC membrane and PS0.5-TFN0.05 membrane using 10 mM NaCl as feed solution is also conducted and the results are presented in Fig. S4 and Table S2.† From the above results, we observe that instead of simple modification of substrate by addition of nanomaterials in dope solution, incorporation of nanomaterials in both substrate and PA layer may obtain a synergistic enhancement in FO performance and a higher increase in water flux, which is in accordance with the findings reported by Pendergast et al.43
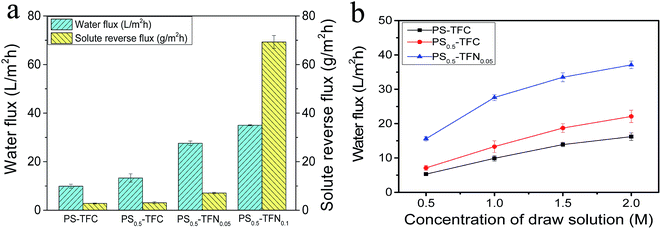 |
| | Fig. 6 Water flux and solute reverse flux of PS-TFC membrane, PS0.5-TFC membrane, PS0.5-TFN0.05 membrane and PS0.5-TFN0.1 membrane (a) (test conditions: DI water as feed solution, 1 M NaCl as draw solution, AL-FS); effect of DS concentration on water flux of PS-TFC membrane, PS0.5-TFC membrane, and PS0.5-TFN0.05 membrane (b) (test conditions: DI water as feed solution, 0.5 to 2.0 M NaCl as draw solution, AL-FS). | |
The FO performance of PS-TFC membrane, PS0.5-TFC membrane and PS0.5-TFN0.05 membrane is evaluated over a range of NaCl concentrations (0.5–2.0 M) and are presented in Fig. 6b. As can be seen, the water flux increases for each membrane with increasing DS concentration due to increased osmotic driving force. However, all membranes show a nonlinear increase in water flux at high NaCl concentration, which is most likely owing to dilutive ICP within the porous substrate. Besides, the large draw solution concentration may induce high salt leakage and thus reduce the overall osmotic driving force across the membrane.44 Table 4 summarizes the comparison of FO performance between the present work and FO membranes reported in literature. Clearly, we have obtained a higher water flux and acceptable solute reverse flux. This result demonstrates that Al2O3 nanoparticles would be a potential nanomaterial to fabricate high performance FO membranes.
Table 4 Comparison of FO performance between present work and FO membranes reported in literature
| FO membrane |
Jv (L m−2 h−1) AL-FS/AL-DS |
Js (g m−2 h−1) AL-FS/AL-DS |
FS |
DS |
| TFN membranes by addition of TiO2 on PS substrate1 |
17.1/31.2 |
2.9/6.66 |
10 mM NaCl |
0.5 M NaCl |
| CNT incorporated double-skinned TFN membranes18 |
8.3/— |
2.7/— |
DI water |
2 M MgCl2 |
| AqpZ-based lipid membrane through covalent bonding on PS substrate29 |
23.1/— |
3.1/— |
DI water |
2 M MgCl2 |
| MPD–TMC–NaY over PS substrate15 |
16.5/30 |
9.8/20.0 |
DI water |
1 M NaCl |
| TFN membrane upon addition of Al2O3 on PS substrate and PA layer (this work) |
27.6/51.5 |
7.1/12.7 |
DI water |
1 M NaCl |
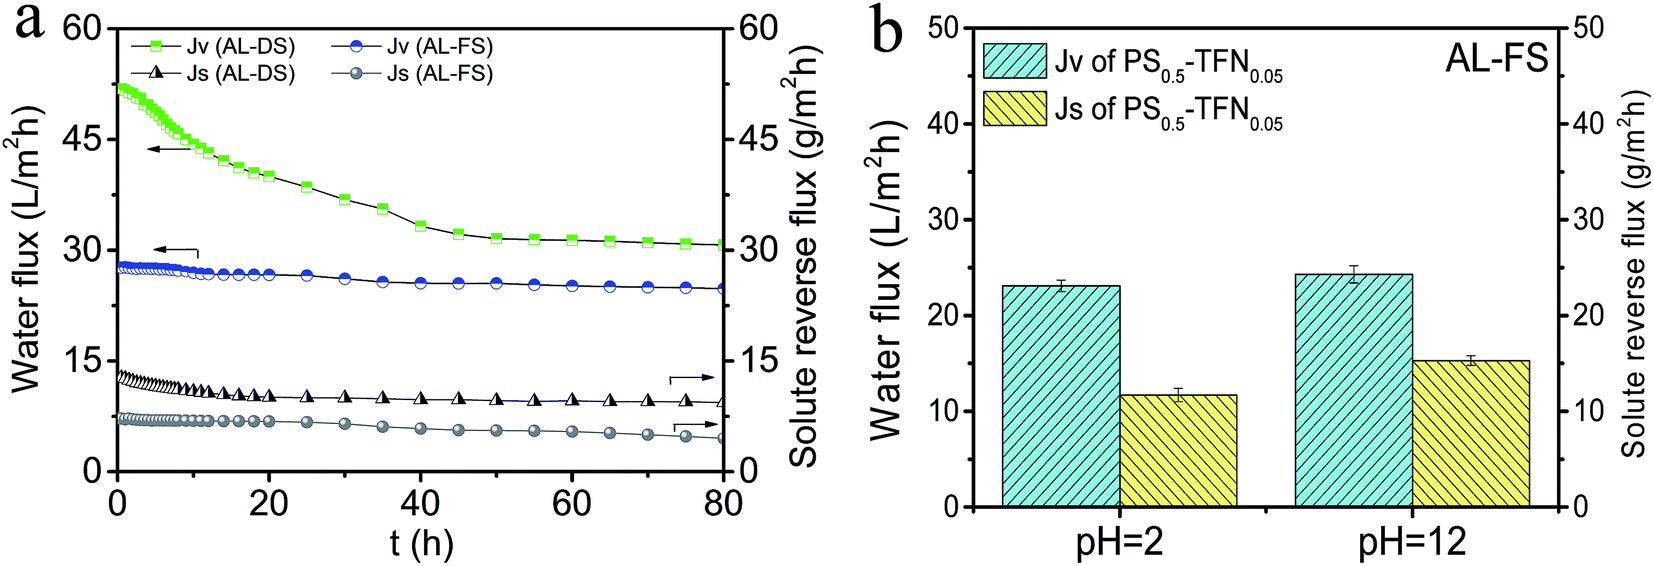
3.3.5 Stability of PS0.5-TFN0.05 membrane. To verify the stability of PS0.5-TFN0.05 membrane, 80 h FO test is performed in AL-FS and AL-DS modes, and the results are presented in Fig. 7a. As observed, the water flux of PS0.5-TFN0.05 membrane remains stable with a slight drop after 25 h operation in AL-FS orientation. The good stability of PS0.5-TFN0.05 membrane suggests that the improved properties of substrate and PA layer effectively minimized the effect of ICP on FO performance, leading to relatively stable water flux. When the membrane is oriented in AL-DS mode, different change trend in water flux is observed. The water flux shows a sharp decline in the first 40 h of FO test. Recently, Wang et al.45 have proposed FO shows more severe water flux decline in AL-DS orientation owing to greater water flux. They point that a minor decrease in bulk concentration difference would result in significant water flux decline. Higher water flux in AL-DS orientation is more susceptible to concentration difference variation, thus showing more severe water flux decrease during the long-term FO test. Finally, the membranes gain a steady but nearly a half of the initial flux.
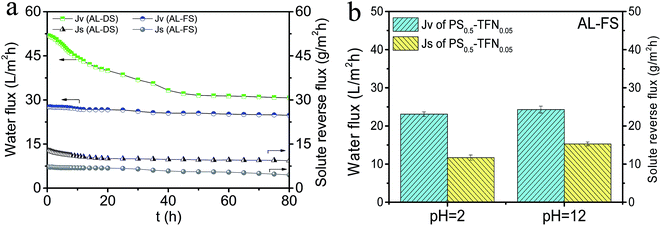 |
| | Fig. 7 (a) Water flux and solute reverse flux of PS0.5-TFN0.05 membrane during 80 h FO test (test conditions: DI water as feed solution, 1 M NaCl as draw solution, AL-FS mode and AL-DS mode); (b) water flux and solute reverse flux of PS0.5-TFN0.05 membrane after treatment with acid solution (pH = 2) and alkali solution (pH = 12) in AL-FS mode. | |
Most commercial polyamide TFC membranes allow stable operation within the pH range of 2 to 11. In the present work, we investigate the stability of PS0.5-TFN0.05 membrane stored in acid solution (pH = 2) and alkali solution (pH = 12) for 7 days. As observed in Fig. 7b, the water flux remains almost unchanged with slight increase in solute reverse flux after treatment of acid and alkali solutions, which demonstrates a highly stable PS0.5-TFN0.05 membrane. Nonetheless, we need to pay attention to the point that the integrity of PA layer is easily degraded under alkali conditions and the solute reverse flux displays a relative higher increase, which agrees with our previous work.46
4. Conclusions
In the present work, hydrophilic nano-sized Al2O3 nanoparticles were used as additives in both substrate and polyamide (PA) active layer to fabricate highly permeable FO membranes. By incorporation of Al2O3 nanoparticles in the substrate, the pore size, overall porosity and hydrophilicity greatly improved, leading to a smaller S value than that of pure PS substrate. Also, by addition of Al2O3 nanoparticles in the PA layer, further enhancement in water flux was achieved. Upon incorporation of 0.5 wt% Al2O3 in the substrate and 0.05 wt% Al2O3 in the PA layer (PS0.5-TFN0.05 membrane), the water flux reached 27.6 L m−2 h−1 with a relatively low solute reverse flux of 7.1 g m−2 h−1 using DI water as feed solution and 1 M NaCl as draw solution. Compared to the simple incorporation of nanomaterials in substrate, incorporation of nanomaterials in both substrate and PA layer had a better effect on FO performance and a higher water flux was obtained. Besides, the PS0.5-TFN0.05 membrane remained stable for a long time in FO test and under serious water environment. We believe that nano-sized Al2O3-based FO membranes will have a wide application in the field of water purification.
Conflicts of interest
There are no conflicts to declare.
Acknowledgements
This research was funded by the Major Projects of National High Technology Research and Development Program 863 (2013AA064401) and the Program for Innovative Research Team in University (IRT1289). This is MCTL Contribution No. 146.
References
- D. Emadzadeh, W. J. Lau, T. Matsuura, M. Rahbari-Sisakht and A. F. Ismail, Chem. Eng. J., 2014, 237, 70–80 CrossRef CAS.
- J. Ren and J. R. McCutcheon, Desalination, 2014, 343, 187–193 CrossRef CAS.
- Q. Ge, M. Ling and T. S. Chung, J. Membr. Sci., 2013, 442, 225–237 CrossRef CAS.
- S. Zhao, L. Zou, C. Y. Tang and D. Mulcahy, J. Membr. Sci., 2012, 396, 1–21 CrossRef CAS.
- M. Amini, M. Jahanshahi and A. Rahimpour, J. Membr. Sci., 2013, 435, 233–241 CrossRef CAS.
- B. Mi and M. Elimelech, J. Membr. Sci., 2010, 348, 337–345 CrossRef CAS.
- G. Han, S. Zhang, X. Li, N. Widjojo and T. S. Chung, Chem. Eng. Sci., 2012, 80, 219–231 CrossRef CAS.
- T. S. Chung, X. Li, R. C. Ong, Q. Ge, H. Wang and G. Han, Curr. Opin. Chem. Eng., 2012, 1, 246–257 CrossRef CAS.
- T. Cath, A. Childress and M. Elimelech, J. Membr. Sci., 2006, 281, 70–87 CrossRef CAS.
- N. Ma, J. Wei, S. Qi, Y. Zhao, Y. Gao and C. Y. Tang, J. Membr. Sci., 2013, 441, 54–62 CrossRef CAS.
- J. Su and T. S. Chung, J. Membr. Sci., 2011, 376, 214–224 CrossRef CAS.
- A. Tiraferri, N. Y. Yip, W. A. Phillip, J. D. Schiffman and M. Elimelech, J. Membr. Sci., 2011, 367, 340–352 CrossRef CAS.
- Z. Zhou, J. Y. Lee and T. S. Chung, Chem. Eng. J., 2014, 249, 236–245 CrossRef CAS.
- J. Wei, C. Qiu, C. Y. Tang, R. Wang and A. G. Fane, J. Membr. Sci., 2011, 372, 292–302 CrossRef CAS.
- N. Ma, J. Wei, R. Liao and C. Y. Tang, J. Membr. Sci., 2012, 405, 149–157 CrossRef.
- M. L. Lind, A. K. Ghosh, A. Jawor, X. Huang, W. Hou, Y. Yang and E. M. Hoek, Langmuir, 2009, 25, 10139–10145 CrossRef CAS PubMed.
- N. Niksefat, M. Jahanshahi and A. Rahimpour, Desalination, 2014, 343, 140–146 CrossRef CAS.
- X. Song, L. Wang, C. Y. Tang, Z. Wang and C. Gao, Desalination, 2015, 369, 1–9 CrossRef CAS.
- Y. Xu, X. L. Gao, X. J. Wang, Q. Wang, Z. Y. Ji, X. Y. Wang, T. Wu and C. J. Gao, Materials, 2016, 9(11), 870 CrossRef PubMed.
- S. Lim, M. J. Park, S. Phuntsho, L. D. Tijing, G. M. Nisola, W. G. Shim, W. J. Chung and H. K. Shon, Polymer, 2017, 110, 36–48 CrossRef CAS.
- P. Lu, S. Liang, L. Qiu, Y. Gao and Q. Wang, J. Membr. Sci., 2016, 504, 196–205 CrossRef CAS.
- N. Uzal, N. Ates, S. Saki, Y. E. Bulbul and Y. Chen, Sep. Purif. Technol., 2017, 187, 118–126 CrossRef CAS.
- L. Samain, A. Jaworski, M. Edén, D. M. Ladd, D. K. Seo, F. Javier Garcia-Garcia and U. Häussermann, J. Solid State Chem., 2014, 217, 1–8 CrossRef CAS.
- L. Yan, Y. Li, C. Xiang and S. Xianda, J. Membr. Sci., 2006, 276, 162–167 CrossRef CAS.
- Z. Wang, Y. M. Wei, Z. L. Xu, Y. Cao, Z. Q. Dong and X. L. Shi, J. Membr. Sci., 2016, 503, 69–80 CrossRef CAS.
- S. Hartmann, A. Sachse and A. Galarneau, Materials, 2012, 5, 336–349 CrossRef CAS.
- R. Bleta, P. Alphonse, L. Pin, M. Gressier and M. J. Menu, J. Colloid Interface Sci., 2012, 367, 120–128 CrossRef CAS PubMed.
- T. A. Saleh and V. K. Gupta, Sep. Purif. Technol., 2012, 89, 245–251 CrossRef CAS.
- W. D. Ding, J. Cai, Z. Y. Yu, Q. H. Wang, Z. N. Xu, Z. N. Wang and C. J. Gao, J. Mater. Chem. A, 2015, 3, 20118–20126 CAS.
- J. Garcia-Ivars, M. I. Alcaina-Miranda, M. I. Iborra-Clar, J. A. Mendoza-Roca and L. Pastor-Alcañiz, Sep. Purif. Technol., 2014, 128, 45–57 CrossRef CAS.
- E. Yuliwati, A. F. Ismail, T. Matsuura, M. A. Kassim and M. S. Abdullah, Desalination, 2011, 283, 214–220 CrossRef CAS.
- S. Zhang, P. Liu, Y. Chen, J. Jin, L. Hu and X. Jian, Chem. Eng. Sci., 2017, 166, 91–100 CrossRef CAS.
- F. Wang, J. P. Lin, Y. F. Liang, S. L. Shang and Z. K. Liu, Mater. Des., 2016, 109, 700–708 CrossRef CAS.
- L. Qin, Y. Zheng, D. Li, Y. Zhou, L. Zhang and Z. Zuhra, Fuel, 2016, 181, 827–835 CrossRef CAS.
- S. Wang, X. Li, S. Wang, Y. Li and Y. Zhai, Mater. Lett., 2008, 62, 3552–3554 CrossRef CAS.
- L. Zhu, S. Pu, K. Liu, T. Zhu, F. Lu and J. Li, Mater. Lett., 2012, 83, 73–75 CrossRef CAS.
- A. Zirehpour, A. Rahimpour and M. Ulbricht, J. Membr. Sci., 2017, 531, 59–67 CrossRef CAS.
- D. Emadzadeh, W. J. Lau and A. F. Ismail, Desalination, 2013, 330, 90–99 CrossRef CAS.
- S. Zinadini, S. Rostami, V. Vatanpour and E. Jalilian, J. Membr. Sci., 2017, 529, 133–141 CrossRef CAS.
- L. Liu, G. Zhu, Z. Liu and C. Gao, Desalination, 2016, 394, 72–82 CrossRef CAS.
- C. G. Jothi Prakash, C. Clement Raj and R. Prasanth, J. Colloid Interface Sci., 2017, 496, 300–310 CrossRef CAS PubMed.
- X. Liu and H. Y. Ng, J. Membr. Sci., 2015, 481, 148–163 CrossRef CAS.
- M. M. Pendergast, A. K. Ghosh and E. M. V. Hoek, Desalination, 2013, 308, 180–185 CrossRef CAS.
- G. Han, T. S. Chung, M. Toriida and S. Tamai, J. Membr. Sci., 2012, 423–424, 543–555 CrossRef CAS.
- Q. Wang, X. L. Gao, Y. S. Zhang, J. Wang, Y. Xu, Z. Y. Ji, X. Y. Wang and C. J. Gao, Chem. Eng. Res. Des., 2017, 117, 593–603 CrossRef CAS.
- K. P. Lee, J. Zheng, G. Bargeman, A. J. B. Kemperman and N. E. Benes, J. Membr. Sci., 2015, 478, 75–84 CrossRef CAS.
Footnote |
| † Electronic supplementary information (ESI) available. See DOI: 10.1039/c7ra04046f |
|
| This journal is © The Royal Society of Chemistry 2017 |
Click here to see how this site uses Cookies. View our privacy policy here. 
 Open Access Article
 This Open Access Article is licensed under a Creative Commons Attribution-Non Commercial 3.0 Unported Licence
 *ab,
Jianrui Zhangab,
Congcong Zhangab and
Jinren Lub
*ab,
Jianrui Zhangab,
Congcong Zhangab and
Jinren Lub