 Open Access Article
Creative Commons Attribution 3.0 Unported Licence
Catalyst tolerance to SO2 and water vapor of Mn based bimetallic oxides for NO deep oxidation by ozone
Fawei Lin,
Zhihua Wang *,
Jiaming Shao,
Dingkun Yuan,
Yong He,
Yanqun Zhu and
Kefa Cen
State Key Laboratory of Clean Energy Utilization, Zhejiang University, Hangzhou 310027, P. R. China. E-mail: wangzh@zju.edu.cn; Tel: +86-0571-87953162
First published on 10th May 2017
Abstract
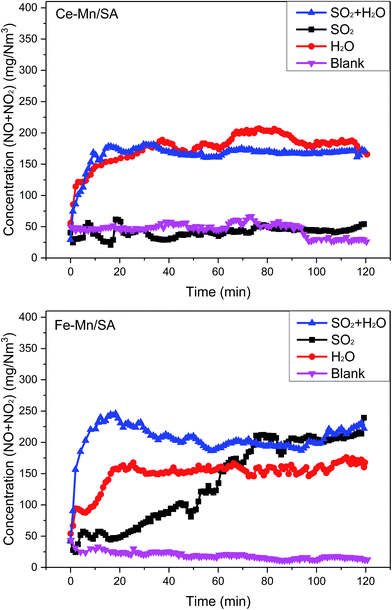
Improving the catalyst stabilities under different conditions (water vapor, SO2, both water vapor and SO2) is important for industrial applications regarding catalytic NO deep oxidation by ozone. In this paper, Ce–Mn/SA and Fe–Mn/SA catalysts were selected to investigate the stabilities. The results showed that the Ce–Mn/SA exhibited excellent stability and resistance to SO2, while the Fe–Mn/SA only displayed excellent stability without moisture and SO2. Almost a 50% drop in efficiency was observed after deactivation by water vapor and water vapor together with SO2 for the two catalysts. The Fe–Mn/SA displayed inferior resistance to SO2. After stability testing with water vapor, the surface area, pore volume, and average pore diameter all decreased. The low adsorption energy of the H2O molecule resulted in the superior adsorption of water vapor, which occupied large amounts of active sites. XPS results showed that the ratio of Mn4+ and chemisorbed oxygen decreased after deactivation. Mn4+ favors NO oxidation, while Mn3+ is favorable for ozone decomposition. Therefore, better performance in NO deep oxidation by ozone requires relative balance distribution between Mn4+ and Mn3+. Interestingly, the TPD results showed that the NO desorption peak was unaffected and even increased a lot after water vapor stability testing. This could be attributed to the nitrates, formed by the N2O5 and H2O in liquid phase, that were adsorbed on the catalyst surface prior to NO, which contributes to a bigger NO desorption peak with lower NO adsorption ability. The trace of sulfate formed after SO2 stability testing was verified from TPD and TGA results, but it was not observed from the FTIR spectra, indicating the sulfate species formed during the ozonation process may not exist on the catalyst surface.
1. Introduction
With the increasing threat to human health of air pollution, more and more strict emission standards are being issued worldwide. As well known, the combustion of fossil fuels (e.g. coal, petroleum) and municipal solid waste are the major anthropogenic source of air pollution.1–3 Several emission control technologies have been proposed and applied for the flue gas treatment.4–8 Hereinto, catalysts are becoming the critical part of these emission control technologies, including NOx reduction,4,9 NO oxidation,10,11 Hg0 oxidation,12,13 soot combustion,14 VOCs combustion,15,16 etc. The catalyst stability is a crucial factor when evaluating its feasibility for industrial applications. Furthermore, many components such as SO2,17 water vapor,12 ash, alkali metals (e.g. K, Na),18,19 and other harmful species (e.g. Pb, As, P)20 brought by flue gas from combustion of coal, petroleum, and municipal solid waste, would seriously deactivate the catalysts. Therefore, improving the catalyst resistance to these components is an important topic.Contrary to reduction method, oxidation method5,21–23 is regarded as a promising NOx control option for industrial boilers. Especially for the ultra-low emission, oxidation method can achieve extreme low emission concentration.24 Furthermore, Hg0 and VOCs can also be removed together with NOx by oxidation method.12,14 In the oxidation process, NO, the major species of nitrogen oxides in the flue gas, is oxidized into NO2 and N2O5; Hg0 is oxidized into Hg2+; VOCs can be oxidized into small molecule compounds. Then these oxidation products can be removed together with SO2 in typical WFGD (wet flue gas desulfurization) device.5 Ozone, characterized by long life time, strong oxidation ability, short reaction time, and large scale production, has always been regarded as the preferred oxidizing agent.25,26 However, the relatively high investment and running cost are becoming the biggest obstacles in promoting this technique.27 Therefore, catalysts are introduced to improve the oxidation efficiency with low ozone usage.28
The catalytic ozonation is usually carried out at low temperature due to the thermal accelerated ozone decomposition process. The previous works on catalytic ozonation reported that the catalyst was easily to be deactivated due to the accumulation of intermediate species. The SA (spherical alumina) instead of powder sample was selected as the catalyst support in our previous work28 to achieve the dispersive arrangement, which can enhance the desorption and decomposition of intermediate species. The manganese oxides supported on SA indeed exhibited good stability and resistance to SO2. However, it has been widely reported that water vapor will lead to catalyst deactivation for ozone decomposition.29,30 In this article, water vapor was introduced to investigate its influence on catalyst stability. Since SO2 is excluded in most of the ozone involved applications, no other previous works have studied the catalyst resistance to SO2 for catalytic ozonation and ozone decomposition to the best of our knowledge. In this study, the catalyst stabilities without moisture and SO2, with water vapor, with SO2, and with SO2 and water vapor were investigated, respectively. Ce–Mn/SA and Fe–Mn/SA, two catalysts displayed excellent activity, were selected to conduct these tests. Meanwhile, several kinds of characterization measurements were carried out to study the physicochemical properties before and after stability tests.
2. Experimental section
2.1 Catalyst preparation
The two catalyst samples were prepared by the wet coimpregnation method. The detailed procedures have been reported previously.28 Mn(CH3COO)2·4H2O (Aladdin, ≥99.0%), Ce(NO3)3·6H2O (Sinopharm, ≥99.0%), and Fe(NO3)3·9H2O (Sinopharm, ≥98.5%) were used as the precursor. The Mn loading was 5 wt%, and the molar ratio of Ce/Mn and Fe/Mn were 1/5, respectively. The catalyst samples are labelled as M–Mn/SA in this article. The M represents the Ce and Fe, respectively.2.2 Catalyst characterization
XRD (X-ray diffraction), XPS (X-ray photoelectron spectroscopy), TGA (Thermal gravimetric analysis), TPD (Temperature programmed desorption), FTIR (Fourier transform infrared spectroscopy) and N2 adsorption–desorption isotherms were detected for these catalyst samples. These samples that had undergone various stages of use are labelled as listed in Table 1.| Denotation | Sample | |
|---|---|---|
| Ce–Mn/SA-a | Fe–Mn/SA-a | Fresh catalyst |
| Ce–Mn/SA-b | Fe–Mn/SA-b | Catalyst after stability testing for 120 min |
| Ce–Mn/SA-c | Fe–Mn/SA-c | Catalyst after stability testing with water vapor for 120 min |
| Ce–Mn/SA-d | Fe–Mn/SA-d | Catalyst after stability testing with SO2 for 120 min |
| Ce–Mn/SA-e | Fe–Mn/SA-e | Catalyst after stability testing with SO2 and water vapor for 120 min |
XRD patterns were recorded on a Rigaku D/max 2550PC diffractometer with a scan rate of 4° min−1 using Cu Kα radiation.
XPS spectra were collected on a photoelectron spectrometer (Thermo Scientific Escalab 250Xi) with a standard Al Kα source (1486.6 eV) after referencing to the C 1s line at 284.5 eV. The XRS results of fresh samples are listed in the other articles but the distribution molar ratios are mentioned for reference.
The weight loss at different temperatures can be used to estimate the mass of nitrogen species and sulfur species formed on the catalyst surface. Therefore, TGA and DTA (differential thermal analysis) curves were detected through a thermo-gravimetric analyzer (TA-Q500 TGA). 10 mg of each sample was loaded onto the reactor without any pretreatment. Then sample was heated up to 1000 °C at a rate of 10 °C min−1 under N2 atmosphere. The TGA and DTA curves from 50 °C to 1000 °C were obtained.
TPD patterns were obtained using an automatic temperature programmed chemisorption analyzer (Micromeritics AutoChem II 2920) together with a mass spectrometer (Hiden QIC20). 50 mg of each sample were loaded into a U type quartz tube, then the furnace was heated to 100 °C at a rate of 10 °C min−1 under He atmosphere and maintained for 30 min to remove adsorbed water and some other impurities. After pretreatment, the mass spectrometer began testing. Sequentially, the furnace was heated to 1000 °C at a rate of 10 °C min−1 under He atmosphere. The TCD signals of NO, O2, and SO2 were obtained from the mass spectrometer.
FTIR spectra detected by a Nicolet 5700 FTIR spectrometer with 0.09 cm−1 resolution can be used to evaluate the formed species on the catalyst surface after ozonation process.
N2 adsorption–desorption isotherms were recorded in a Micromeritics ASAP 2020 equipment under liquid N2 (77 K). Prior to analysis, the samples were degassed at 473 K for 5 h.
2.3 Stability testing procedure
The stability testing was carried out in the same reactor mentioned in ref. 28. The total gas flow rate was kept at 2 L min−1, with oxygen concentration of 2.5 vol%, and the corresponding residence time in the reactor about 0.12 s. The initial NO concentration was fixed at 410 mg N−1 m−3 with small amount of NO2 residual in the cylinder. The O3/NO molar ratio was fixed at 1.5 with ozone injection amount of 642 mg N−1 m−3. In addition, SO2 and water vapor were added into the reactor when assaying the catalyst stability with SO2 and water vapor. SO2 was from bottled gas supplied by Jingong Gas Co., Ltd. (SO2-5%/balance N2) and the concentration was controlled by MFC (mass flow controller) at 285 mg N−1 m−3. Water vapor was added by bubbling through heating water and the concentration was ∼10 vol%. The concentrations of SO2 and water vapor were also measured by an FTIR (Fourier transform infrared spectroscopy) gas analyzer. The other instruments and testing procedure have been mentioned in previous work.28For each testing, after 15 min ozone injection, the concentrations of NO + NO2 tends to be stable. Thus, SO2 and water vapor were added into the reactor after 15 min ozone injection. For comparison, these stabilities testing without SO2 and water vapor were also recorded after 15 min ozone injection.
3. Results and discussion
3.1 Catalytic stabilities testing
The Ce–Mn/SA and Fe–Mn/SA were used to investigate the catalyst stability. As the blank results shown in Fig. 1, the concentrations of NO + NO2 were stable with catalytic reaction time of 0.12 s at 100 °C. However, the stabilities with SO2 showed obvious difference for these two samples. The introduction of SO2 almost had no effect on Ce–Mn/SA during the 120 min testing, which means the Ce–Mn/SA had strong resistance to SO2. But the concentration of NO + NO2 increased quickly after SO2 addition for Fe–Mn/SA. Only after 80 min, more than 200 mg N−1 m−3 of NO + NO2 was detected, which means the Fe–Mn/SA was deactivated seriously by SO2. Generally, the NO adsorption ability will be inhibited seriously after deactivated by SO2. But the previous work28 found that the presence of ozone could enhance the adsorption of NOx when exposed to SO2. This was attributed to the oxidation between ozone and NOx, which could greatly enhance the chemical adsorption of NOx. Therefore, the catalyst activity could be maintained even with SO2 for Ce–Mn/SA. But the resistance was no longer appeared when the Fe–Mn/SA was used. According to the XPS results showed below, the valance state of Mn species of Fe–Mn/SA was changed obviously after stability testing with SO2, while the Ce–Mn/SA was maintained, which can be the explanation for the worse resistance to SO2 of Fe–Mn/SA. Therefore, the metal interaction resulted in distinct resistance to SO2.Several previous works have pointed out that the presence of water vapor can lead to catalyst deactivation for catalytic ozone decomposition29,30 and catalytic ozonation.31 The adsorption energy of water vapor is lower than other reactants, indicating stronger adsorption.32 Then the H2O molecule adsorbed on the catalyst surface is hard to desorb. As shown in Fig. 1, the concentration of NO + NO2 increased significantly after the addition of water vapor for the two catalysts. After nearly 20 min, the concentration trended to be stable. In comparison, the stable concentration was about 200 mg N−1 m−3 for Ce–Mn/SA, and about 150 mg N−1 m−3 for Fe–Mn/SA, indicating the Fe–Mn/SA resistance to water vapor was higher than Ce–Mn/SA.
Finally, the SO2 and water vapor were introduced into the reactor together. Generally, the coexistence of SO2 and water vapor will promote the formation of sulfur species on the catalyst surface. Thus, the catalyst deactivation will be more serious in this condition. It can be observed from the results of Ce–Mn/SA in Fig. 1 that the concentration of NO + NO2 after the addition of SO2 and water vapor was similar with the addition of single water vapor. For Fe–Mn/SA, after the addition of SO2 and water vapor, the concentration of NO + NO2 increased sharply to nearly 250 mg N−1 m−3 after 15 min. Then it decreased and stabled at nearly 200 mg N−1 m−3, which was similar with stable concentration after addition of SO2. This illustrates that except for the initial sharply deactivation, the final stable results were not enhanced by the coexistence of SO2 and water vapor.
3.2 Crystallite structures
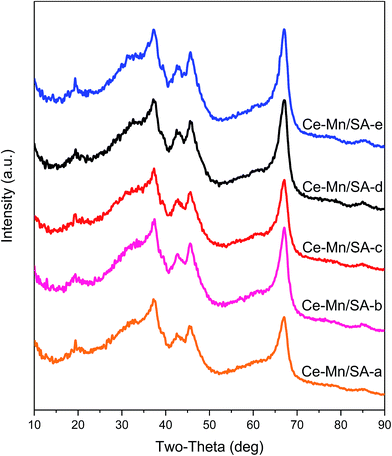
The Ce–Mn/SA was selected to investigate the crystallite structures change after stabilities testing. The results can be found in Fig. 2 there was no new peaks after these four stabilities testing. The only change was the peak intensity. The main peak between 60 deg and 70 deg can be used for analysis. After deep oxidation stability testing, the peak intensity increased (from Ce–Mn/SA-a to Ce–Mn/SA-b), indicating the stronger crystallization. According to the main reaction pathway of catalytic NO deep oxidation by ozone proposed in our previous work,28 the active metals were firstly oxidized by ozone and then forwarded to oxidize nitrogen oxides, which accounted for the stronger crystallization after deep oxidation by ozone. After the stability testing with water vapor (Ce–Mn/SA-c), the peak intensity went back to the same level as fresh catalyst (Ce–Mn/SA-a). This also verifies the significant deactivation in the presence of water vapor. For Ce–Mn/SA-d, the peak intensity was similar with Ce–Mn/SA-b, which was corresponding to the similar results between blank stability testing and with SO2. However, the peak intensity of Ce–Mn/SA-e had almost no difference with Ce–Mn/SA-d.3.3 Porous structure parameters
The change of porous structure parameters induced by deep oxidation with SO2 treatment has been reported in earlier study.28 However, this paper focused on the effect of water vapor on catalyst porous structure. Therefore, the N2 adsorption–desorption isotherms and pore size distribution curves of Ce–Mn/SA and Fe–Mn/SA after stabilities testing with and without water vapor were investigated and shown in Fig. 3. It can be observed that these two catalysts after stabilities testing still exhibited IV isotherm with H1 hysteresis loop. After the addition of water vapor, little decrease of quantity adsorbed could be detected. The pore distribution showed no obvious change. As the pore structure parameters shown in Table 2, the presence of water vapor could lead to the decrease of surface area, pore volume. It should be mentioned that the deactivation by water vapor is reversible. Some pores occupied by H2O molecules maybe recovered after testing though without heating. It is believed that the real-time pore parameters should be lower than these data shown in Table 2. As mentioned above, the adsorption energy of H2O molecule is lower than other reactants. Then the H2O molecule can be easier adsorbed into the pore when compared with other molecules. Therefore, the H2O molecule not only grabbed the adsorption active sites, but also resulted in large numbers of pores being occupied. Finally, there were few active sites could be used for adsorption and reaction of reactants.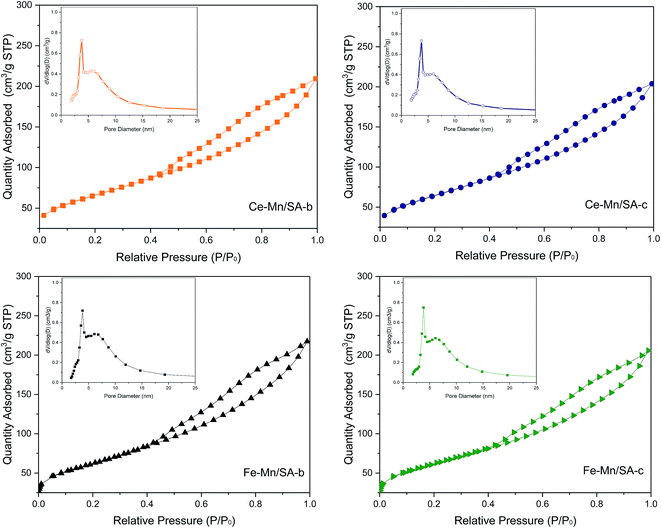 | ||
| Fig. 3 N2 adsorption–desorption isotherms and pore size distribution curves of Ce–Mn/SA and Fe–Mn/SA after stabilities testing with and without water vapor. | ||
| Catalyst | BET surface area/m2 gcat−1 | Pore volumea/cm3 gcat−1 | Average pore diameterb/nm |
|---|---|---|---|
| a BJH desorption cumulative volume of pores.b BJH desorption average pore diameter. | |||
| Ce–Mn/SA-a | 318.7 | 0.43 | 4.8 |
| Ce–Mn/SA-b | 239.1 | 0.32 | 4.9 |
| Ce–Mn/SA-c | 236.1 | 0.31 | 4.8 |
| Fe–Mn/SA-a | 228.9 | 0.32 | 5.0 |
| Fe–Mn/SA-b | 225.8 | 0.35 | 5.4 |
| Fe–Mn/SA-c | 223.7 | 0.31 | 5.4 |
3.4 Surface atom state
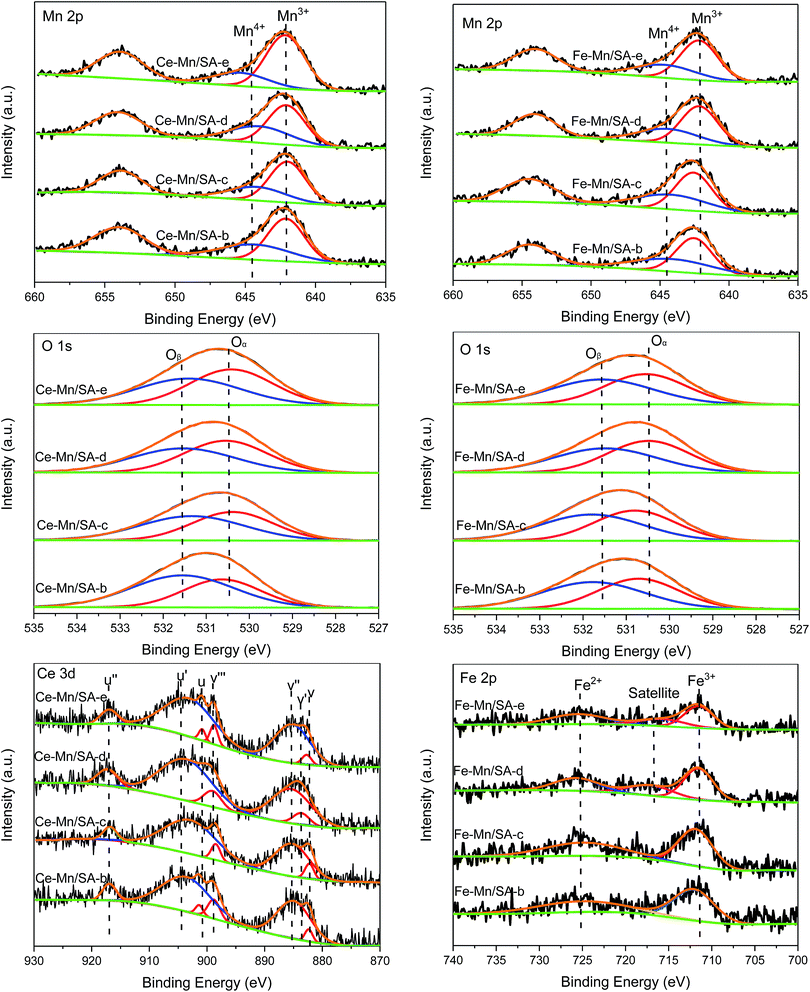
The surface atom states were evaluated by XPS analysis, and the Mn 2p, O 1s, Ce 3d, and Fe 2p spectra are shown in Fig. 4. The Mn 2p signals exhibited a spin orbit doublet with Mn 2p3/2 and Mn 2p1/2. After peak-fit processing through the optimum combination of Gaussian peaks method, two main peaks could be obtained in the Mn 2p3/2 region, which were ascribed to Mn3+ and Mn4+ species.33,34 Only one region could be detected for the O 1s spectra. And it could be deconvoluted into two main peaks represent lattice oxygen Oα and chemisorbed oxygen Oβ,35,36 respectively. The specific binding energy of Mn and oxygen species were shown in Tables 3 and 4. Meanwhile, the molar ratio of Mn4+ and Oβ were calculated by quantitative area integration method and listed in Tables 3 and 4 for comparison.| Sample | Mn3+ (eV) | Mn4+ (eV) | Mn4+/Mn | Oα (eV) | Oβ (eV) | Oβ/O |
|---|---|---|---|---|---|---|
| Ce–Mn/SA-b | 642.1 | 644.3 | 0.41 | 530.6 | 531.6 | 0.60 |
| Ce–Mn/SA-c | 642.0 | 644.1 | 0.34 | 530.4 | 531.3 | 0.53 |
| Ce–Mn/SA-d | 642.1 | 644.0 | 0.40 | 530.6 | 531.5 | 0.49 |
| Ce–Mn/SA-e | 642.2 | 645.4 | 0.26 | 530.4 | 531.4 | 0.48 |
| Sample | Mn3+ (eV) | Mn4+ (eV) | Mn4+/Mn | Oα (eV) | Oβ (eV) | Oβ/O |
|---|---|---|---|---|---|---|
| Fe–Mn/SA-b | 642.5 | 644.1 | 0.44 | 530.7 | 531.8 | 0.53 |
| Fe–Mn/SA-c | 642.6 | 644.2 | 0.43 | 530.8 | 531.8 | 0.52 |
| Fe–Mn/SA-d | 642.2 | 644.4 | 0.37 | 530.5 | 531.5 | 0.48 |
| Fe–Mn/SA-e | 642.2 | 644.7 | 0.35 | 530.6 | 531.6 | 0.51 |
For Ce–Mn/SA, the ratio of Mn4+ decreased (Ce–Mn/SA-b) after stability testing (the Mn4+/Mn is 0.55 for Ce–Mn/SA-a). Eqn (1) depicts the main reaction pathway for catalytic NO deep oxidation by ozone,28 indicating Mn4+ played as the intermediate oxidant in the reaction process. This explains the observed decrease of Mn4+ after stabilities testing. According to eqn (2), the consumed Mn4+ would be continuously replenished by ozone. Meanwhile, in light of eqn (1), the observed conversion from lattice oxygen (O−[Mn4+]) to chemisorbed oxygen (NO3–Mn) would resulting in the increase of Oβ after stabilities testing shown in Table 3 (the Oβ/O is 0.43 for Ce–Mn/SA-a). After the stability testing with water vapor (Ce–Mn/SA-c), with SO2 (Ce–Mn/SA-d), and with both SO2 and water vapor (Ce–Mn/SA-e), the ratios of Mn4+ all decreased when compared with Ce–Mn/SA-b, which might be relevant to the agglomeration of manganese oxides. Mn4+ favors for NO oxidation, while Mn3+ is favorable for ozone decomposition. Therefore, the relative balance distribution between Mn4+ and Mn3+ is beneficial to catalytic NO deep oxidation by ozone. The ratios of Mn4+ for Ce–Mn/SA-c and Ce–Mn/SA-e were lower than Ce–Mn/SA-b and Ce–Mn/SA-d, which might cause the catalyst deactivation in the presence of water vapor and water vapor together with SO2. The ratios of chemisorbed oxygen decreased after stabilities testing with water vapor (Ce–Mn/SA-c, Ce–Mn/SA-d, Ce–Mn/SA-e) compared with Ce–Mn/SA-b. The decrease of Ce–Mn/SA-d indicates that the sulfur species were not accumulated on the catalyst surface, which agrees with the FTIR results shown below. The decreases of Ce–Mn/SA-c and Ce–Mn/SA-e resulted in the lower NO deep oxidation efficiency.
| O−[Mn4+] + NO2–Mn → NO3–Mn + [Mn3+] | (1) |
| O3 + [Mn3+] → O−[Mn4+] + O2 | (2) |
For Fe–Mn/SA, due to the deactivation in the presence of SO2, the ratio of Mn4+ for catalyst after stability testing (Fe–Mn/SA-d) decreased from 0.44 (Fe–Mn/SA-b) to 0.37, which was different from Ce–Mn/SA (decreased from 0.41 (Ce–Mn/SA-b) to 0.40 (Ce–Mn/SA-d)). This phenomenon can explain the worse resistance to SO2 of Fe–Mn/SA than Ce–Mn/SA. The other samples had the same variation tendency with Ce–Mn/SA because of the similar stability results. The chemisorbed oxygen distributions were almost the same among these four samples. When the catalyst was exposed to water vapor, the adsorption of H2O molecule could increase the chemisorbed oxygen, while the deactivation would lead to the decrease of chemisorbed oxygen. The synthetic effect would therefore result in tiny change of chemisorbed oxygen.
The Ce 3d spectra of Ce–Mn/SA after stabilities testing are also shown in Fig. 4. The characteristic peaks included 3d5/2 states (labelled as v) and 3d3/2 states (labelled as u). After peak-fit processing, the XPS spectra were deconvoluted into several peaks. The v′ and u′ represented Ce3+ species, and the others represented Ce4+ species.37–39 The binding energies and molar ratio of Ce4+ calculated by quantitative area integration method are listed in Table 5. After stability testing (Ce–Mn/SA-b), the ratio of Ce4+ increased compared with fresh catalyst (Ce–Mn/SA-a, 0.47). After exposure to water vapor (Ce–Mn/SA-c), the ratio of Ce4+ decreased slightly compared with Ce–Mn/SA-b, corresponding to the catalyst deactivation. For Ce–Mn/SA-d, the decrease of Ce4+ might be related to the reduction of Ce4+ to Ce3+ by SO2. The higher ratio of Ce4+ for Ce–Mn/SA-e compared with Ce–Mn/SA-c was corresponding to slightly better performance in presence of water vapor together with SO2 than single presence of water vapor shown in Fig. 1.
| Sample | v (eV) | v′ (eV) | v′′ (eV) | v′′′ (eV) | u (eV) | u′ (eV) | u′′ (eV) | Ce4+/Ce |
|---|---|---|---|---|---|---|---|---|
| Ce–Mn/SA-b | 882.4 | — | 885.0 | 898.8 | 901.4 | 903.7 | 916.9 | 0.53 |
| Ce–Mn/SA-c | 882.2 | — | 885.3 | 898.5 | — | 902.9 | 916.8 | 0.47 |
| Ce–Mn/SA-d | — | 883.6 | 885.4 | 899.1 | — | 903.7 | 917.3 | 0.46 |
| Ce–Mn/SA-e | 882.7 | — | 885.2 | 898.8 | 900.8 | 903.1 | 917.0 | 0.50 |
The Fe 2p XPS spectra shown in Fig. 4 included two main peaks, Fe3+ and Fe2+.40 While for Fe–Mn/SA-d and Fe–Mn/SA-e, the satellite peak appeared. The binding energies and molar ratio of Fe3+ are listed in Table 6. The variation tendency of Fe3+ was similar with Ce4+ mentioned above after stabilities testing. It can be observed that the ratio of Fe3+ for Fe–Mn/SA-d was much lower than Fe–Mn/SA-c, which was corresponding to the better resistance to water vapor than SO2 shown in Fig. 1. When the catalyst was exposed to water vapor together with SO2, the ratio of Fe3+ became the lowest among all these samples. It can be found that the ratio of Fe3+ was corresponding to the performance of stability testing.
| Sample | Fe3+ (eV) | Satellite (eV) | Fe2+ (eV) | Fe3+/Fetotal |
|---|---|---|---|---|
| Fe–Mn/SA-b | 712.1 | — | 725.1 | 0.56 |
| Fe–Mn/SA-c | 711.9 | — | 724.9 | 0.54 |
| Fe–Mn/SA-d | 711.5 | 717.1 | 725.7 | 0.48 |
| Fe–Mn/SA-e | 711.5 | 715.7 | 725.5 | 0.42 |
3.5 Temperature programmed desorption
As the TPD profiles for these catalysts after stabilities testing shown in Fig. 5, desorption of NO, O2, and SO2 can be detected during the heating process. Because the major desorption specie of nitrogen oxides is NO, the NO2 profiles were ignored. It should be mentioned that the TCD signals of NO, O2, and SO2 for Fe–Mn/SA in Fig. 5 are all 1/2 compared with Ce–Mn/SA.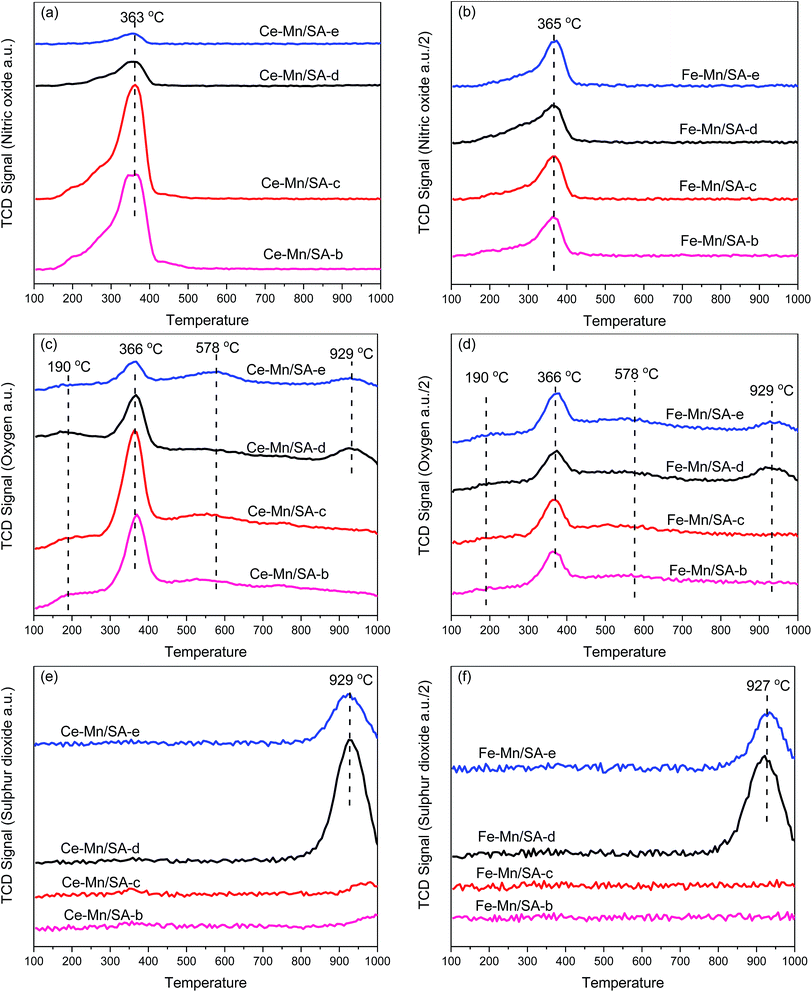 | ||
| Fig. 5 TPD profiles of NO, O2, and SO2 for catalysts after stabilities testing. (a) and (b) NO-TPD; (c) and (d) O2-TPD; (e) and (f) SO2-TPD. | ||
For NO-TPD, only one peak around 365 °C could be observed for all samples, which can be ascribed to the desorption of monodentate and bidentate nitrate species.41,42 However, the TCD signal of NO began at 150 °C, and increased sharply from 300 °C. Actually, the NO desorption between 150 °C and 300 °C was associated with the weakly adsorbed nitrogen species on the catalyst surface.43,44 After stability testing without moisture and SO2, the NO desorption of Fe–Mn/SA-b was extremely lower than Ce–Mn/SA-b. This indicates the NO adsorption ability of Ce–Mn/SA was quite higher than Fe–Mn/SA. Furthermore, the TCD signal of NO between 150 °C and 300 °C was very weak for Fe–Mn/SA, indicating less weakly adsorbed nitrogen species on the catalyst surface. After stability testing with water vapor (Ce–Mn/SA-c), the NO desorption peak became slightly bigger compared with Ce–Mn/SA-b, which agrees with TGA results shown below. At the reaction temperature of 100 °C, some H2O in liquid phase would easily react with N2O5, the major products after catalytic reaction. Therefore, the slightly bigger NO desorption peak could be attributed to the interaction between N2O5 and H2O, which would give rise to more adsorbed nitrates on the catalyst surface. Therefore, rather than better NO adsorption ability, more nitrates formed and adsorbed on the catalysts surface can be predicted from the enhanced NO desorption peak due to the serious catalyst deactivation. Above all, the nitrates grabbed the adsorption active sites for NO, which led to lower NO adsorption. The deactivation was also attributed to the atom state change and pore blocking, which severely inhibit ozone decomposition process.29,30 Previous works on catalytic NO oxidation11,45 also pointed out that the NO adsorption ability would be reduced by water vapor. Therefore, it can be concluded that the coexistence of ozone and water vapor enhanced the nitrates formation on the catalyst surface while the NO adsorption ability was inhibited. Interestingly, Fe–Mn/SA had even better performance for NO deep oxidation by ozone despite the lower NO adsorption ability compared with Ce–Mn/SA. The abundant oxygen vacancies of cerium oxides are beneficial to NO adsorption. After stabilities testing in the presence of SO2 (Ce–Mn/SA-d and Ce–Mn/SA-e), the TCD signals of NO decreased obviously, which agreed with the results obtained in previous work.28 However, although the NO adsorption ability decreased seriously with SO2, the catalyst performance seemed to be unaffected. When the water vapor was added together with SO2, the NO desorption peak became feebler. This inhibition effect could be attributed to sulfates formation, which took precedence over nitrates formation. Thus, the coexistence of water vapor and SO2 led to the greatest breakage for catalyst activity. More interestingly, almost no discrepancy of the NO-TCD signals was observed for all the four Fe–Mn/SA samples, while the catalyst performance was greatly affected by the introduction of water vapor and SO2. This illustrates that the NO adsorption ability of Fe–Mn/SA was unaffected by SO2, and the deactivation might be related to the change of ozone decomposition activity.
There were two main desorption peaks associated with two weak desorption peaks in the O2-TPD profiles. The first big desorption peak at 366 °C (similar with 363 °C and 365 °C of NO-TPD) was mainly ascribed to the decomposition of nitrate species.28 The second big desorption peak at 929 °C (similar with 929 °C and 927 °C of SO2-TPD) was mainly ascribed to the decomposition of sulfate species. The weak desorption peak at lower temperature was attributed to desorption of physical adsorption water.32 The release of chemisorbed oxygen species and surface lattice oxygen species corresponded to the desorption region between 200 °C and 300 °C.32 The weak desorption peak at higher temperature was attributed to the release of lattice oxygen species and metal phase transformation. The variation tendency of O2-TPD was the same with NO-TPD.
The SO2 desorption peak could be detected only when the catalyst was tested in the presence of SO2. Compared with our previous work,28 the SO2 desorption temperature increased after doping with second transition metal oxides. Generally, the thermal decomposition of sulfate includes two steps: initial decomposition with the formation of oxysulfates and second decomposition with the formation of metal oxides and SO2.46 Undoubtedly, the second step corresponding to the SO2-TPD results occurs at higher temperature. It has been mentioned that the bulk MnSO4 and Al2(SO4)3 decomposition temperatures are 850 °C and 770 °C,47 respectively. The decomposition of bulk sulfates of cerium and evolution of SO2 occurs at 750 °C.48 The thermal decomposition of sulfates of iron to Fe2O3 and SO2 occurs at 658 °C.49 It can be observed that the SO2 desorption peak temperature in Fig. 5 was much higher than these sulfates decomposition temperature, which might be attributed to the synthetic effects between metal oxides. It can be also observed that the SO2 desorption peak became smaller for sample-e compared with sample-d. This illustrates that the coexistence of SO2 and water vapor decreased the formation of bulk sulfates.
3.6 Thermal gravimetric analysis
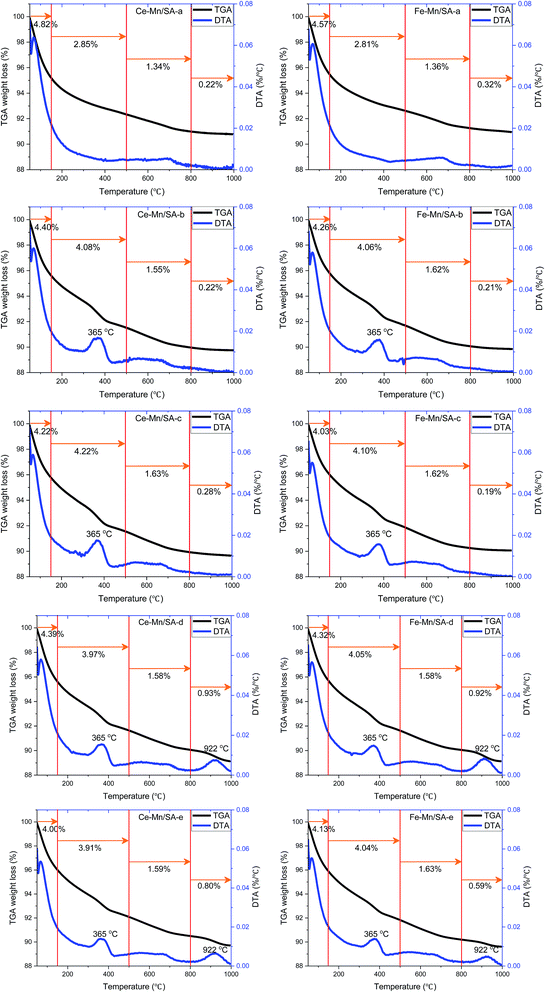
The thermal gravimetric analysis was carried out to investigate the weight loss along with temperature. The weight loss at different temperature region can be used to compare the amounts of species formed after stabilities testing. Therefore, the TGA/DTA curves were divided into four regions as shown in Fig. 6, and the weight loss amounts in different region were also listed for comparison.The first region from 50 °C to 150 °C contributed the major weight loss for all samples, which was the dehydration process. Interestingly, for both Ce–Mn/SA and Fe–Mn/SA, the weight losses of the dehydration process decreased after stabilities testing (Ce–Mn/SA-b and Fe–Mn/SA-b) compared with fresh catalysts (Ce–Mn/SA-a and Fe–Mn/SA-a). Even the catalysts were tested in presence of water vapor (Ce–Mn/SA-c and Fe–Mn/SA-c), the weight losses of the dehydration process decreased as well. It can be speculated that some radicals related to H2O would participate in the catalytic reaction to form the nitrates and nitrites.
The second region from 150 °C to 500 °C could be ascribed to the nitrates and nitrites desorption region as the NO-TPD results, which exhibited a weight loss peak at 365 °C. Some residual chemisorbed radicals which were not desorbed in the first region would also contribute to the weight loss. That's why there were also more than 2.8% weight loss for these two fresh catalysts. It could be seen that the weight losses in the second region increased after stabilities testing with water vapor even the catalyst deactivation had occurred. This results agree with the NO-TPD and O2-TPD results. For Fe–Mn/SA, the weight losses in the second region stayed at about 4.05% in all the explored conditions.
The third region from 500 °C to 800 °C was corresponding to the transformation of MnO2 to Mn2O3 as mentioned above.
Finally, the fourth region from 800 °C to 1000 °C was the sulfates decomposition region, which was corresponding to the SO2-TPD results. The weight losses decreased in this region for catalysts that were exposed to water vapor together with SO2 (Ce–Mn/SA-e and Fe–Mn/SA-e) compared with only exposure to SO2 (Ce–Mn/SA-d and Fe–Mn/SA-d). This indicates that the coexistence of water vapor and SO2 inhibited the sulfates formation to some extend during the catalytic process. As mentioned above, the adsorption energy of H2O molecule is very low, resulting in the superior adsorption ability compared with SO2.
3.7 Surface properties
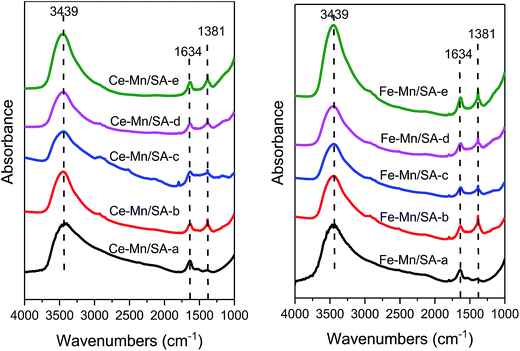
As shown in Fig. 7, the FTIR technique was used to detect the species formed on the catalyst surface after stabilities testing. The bands at 3439 cm−1 stood for the O–H stretching modes of hydrogen-bonded H2O molecules on alumina support.50 The bands at 1634 cm−1 were ascribed to bridging nitrate.45,51 Almost no discrepancy could be detected between these samples. Therefore, the bridging nitrate may be the undecomposed nitrate from the precursors. The bands at 1381 cm−1 were the main formation species on the catalyst surface: free nitrates,11 including bidentate nitrate,52 monodentate nitrate,53 and ionic nitrate.53 This band appeared only for the samples after stabilities testing. Interestingly, even after catalyst deactivation induced by the introduction of water vapor and SO2, the intensity of this band showed no obvious change. Meanwhile, no sulfates bands could be detected in Fig. 7. It can be therefore speculated some bulk nitrates and sulfates that produced during the ozonation process cannot be detected on the catalyst surface.4. Conclusions
The catalyst stabilities under different conditions (water vapor, SO2, both water vapor and SO2) were conducted for catalytic NO deep oxidation by ozone. It was found that the Ce–Mn/SA exhibited excellent stability and resistance to SO2, but a 50% drop in efficiency was observed after catalyst deactivation by water vapor and water vapor together with SO2. The Fe–Mn/SA also displayed excellent stability while showed inferior resistance to SO2 and water vapor. Almost 50% drop in efficiency was observed when the catalyst was exposed to water vapor and SO2 (single or together).XRD, N2 adsorption–desorption isotherms, XPS, TPD, TGA, and FTIR were conducted to investigate the poisoning mechanism. After stabilities testing with water vapor, the surface area, pore volume, and average pore diameter all decreased. Meanwhile, the ratio of Mn4+ and chemisorbed oxygen decreased after deactivation. The low adsorption energy of H2O molecule results in the preferential adsorption of water vapor, which occupied large amounts of active sites. Furthermore, the nitrates, formed by the N2O5 and H2O in liquid phase, were adsorbed on the catalyst surface prior to NO, which contributes to bigger NO desorption peak with lower NO adsorption ability. No sulfate species were detected on the FTIR spectra while SO2 desorption peaks were observed from the TPD and TGA analysis, indicating that the sulfate species formed during the ozonation process may not exist on the catalyst surface. Above all, the key to increase the catalyst resistance to water vapor is to intensify the ozone decomposition activity in the presence of water vapor.
Acknowledgements
This work was supported by the National Natural Science Foundation of China (51422605), and the Zhejiang Provincial Natural Science Foundation (LR16E060001).References
- T. Covert, M. Greenstone and C. R. Knittel, Journal of Economic Perspectives, 2016, 30, 117–137 CrossRef.
- J. González-Prior, R. López-Fonseca, J. Gutiérrez-Ortiz and B. de Rivas, Appl. Catal., B, 2016, 199, 384–393 CrossRef.
- F. P. Perera, Environ. Health Perspect., 2017, 125, 141–148 Search PubMed.
- D. Mráček, P. Kočí, J.-S. Choi and W. P. Partridge, Appl. Catal., B, 2016, 182, 109–114 CrossRef.
- Z. Wang, J. Zhou, Y. Zhu, Z. Wen, J. Liu and K. Cen, Fuel Process. Technol., 2007, 88, 817–823 CrossRef CAS.
- F. Lin, Z. Wang, Q. Ma, Y. He, R. Whiddon, Y. Zhu and J. Liu, Energy Fuels, 2016, 30, 5101–5107 CrossRef CAS.
- H. Wu, L.-j. Yang, J.-p. Yan, G.-x. Hong and B. Yang, Fuel Process. Technol., 2016, 145, 116–122 CrossRef CAS.
- J. Z. Bloh, A. Folli and D. E. Macphee, RSC Adv., 2014, 4, 45726–45734 RSC.
- J. Deng, J. Liu, W. Song, Z. Zhao, L. Zhao, H. Zheng, A. C. Lee, Y. Chen and J. Liu, RSC Adv., 2017, 7, 7130–7139 RSC.
- F. Lin, Y. He, Z. Wang, Q. Ma, R. Whiddon, Y. Zhu and J. Liu, RSC Adv., 2016, 6, 31422–31430 RSC.
- Z. Wang, F. Lin, S. Jiang, K. Qiu, M. Kuang, R. Whiddon and K. Cen, Fuel, 2016, 166, 352–360 CrossRef CAS.
- L. Zhao, C. Li, S. Li, Y. Wang, J. Zhang, T. Wang and G. Zeng, Appl. Catal., B, 2016, 198, 420–430 CrossRef CAS.
- X. Zhang, Y. Cui, B. Tan, J. Wang, Z. Li and G. He, RSC Adv., 2016, 6, 88332–88339 RSC.
- A. Bueno-López, D. Lozano-Castelló, A. J. McCue and J. A. Anderson, Appl. Catal., B, 2016, 198, 266–275 CrossRef.
- Z. Zhang, Z. Jiang and W. Shangguan, Catal. Today, 2016, 264, 270–278 CrossRef CAS.
- S. Zhao, K. Li, S. Jiang and J. Li, Appl. Catal., B, 2016, 181, 236–248 CrossRef CAS.
- M. Casapu, O. Kröcher and M. Elsener, Appl. Catal., B, 2009, 88, 413–419 CrossRef CAS.
- W. Hu, Y. Zhang, S. Liu, C. Zheng, X. Gao, I. Nova and E. Tronconi, Appl. Catal., B, 2017, 206, 449–460 CrossRef CAS.
- D. Fang, J. Xie, D. Mei, Y. Zhang, F. He, X. Liu and Y. Li, RSC Adv., 2014, 4, 25540–25551 RSC.
- S. Dahlin, M. Nilsson, D. Bäckström, S. L. Bergman, E. Bengtsson, S. L. Bernasek and L. J. Pettersson, Appl. Catal., B, 2016, 183, 377–385 CrossRef CAS.
- I. Jogi, E. Stamate, C. Irimiea, M. Schmidt, R. Brandenburg, M. Holub, M. Bonislawski, T. Jakubowski, M. L. Kaariainen and D. C. Cameron, Fuel, 2015, 144, 137–144 CrossRef CAS.
- K. Skalska, J. S. Miller and S. Ledakowicz, Chem. Eng. Sci., 2011, 66, 3386–3391 CrossRef CAS.
- Y. Yu, L. Zhong, J. Ding, W. Cai and Q. Zhong, RSC Adv., 2015, 5, 23193–23201 RSC.
- Q. Ma, Z. Wang, F. Lin, M. Kuang, R. Whiddon, Y. He and J. Liu, Energy Fuels, 2016, 30, 2302–2308 CrossRef CAS.
- D. Jin, Z. Ren, Z. Ma and H. Yang, RSC Adv., 2015, 5, 15103–15109 RSC.
- W. Zhao, Q. Zhong, J. Ding, Z. Deng, L. Guo and F. Song, RSC Adv., 2016, 6, 115213–115221 RSC.
- D. Yuan, Z. Wang, C. Ding, Y. He, R. Whiddon and K. Cen, J. Phys. D: Appl. Phys., 2016, 49, 455203 CrossRef.
- F. Lin, Z. Wang, Q. Ma, Y. Yang, R. Whiddon, Y. Zhu and K. Cen, Appl. Catal., B, 2016, 198, 100–111 CrossRef CAS.
- J. Ma, C. Wang and H. He, Appl. Catal., B, 2017, 201, 503–510 CrossRef CAS.
- C. Wang, J. Ma, F. Liu, H. He and R. Zhang, J. Phys. Chem. C, 2015, 119, 23119–23126 CAS.
- E. Rezaei, J. Soltan and N. Chen, Appl. Catal., B, 2013, 136, 239–247 CrossRef.
- G. Zhu, J. Zhu, W. Jiang, Z. Zhang, J. Wang, Y. Zhu and Q. Zhang, Appl. Catal., B, 2017, 209, 729–737 CrossRef CAS.
- L. Zhang, J. Tu, L. Lyu and C. Hu, Appl. Catal., B, 2016, 181, 561–569 CrossRef CAS.
- D. Delimaris and T. Ioannides, Appl. Catal., B, 2008, 84, 303–312 CrossRef CAS.
- V. Santos, M. Pereira, J. Órfão and J. Figueiredo, Appl. Catal., B, 2010, 99, 353–363 CrossRef CAS.
- L. Zhong, Q. Zhong, W. Cai, S. Zhang, Y. Yu, M. Ou and F. Song, RSC Adv., 2016, 6, 21056–21066 RSC.
- J. Liu, Z. Zhao, J. Wang, C. Xu, A. Duan, G. Jiang and Q. Yang, Appl. Catal., B, 2008, 84, 185–195 CrossRef CAS.
- M. Y. Smirnov, A. V. Kalinkin, A. V. Pashis, A. M. Sorokin, A. S. Noskov, K. C. Kharas and V. I. Bukhtiyarov, J. Phys. Chem. B, 2005, 109, 11712–11719 CrossRef CAS PubMed.
- W. Xingyi, K. Qian and L. Dao, Appl. Catal., B, 2009, 86, 166–175 CrossRef.
- R. Tholkappiyan and K. Vishista, Appl. Surf. Sci., 2015, 351, 1016–1024 CrossRef CAS.
- S. Kameoka, Y. Ukisu and T. Miyadera, Phys. Chem. Chem. Phys., 2000, 2, 367–372 RSC.
- X. Zhang, H. He, H. Gao and Y. Yu, Spectrochim. Acta, Part A, 2008, 71, 1446–1451 CrossRef PubMed.
- D. Meng, W. Zhan, Y. Guo, Y. Guo, L. Wang and G. Lu, ACS Catal., 2015, 5, 5973–5983 CrossRef CAS.
- M. Machida, M. Uto, D. Kurogi and T. Kijima, Chem. Mater., 2000, 12, 3158–3164 CrossRef CAS.
- M. P. Ruggeri, I. Nova, E. Tronconi, J. A. Pihl, T. J. Toops and W. P. Partridge, Appl. Catal., B, 2015, 166, 181–192 CrossRef.
- J. A. Poston, R. V. Siriwardane, E. P. Fisher and A. L. Miltz, Appl. Surf. Sci., 2003, 214, 83–102 CrossRef CAS.
- R. C. Weast, CRC Handbook of Chemistry and Physics, CRC Press, Inc, 55th edn, 1974–1975, p. E58 Search PubMed.
- R. M. Ferrizz, R. J. Gorte and J. M. Vohs, Catal. Lett., 2002, 82, 123–129 CrossRef CAS.
- V. Petkova and Y. Pelovski, J. Therm. Anal. Calorim., 2008, 93, 847–852 CrossRef CAS.
- J. Kugai, E. B. Fox and C. Song, Appl. Catal., A, 2013, 456, 204–214 CrossRef CAS.
- S. Kameoka, Y. Ukisu and T. Miyadera, Phys. Chem. Chem. Phys., 2000, 2, 367–372 RSC.
- W. Wang, G. McCool, N. Kapur, G. Yuan, B. Shan, M. Nguyen, U. M. Graham, B. H. Davis, G. Jacobs and K. Cho, Science, 2012, 337, 832–835 CrossRef CAS PubMed.
- Q. Li, M. Meng, Z.-Q. Zou, X.-G. Li and Y.-Q. Zha, J. Hazard. Mater., 2009, 161, 366–372 CrossRef CAS PubMed.
| This journal is © The Royal Society of Chemistry 2017 |

