 Open Access Article
Creative Commons Attribution 3.0 Unported Licence
Nonlinear electrical characteristics of core-satellite CaCu3Ti4O12@ZnO doped silicone rubber composites
Jun Wangac,
Xilin Wang *b,
Youwei Yaoc,
Juyi Guob,
Xiaogang Ouyang
 b and
Zhidong Jiab
aSchool of Materials Science and Engineering, Tsinghua University, Beijing 100084, P. R. China
bEngineering Laboratory of Power Equipment Reliability in Complicated Coastal Environment, Graduate School at Shenzhen, Tsinghua University, Shenzhen 518055, P. R. China. E-mail: wang.xilin@sz.tsinghua.edu.cn
cAdvanced Materials Institute, Graduate School at Shenzhen, Tsinghua University, Shenzhen 518055, P. R. China
First published on 19th June 2017
Abstract
The application of polymer composites with electric field dependent nonlinear conductive and dielectric characteristics for high voltage equipment is an effective method to control electric field stress and disperse space charges. In this study, core-satellite CaCu3Ti4O12@ZnO fillers were synthesized and doped into silicone rubber composites, and compared to a mixture of CaCu3Ti4O12 and ZnO with the same filler concentration. The composites exhibited both nonlinear conductive and nonlinear dielectric properties with nanoparticle fillers for the first time. Both the nonlinear conductive coefficient and dielectric coefficient increased with filler concentration. The classical current-path model was utilized to explain the nonlinear conductive properties, while the interface-barrier-layer-capacitor model and double-depletion-layer model were introduced to explain the nonlinear dielectric properties, which would broaden the thinking for the fabrication of nonlinear composites.
1. Introduction
A safe insulation property is one of the key characteristics in electric power systems. The higher the voltage is, the better the insulation needs to be. The transmission line voltage is increased to 1100 kV in China now. Unexpected local enhancements of electric field on high voltage devices often appear in a complex electric environment, which would threaten the safety and stability of the power system. Besides designs of the insulation structure, the use of field grading materials with nonlinear conductive or dielectric properties is an effective approach to solving these problems,1,2 for the functional electrical parameters of such composites would adapt with the electric field automatically.Fillers with outstanding nonlinear properties such as conductivity are often doped into composites to obtain nonlinearity, which has been widely researched. For nonlinear conductive property, fillers such as ZnO, SiC, silica and carbon black have been studied for decades and they aid in electric field grading.2 For nonlinear dielectric property, many efforts have been made to employ inorganic non-metallic materials with high dielectric permittivity as functional fillers such as barium titanate, lead zirconate titanate and so on.3–7 Although the dielectric permittivity of these composites varies with the electric field, the nonlinear dielectric coefficient is relatively poor, which is not very satisfactory and makes them less attractive.
Zinc oxide (ZnO) is famous for its excellent nonlinear conductive properties and has been widely used to protect electrical devices against overvoltage in power systems.8,9 The typical application is as a zinc oxide arrester. Recently, ZnO microparticles were fabricated and employed as fillers, and the composites exhibited both nonlinear conductive and dielectric properties.10 However, the high volume fraction of microparticles in the silicone rubber composites may lead to the degradation of other performances, which needs to be improved.
Copper calcium titanate (CaCu3Ti4O12) is a perovskite-like tetragonal oxide with a very large dielectric constant.11–13 With its high permittivity, it has been reported that CaCu3Ti4O12 has remarkably strong nonlinear conductive characteristics for an intrinsic electrostatic barrier at grain boundaries.14 The nonlinear coefficient of CaCu3Ti4O12 is even greater than that of ZnO.15 It therefore has the potential to be used in field grading materials. However, there has been no study to make use of the nonlinear behavior of both ZnO and CaCu3Ti4O12 in previous literature.
In this paper, ZnO and CaCu3Ti4O12 nanoparticles were employed as fillers to tailor both the conductive and dielectric properties of composites. Considering Tanaka has built a multi-core model to explain the excellent electrical properties of nanocomposites,16,17 core-satellite CaCu3Ti4O12@ZnO nanoparticles were synthesized and doped into silicone rubber composites. The composites exhibited both nonlinear conductive and nonlinear dielectric properties with nanoparticle fillers for the first time, which would broaden the application of nonlinear composites.
2. Experimental
2.1 Materials
Copper calcium titanate (CaCu3Ti4O12, grain size ≈ 500 nm) was purchased from Shanghai Dianyang Industry Corp. and zinc oxide (ZnO, grain size ≈ 50 nm) was purchased from Nanjing Yaonano Corp. Zinc acetate (Zn(Ac)2), sodium hydroxide (NaOH) and silane coupling agent KH-151 were obtained from Aladdin Reagent. 110 methyl vinyl silicone rubber (molecular weight 600![[thin space (1/6-em)]](https://www.rsc.org/images/entities/char_2009.gif) 000, vinyl mass fraction 0.03%) and its vulcanizing agent were brought from Zhejiang Wynca Chemical Industrial Group Corp. Muscovite (IMERYS, US), aluminium hydroxide (AH-1, Aluminum Corporation of China Limited) and fumed silica (HL-200, Guangzhou GBS) were also used in this work.
000, vinyl mass fraction 0.03%) and its vulcanizing agent were brought from Zhejiang Wynca Chemical Industrial Group Corp. Muscovite (IMERYS, US), aluminium hydroxide (AH-1, Aluminum Corporation of China Limited) and fumed silica (HL-200, Guangzhou GBS) were also used in this work.
2.2 Synthesis of core-satellite CaCu3Ti4O12@ZnO
Zn(Ac)2, NaOH and CaCu3Ti4O12 nanoparticles were used for the synthesis of core-satellite CaCu3Ti4O12@ZnO nanomaterials. The typical reaction between Zn(Ac)2 and NaOH was employed to make a ZnO coating on the CaCu3Ti4O12 nanoparticles.18–21 In this work, 1.468 g (0.008 mol) Zn(Ac)2 and 1.228 g CaCu3Ti4O12 nanoparticles were dissolved in 800 mL of deionized water with constant stirring for 30 min at 800 rpm. Then 800 mL of 0.1 M NaOH aqueous solution was added dropwise and the resulting solution was kept stirring for 5 hours to get a good dispersion. To form ZnO grains on the surface of the dispersed CaCu3Ti4O12 nanoparticles, the solution was finally refluxed at 100 °C for 5 hours. After cooling down to room temperature, the product was filtered with a 0.22 μm membrane and washed with deionized water twice and then vacuum dried to afford core-satellite CaCu3Ti4O12@ZnO nanofillers.2.3 Preparation of silicone rubber composites
Fillers (CaCu3Ti4O12, ZnO and CaCu3Ti4O12@ZnO) should be processed by silane coupling agent KH-151 to get a better dispersion in the silicone rubber. 110 methyl vinyl silicone rubber and vulcanizing agent were mixed in an open mill for 30 min. According to the composition of insulated silicone rubber, 5 wt% muscovite was added into the rubber for easy demould; meanwhile 50 wt% fumed silica and 30 wt% aluminium hydroxide were added for strength and flame retardancy. Then the pre-processed fillers were evenly added into the silicone rubber and milled for 2 hours. The filler mass fraction ranged from 20 wt% to 60 wt% as shown in Table 1. Finally, the composites were pressed with a vulcanizing machine in the mould at 15 MPa and 175 °C for 10 min, and then cooled down to room temperature. The fillers (CaCu3Ti4O12, ZnO and CaCu3Ti4O12@ZnO)-doped silicone rubber composite samples were about 200 μm in thickness and 30 mm in diameter.| Designation | ZnO | CaCu3Ti4O12 | CaCu3Ti4O12@ZnO |
|---|---|---|---|
| N | — | — | — |
| 20Z | 20.0 | — | — |
| 30Z | 30.0 | — | — |
| 40Z | 40.0 | — | — |
| 50Z | 50.0 | — | — |
| 20C | — | 20.0 | — |
| 30C | — | 30.0 | — |
| 40C | — | 40.0 | — |
| 50C | — | 50.0 | — |
| 20M | 6.7 | 13.3 | — |
| 30M | 10.0 | 20.0 | — |
| 40M | 13.3 | 27.7 | — |
| 50M | 16.7 | 33.3 | — |
| 60M | 20.0 | 40.0 | — |
| 20CS | — | — | 20.0 |
| 30CS | — | — | 30.0 |
| 40CS | — | — | 40.0 |
| 50CS | — | — | 50.0 |
| 60CS | — | — | 60.0 |
2.4 Characterization
X-ray diffraction (XRD) measurements were carried out using a X-ray diffractometer (Rigaku, D/max 2500 PC) with Cu Kα radiation (λ = 1.5406 Å). 40 kV and 200 mA were applied. The continuous scan speed was 5° min−1. The morphology of the fillers was examined by field emission scanning electron microscopy (SEM, ZEISS SUPRAR 55) and field emission transmission electron microscopy (TEM, FEI Tecnai G2 F30, 300 kV). The elemental analysis of CaCu3Ti4O12@ZnO fillers was carried out by energy dispersive X-ray spectrometry (EDS, Oxford X-Max 20). The thermal stability of the composites was examined by thermogravimetric analysis (TGA, Mettler-Toledo TGA/DSC 1, STARe System) with a heating rate of 10 °C min−1 from 50 to 800 °C under nitrogen flow (50 mL min−1). The surface analysis of the fillers and samples was performed by X-ray photoelectron spectrometry (XPS, ESCALAB 250Xi, Thermo Fisher, UK) using Ar ion beam etching for 50 s, which could show the bonding details. Focused monochromatized Al Kα radiation at a pass energy of 20 eV was applied. The energy scale was calibrated and corrected using the C 1s (284.6 eV) line as the binding energy reference. The nonlinear electrical characteristics of composites were analyzed by the low frequency module (Alpha-A High Performance Frequency Analyzer) of a broadband dielectric analyzer (Concept 80, Novocontrol GmbH, Germany), and samples were sandwiched between two 20 mm gold plated electrodes tested with active sample cell. With a frequency of 50 Hz, the test voltage ranged from 0 V to 1400 V. All the measurements were obtained at room temperature.3. Results and discussion
3.1 XRD measurements
The diffraction patterns of ZnO, CaCu3Ti4O12 and CaCu3Ti4O12@ZnO nanoparticles are shown in Fig. 1(a). The peak positions of the XRD patterns fitted well with reported values of ZnO phase (JCPDS PDF#80-0074) and CaCu3Ti4O12 phase (JCPDS PDF#75-2188), which indicated that ZnO here was wurtzite and CaCu3Ti4O12 perovskite-like. The XRD results revealed that the “core” and “satellite” of the synthesized core-satellite CaCu3Ti4O12@ZnO nanoparticles had the same crystal structure as CaCu3Ti4O12 and ZnO fillers respectively. The diffraction patterns of N, 50Z, 50C, 60M and 60CS samples are shown in Fig. 1(b). Compared with N sample, 50Z displayed the peak positions of ZnO phase, and 50C displayed those of CaCu3Ti4O12 phase. Meanwhile, 60M and 60CS showed the same peak positions of ZnO phase and CaCu3Ti4O12 phase. It is confirmed that the ZnO and CaCu3Ti4O12 doped silicone rubber composites could be the reference groups of the CaCu3Ti4O12@ZnO doped silicone rubber composites which were the focus of this work.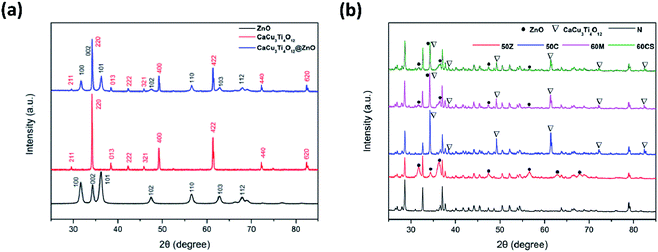 | ||
| Fig. 1 XRD patterns of fillers and samples. (a) ZnO, CaCu3Ti4O12 and CaCu3Ti4O12@ZnO nanoparticles. (b) N, 50Z, 50C, 60M and 60CS samples. | ||
3.2 Electron microscopy and EDS analysis
Fig. 2(a–c) shows SEM micrographs of ZnO, CaCu3Ti4O12 and core-satellite CaCu3Ti4O12@ZnO fillers respectively. The ZnO grains possessed typical features of wurtzite structure. The average grain size was about 50 nm. The CaCu3Ti4O12 grains were tetragonal perovskite-like, and the average grain size was about 500 nm. As can be seen from Fig. 2(c), perovskite-like CaCu3Ti4O12 particles were surrounded by large numbers of ZnO nanoparticles, and the average particle size of ZnO was also about 50 nm. Either the crystalline phase or the particle size was the same as the pure phase ZnO and CaCu3Ti4O12 particles. Fig. 2(d) shows a TEM micrograph of the core-satellite CaCu3Ti4O12@ZnO particles. The ZnO nanoparticles adsorbed onto the surface of the bigger CaCu3Ti4O12 particles, which was consistent with the SEM result. Because of the high surface energy of nanoparticles, agglomeration occurred easily, which indicated that the pre-processing of the fillers was an important procedure to get better dispersion in the silicone rubber composites.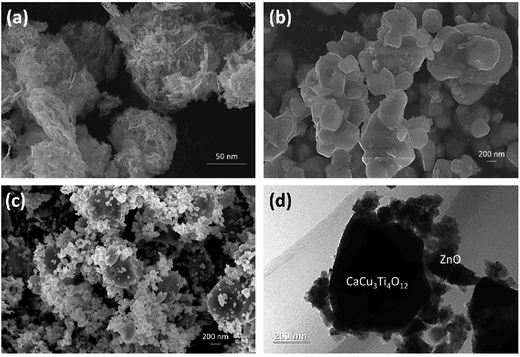 | ||
| Fig. 2 SEM micrographs of (a) ZnO, (b) CaCu3Ti4O12 and (c) core-satellite CaCu3Ti4O12@ZnO fillers. (d) TEM micrograph of a core-satellite CaCu3Ti4O12@ZnO particle. | ||
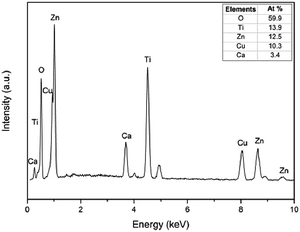
The EDS analysis of the core-satellite CaCu3Ti4O12@ZnO is shown in Fig. 3. The atomic ratio was found to be Zn![[thin space (1/6-em)]](https://www.rsc.org/images/entities/char_2009.gif) :
:![[thin space (1/6-em)]](https://www.rsc.org/images/entities/char_2009.gif) Cu
Cu![[thin space (1/6-em)]](https://www.rsc.org/images/entities/char_2009.gif) :
:![[thin space (1/6-em)]](https://www.rsc.org/images/entities/char_2009.gif) Ca
Ca![[thin space (1/6-em)]](https://www.rsc.org/images/entities/char_2009.gif) :
:![[thin space (1/6-em)]](https://www.rsc.org/images/entities/char_2009.gif) Ti = 12.5
Ti = 12.5![[thin space (1/6-em)]](https://www.rsc.org/images/entities/char_2009.gif) :
:![[thin space (1/6-em)]](https://www.rsc.org/images/entities/char_2009.gif) 10.3
10.3![[thin space (1/6-em)]](https://www.rsc.org/images/entities/char_2009.gif) :
:![[thin space (1/6-em)]](https://www.rsc.org/images/entities/char_2009.gif) 3.4
3.4![[thin space (1/6-em)]](https://www.rsc.org/images/entities/char_2009.gif) :
:![[thin space (1/6-em)]](https://www.rsc.org/images/entities/char_2009.gif) 13.9. The mass ratio between CaCu3Ti4O12 core and ZnO satellite could be calculated to be 2
13.9. The mass ratio between CaCu3Ti4O12 core and ZnO satellite could be calculated to be 2![[thin space (1/6-em)]](https://www.rsc.org/images/entities/char_2009.gif) :
:![[thin space (1/6-em)]](https://www.rsc.org/images/entities/char_2009.gif) 1. This was why the mass ratio between CaCu3Ti4O12 and ZnO fillers in 20M, 30M, 40M and 50M was 2
1. This was why the mass ratio between CaCu3Ti4O12 and ZnO fillers in 20M, 30M, 40M and 50M was 2![[thin space (1/6-em)]](https://www.rsc.org/images/entities/char_2009.gif) :
:![[thin space (1/6-em)]](https://www.rsc.org/images/entities/char_2009.gif) 1, which were prepared to be the reference groups.
1, which were prepared to be the reference groups.
3.3 Thermal behavior of the composites
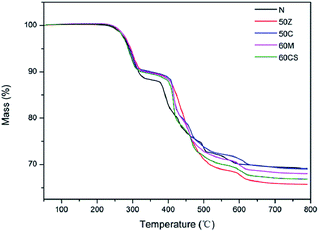
The thermal behavior of the silicone rubber composites at a constant heating rate of 10 °C min−1 was investigated. The TGA curves of N, 50Z, 50C, 60M and 60CS samples are given in Fig. 4. There was almost no weight loss below 250 °C, which indicated that the silicone rubber composites had good thermal stability in this temperature range. When the temperature was higher than 250 °C, there were two typical weight loss stages.22 The first stage appeared at about 250 to 300 °C with a weight loss of about 10%, which was attributed to the decomposition of aluminium hydroxide (Al(OH)3) in the composites. The second weight loss stage appeared at about 400 to 600 °C. In this stage, the polysiloxane chains began to break, such as the chemical bonds Si–O and Si–C, which resulted in a weight loss of about 20%. Therefore when the application temperature was lower than 250 °C, the composites exhibited excellent thermal stability.3.4 XPS analysis
XPS was used to characterize the bonding of core-satellite CaCu3Ti4O12@ZnO fillers. Since CaCu3Ti4O12 particles were surrounded by small ZnO grains on the outside, Zn 2p was chosen to be the detected species. Fig. 5(a) shows the XPS analysis of the fillers. The Zn 2p peaks of “CaCu3Ti4O12 + ZnO” fillers are located at 1021.99 eV and 1044.99 eV, and those of CaCu3Ti4O12@ZnO fillers at 1021.80 eV and 1044.80 eV. With the peak shift of 0.19 eV, the binding energy of Zn 2p in CaCu3Ti4O12@ZnO decreased, which indicated that there was chemical bonding between the CaCu3Ti4O12 core and ZnO satellites. Fig. 5(b) shows the XPS analysis of 60M and 60CS samples which were doped with “CaCu3Ti4O12 + ZnO” and CaCu3Ti4O12@ZnO fillers respectively. The Zn 2p peaks of 60M samples presented at 1022.68 eV and 1045.68 eV, and those of 60CS presented at 1022.52 eV and 1045.52 eV. The peak shift was 0.16 eV. It is confirmed that there was still bonding between CaCu3Ti4O12 and ZnO grains after CaCu3Ti4O12@ZnO fillers were doped into the silicone rubber. The XRD pattern of 60M had shown the presence of CaCu3Ti4O12 and ZnO phases, which showed that CaCu3Ti4O12@ZnO fillers still retained the core-satellite structure in the matrix.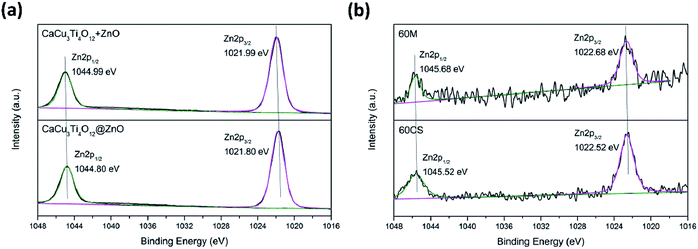 | ||
| Fig. 5 XPS (Zn 2p) analysis of fillers and samples. (a) CaCu3Ti4O12 + ZnO and CaCu3Ti4O12@ZnO; (b) 6OM and 60CS samples. | ||
3.5 Nonlinear conductive characteristics
The J–E characteristics of ZnO/silicone rubber composites with filler content from 20 wt% to 50 wt% are shown in Fig. 6(a). A typical way to evaluate the nonlinear conductive properties of the composites is to compare the nonlinear conductive coefficient αj,10,23 which can be calculated by eqn (1):
 | (1) |
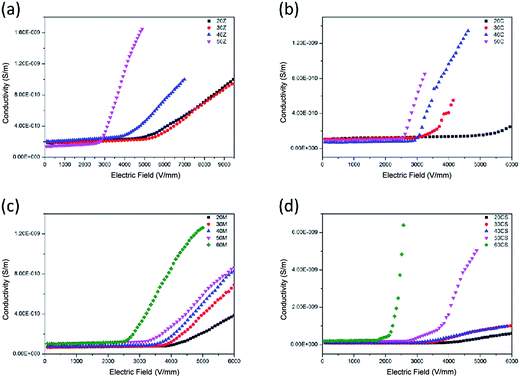 | ||
| Fig. 6 The J–E characteristics of silicone rubber composites doped with (a) ZnO, (b) CaCu3Ti4O12, (c) mixture of CaCu3Ti4O12 and ZnO and (d) core-satellite CaCu3Ti4O12@ZnO fillers. | ||
Percolation theory is often introduced in the process of explaining the conduction mechanism of conductive composites.25,26 As shown in Fig. 7(a and b), when the filler concentration is higher than the percolation threshold, particles in the matrix would contact, which would form current paths. For ZnO or CaCu3Ti4O12 n-type semiconducting grains, Schottky barriers were created at the interfaces in many cases.27 Therefore, J–E would follow the relationship of eqn (2):28–33
 | (2) |
If the concentration of fillers is relatively high, more current paths would come into being. The current may transport via the shortest path, which leads to lower switching field and larger nonlinear conductive coefficient. It has been reported that CaCu3Ti4O12 has remarkably strong nonlinear characteristics and the nonlinear coefficient of CaCu3Ti4O12 is even greater than that of ZnO.14 The nonlinear conductive properties of both ZnO and CaCu3Ti4O12 nanoparticle-doped silicone rubber composites could be explained by this schematic diagram.
Fig. 6(c) shows the J–E characteristics of composites doped by a mixture of CaCu3Ti4O12 and ZnO (mass ratio = 2![[thin space (1/6-em)]](https://www.rsc.org/images/entities/char_2009.gif) :
:![[thin space (1/6-em)]](https://www.rsc.org/images/entities/char_2009.gif) 1) from 20 wt% to 60 wt%. The nonlinear conductive coefficient αj was 2.72, 3.25, 3.62, 4.03, 4.31, respectively. Fig. 6(d) shows the J–E characteristics of CaCu3Ti4O12@ZnO/silicone rubber composites with filler content from 20 wt% to 60 wt%. The nonlinear conductive coefficient αj was 3.46, 3.95, 4.00, 6.91, 10.87, respectively, which was larger than that of mixed particle-doped silicone rubber composites. The mixture of ZnO and CaCu3Ti4O12 particles were dispersed in the matrix (Fig. 7(c)), so that it was very hard to form a current path unless the concentration of fillers was high enough. The particle size of the core-satellite CaCu3Ti4O12@ZnO was larger than either ZnO or CaCu3Ti4O12, for which the particles contacted easily. The ZnO nanoparticles adsorbed onto the surface of CaCu3Ti4O12 could form a 3D structure for the current paths. And even ZnO–CaCu3Ti4O12 contact could form a path too (Fig. 7(d)). The current transport could choose more and shorter paths, leading to lower switching field and larger nonlinear conductive coefficient.
1) from 20 wt% to 60 wt%. The nonlinear conductive coefficient αj was 2.72, 3.25, 3.62, 4.03, 4.31, respectively. Fig. 6(d) shows the J–E characteristics of CaCu3Ti4O12@ZnO/silicone rubber composites with filler content from 20 wt% to 60 wt%. The nonlinear conductive coefficient αj was 3.46, 3.95, 4.00, 6.91, 10.87, respectively, which was larger than that of mixed particle-doped silicone rubber composites. The mixture of ZnO and CaCu3Ti4O12 particles were dispersed in the matrix (Fig. 7(c)), so that it was very hard to form a current path unless the concentration of fillers was high enough. The particle size of the core-satellite CaCu3Ti4O12@ZnO was larger than either ZnO or CaCu3Ti4O12, for which the particles contacted easily. The ZnO nanoparticles adsorbed onto the surface of CaCu3Ti4O12 could form a 3D structure for the current paths. And even ZnO–CaCu3Ti4O12 contact could form a path too (Fig. 7(d)). The current transport could choose more and shorter paths, leading to lower switching field and larger nonlinear conductive coefficient.
3.6 Nonlinear dielectric characteristics
Similar to the nonlinear conductive coefficient, the nonlinear dielectric coefficient αε of composites can be calculated by eqn (3):10
 | (3) |
The ε–E characteristics of ZnO/silicone rubber composites with filler content from 20 wt% to 50 wt% are shown in Fig. 8(a). As can be seen, the permittivity of the composites increased with filler concentration. Within low electric field, the permittivity of ZnO/silicone rubber composite with 50 wt% filler content reached 5.5. The nonlinear dielectric coefficient αε of ZnO/silicone rubber composites also got larger with filler concentration. The ZnO/silicone rubber composite with 50 wt% filler content exhibited an αε of 0.35. Fig. 8(b) shows the ε–E characteristics of CaCu3Ti4O12/silicone rubber composites with filler content from 20 wt% to 50 wt%. The permittivity of the composites increased with filler concentration too. With the same filler concentration, the permittivity of CaCu3Ti4O12/silicone rubber composites was slightly larger than that of ZnO/silicone rubber composites, since the permittivity of CaCu3Ti4O12 particles was larger than that of ZnO particles. Composites with 20 wt% CaCu3Ti4O12 fillers failed to exhibit stable nonlinear dielectric behaviors. With larger filler concentration, the composites showed an αε of 0.29, 0.44 and 1.02 with 30 wt%, 40 wt% and 50 wt% filler concentration, respectively. Fig. 8(c) shows the ε–E characteristics of composites doped with a mixture of CaCu3Ti4O12 and ZnO (mass ratio = 2![[thin space (1/6-em)]](https://www.rsc.org/images/entities/char_2009.gif) :
:![[thin space (1/6-em)]](https://www.rsc.org/images/entities/char_2009.gif) 1) from 20 wt% to 60 wt%. It is obvious that the composites showed little nonlinearity. The largest nonlinear dielectric coefficient αε was 0.26. Fig. 8(c) is in sharp contrast to Fig. 8(d) which shows the ε–E characteristics of CaCu3Ti4O12@ZnO/silicone rubber composites with filler content from 20 wt% to 60 wt%. The composites showed stable nonlinear dielectric properties with 50% wt% and 60 wt% filler concentration whose αε was 1.30 and 2.33, respectively. Comparing Fig. 8(a–d), the composites doped with a mixture of CaCu3Ti4O12 and ZnO showed worse nonlinearity than either ZnO or CaCu3Ti4O12 doped composites. However, the CaCu3Ti4O12@ZnO/silicone rubber composites showed not only the highest permittivity within low electric field but also the best nonlinearity. It is evident that the core-satellite structure played the key role in the nonlinear dielectric properties of the composites.
1) from 20 wt% to 60 wt%. It is obvious that the composites showed little nonlinearity. The largest nonlinear dielectric coefficient αε was 0.26. Fig. 8(c) is in sharp contrast to Fig. 8(d) which shows the ε–E characteristics of CaCu3Ti4O12@ZnO/silicone rubber composites with filler content from 20 wt% to 60 wt%. The composites showed stable nonlinear dielectric properties with 50% wt% and 60 wt% filler concentration whose αε was 1.30 and 2.33, respectively. Comparing Fig. 8(a–d), the composites doped with a mixture of CaCu3Ti4O12 and ZnO showed worse nonlinearity than either ZnO or CaCu3Ti4O12 doped composites. However, the CaCu3Ti4O12@ZnO/silicone rubber composites showed not only the highest permittivity within low electric field but also the best nonlinearity. It is evident that the core-satellite structure played the key role in the nonlinear dielectric properties of the composites.
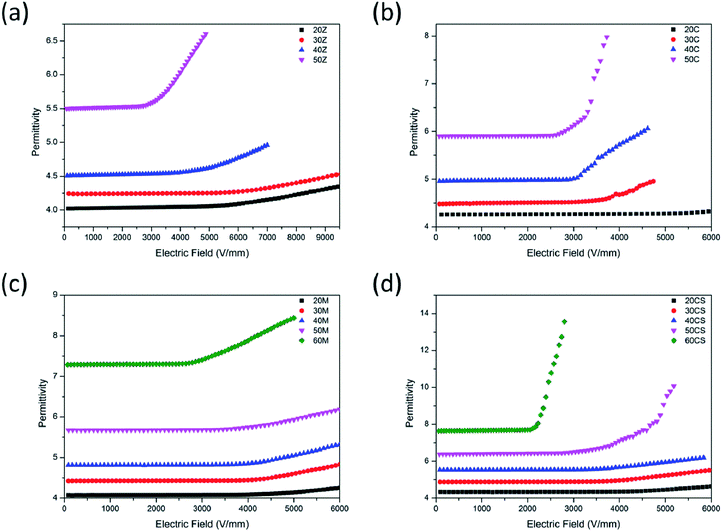 | ||
| Fig. 8 The ε–E characteristics of silicone rubber composites doped with (a) ZnO, (b) CaCu3Ti4O12, (c) mixture of CaCu3Ti4O12 and ZnO and (d) core-satellite CaCu3Ti4O12@ZnO fillers. | ||
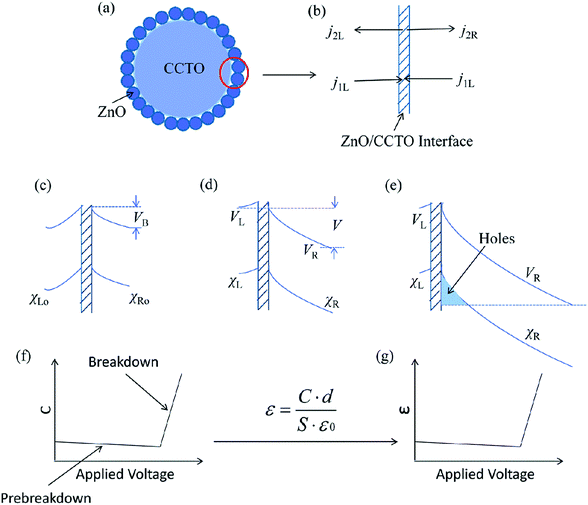
Fig. 9(a) shows the structure of a core-satellite CaCu3Ti4O12@ZnO particle. XPS analysis had indicated that there was bonding between core and satellite, so the interfaces could serve as internal capacitors between ZnO and CaCu3Ti4O12 grains.10,12,13,34 The double-depletion-layer model is introduced at first, which appears to be generally accepted. Fig. 9(c) shows the double-depletion-layer model at zero applied voltage. There was a depletion region in both ZnO semiconductor side and CaCu3Ti4O12 semiconductor side,14 of width χLo and χRo on the left and right side. And the barrier height was VB. Fig. 9(d) shows the application of a positive voltage V on the region. On the right side, the conduction band was lowered and the depletion region was widened, so that VR and χR increased. To explain the nonlinearity of the composites, we separated it into two parts, the prebreakdown region and breakdown region, which were in the low voltage region and the high voltage region, respectively.
In the prebreakdown region, the two-step model was introduced for charge transport.34 It was assumed that an electron transferred from the grain to the interface, and then on to the other grain, which were separate steps in charge transport. The four transport current flows are defined in Fig. 9(b). The junction capacitance C in this model could be calculated by eqn (4):34
 | (4) |
In the breakdown region, when the applied voltage increased much above the breakdown voltage, the conduction band would drop below the top of the valance band on the same side of the junction. Holes came into being, causing thinning of the potential barrier to electrons tunneling from the interface, as can be seen in Fig. 9(e). By evaluating the total energy ξ and its second derivative with respect to V, the capacitance could be calculated by eqn (5) and (6):34
 | (5) |
 | (6) |
In the breakdown region, the calculated result is shown in Fig. 9(f) in which the capacitance then rises quite steeply. In other words, with holes coming into being, the charge became large, but the distance between the holes and the electrons in the interface was smaller, which resulted in the steep rise of the capacitance.
Combining the prebreakdown region and the breakdown region, the capacitance exhibited nonlinearity with applied voltage. The permittivity was positive relative to the capacitance, which was expressed by eqn (7):
 | (7) |
4. Conclusions
By doping the synthesized core-satellite CaCu3Ti4O12@ZnO into silicone rubber, composites with both nonlinear conductive and nonlinear dielectric characteristics were fabricated using nanoparticle fillers for the first time. The XPS and XRD results showed that there was bonding between ZnO and CaCu3Ti4O12, which restrained the core-satellite structure tightly. The nonlinear conductive coefficient αj of CaCu3Ti4O12@ZnO/silicone rubber composites with a filler concentration 60 wt% was 10.87, and the nonlinear dielectric coefficient αε was 2.33. Both the nonlinear conductive coefficient and dielectric coefficient increased with filler concentration. The classical current-path model was utilized to explain the nonlinear conductive properties, while the interface-barrier-layer-capacitor model and double-depletion-layer model were introduced to explain the nonlinear dielectric properties, which would broaden the thinking for the fabrication of nonlinear composites.Acknowledgements
This work was supported by the National Natural Science Foundation of China Funds (51607101), in part by the Fundamental Research Foundation of Shenzhen Funds in 2015 (JCYJ20150331151358154), and in part by Collaborative innovation Special Fund of Guangzhou (201604046014). The authors are also grateful for the financial support from the Science and Technology Project of State Grid Corporation of China (no. 2015GW-25, Study on the Influence and Countermeasures of External Insulation Reliability of Power Transmission and Transformation Equipment of Algae Plant Grow on the Surface of Composite Insulation Materials in Warm and Humid Environment).References
- T. Christen, L. Donzel and F. Greuter, IEEE Electr. Insul. Mag., 2010, 6, 47–59 CrossRef.
- L. Donzel, F. Greuter and T. Christen, IEEE Electr. Insul. Mag., 2011, 2, 18–29 CrossRef.
- J. Robertson and B. R. Varlow, Properties and Applications of Dielectric Materials, Proceedings of the 7th International Conference on IEEE, 2003, vol. 2, pp. 761–764 Search PubMed.
- B. R. Varlow and K. Li, IEE Proc.-A: Sci., Meas. Technol., 2003, 150, 75–82 CrossRef CAS.
- E. A. Cherney, IEEE Electr. Insul. Mag., 2013, 29, 59–65 CrossRef.
- M. Paredes-Olguin, C. Gomez-Yañez, F. P. Espino-Cortes and E. Ramirez, IEEE Trans. Dielectr. Electr. Insul., 2013, 20, 2335–2342 CrossRef CAS.
- J. Glenneberg, M. Zenkner, G. Wagner, S. Lemm, C. Ehrhardt, W. Münchgesang, A. Buchsteiner, M. Diestelhorst, H. Beige and S. Ebbinghaus, RSC Adv., 2014, 4, 61268–61276 RSC.
- K. Eda, IEEE Electr. Insul. Mag., 1989, 5, 28–30 CrossRef.
- T. K. Gupta, J. Am. Ceram. Soc., 1990, 73, 1817–1840 CrossRef CAS.
- L. Gao, X. Yang, J. Hu and J. He, Mater. Lett., 2016, 171, 1–4 CrossRef CAS.
- M. Subramanian, D. Li, N. Duan, B. Reisner and A. Sleight, J. Solid State Chem., 2000, 151, 323–325 CrossRef CAS.
- R. Schmidt, S. Pandey, P. Fiorenza and D. C. Sinclair, RSC Adv., 2013, 3, 14580–14589 RSC.
- L. Sun, R. Zhang, Z. Wang, E. Cao, Y. Zhang and L. Ju, RSC Adv., 2016, 6, 55984–55989 RSC.
- S.-Y. Chung, I.-D. Kim and S.-J. L. Kang, Nat. Mater., 2004, 3, 774–778 CrossRef CAS PubMed.
- D. R. Clarke, J. Am. Ceram. Soc., 1999, 82, 485–502 CrossRef CAS.
- T. Tanaka, IEEE Trans. Dielectr. Electr. Insul., 2005, 12, 914–928 CrossRef CAS.
- T. Tanaka, M. Kozako, N. Fuse and Y. Ohki, IEEE Trans. Dielectr. Electr. Insul., 2005, 12, 669–681 CrossRef CAS.
- X. L. Zhang, Y. H. Kim and Y. S. Kang, Solid State Phenomena, Trans Tech Publications, 2007, vol. 119, pp. 239–242 Search PubMed.
- S. Kanmani and K. Ramachandran, Renewable Energy, 2012, 43, 149–156 CrossRef CAS.
- D. Zhu, W. Li, L. Ma and Y. Lei, RSC Adv., 2014, 4, 9372–9378 RSC.
- Z. Wang, L. Wu, J. Zhou, B. Shen and Z. Jiang, RSC Adv., 2013, 3, 3309–3315 RSC.
- S. Béfahy, P. Lipnik, T. Pardoen, C. Nascimento, B. Patris, P. Bertrand and S. Yunus, Langmuir, 2009, 26, 3372–3375 CrossRef PubMed.
- X. Yang, J. He and J. Hu, J. Appl. Polym. Sci., 2015, 132, 40 Search PubMed.
- F. Wang, P. Zhang, M. Gao, X. Zhao and J. Gao, Electrical Insulation and Dielectric Phenomena (CEIDP), IEEE Conference on IEEE, 2013, pp. 435–538 Search PubMed.
- Y. Jiangao, L. Chengcen and S. Kai, Res. Chem. Intermed., 2006, 2, 13–17 Search PubMed.
- I. Balberg, D. Azulay, D. Toker and O. Millo, Int. J. Mod. Phys. B, 2004, 18, 2091–2121 CrossRef CAS.
- D. Capsoni, M. Bini, V. Massarotti, G. Chiodelli, M. C. Mozzatic and C. B. Azzoni, J. Solid State Chem., 2004, 177, 4494–4500 CrossRef CAS.
- K. Eda, J. Appl. Phys., 1978, 49, 2964–2972 CrossRef CAS.
- S. A. Pianaro, P. R. Bueno, P. Olivi, E. Longo and J. A. Varela, J. Mater. Sci. Lett., 1997, 16, 634–638 CrossRef CAS.
- G. Zang, J. Zhang, P. Zheng, J. Wang and C. Wang, J. Phys. D: Appl. Phys., 2005, 38, 1824 CrossRef CAS.
- J. Y. Wang, F. J. Wang, P. C. Li, C. H. Chen, B. W. Su and L. W. Zhong, Eur. Phys. J.: Appl. Phys., 2000, 11, 155–158 CrossRef.
- L. Liu, L. Fang, Y. Huang and Y. Li, J. Appl. Phys., 2011, 110, 094101–094106 CrossRef.
- L. Liu, Y. Huang, Y. Li, D. Shi, S. Zheng, S. Wu, L. Fang and C. Hu, J. Mater. Sci., 2012, 47, 2294–2299 CrossRef CAS.
- G. Mahan, L. M. Levinson and H. R. Philipp, J. Appl. Phys., 1979, 50, 2799–2812 CrossRef CAS.
| This journal is © The Royal Society of Chemistry 2017 |

