 Open Access Article
Creative Commons Attribution 3.0 Unported Licence
Synthesis and gas sensing properties of molybdenum oxide modified tungsten oxide microstructures for ppb-level hydrogen sulphide detection
Jie Hu *a,
Yongjiao Suna,
Xiu Wanga,
Lin Chen*b,
Wengdong Zhanga and
Yong Chenc
aMicro and Nano System Research Center, Key Lab of Advanced Transducers and Intelligent Control System (Ministry of Education), College of Information Engineering, Taiyuan University of Technology, Taiyuan 030024, Shanxi, China. E-mail: hujie@tyut.edu.cn
bResearch Center on Advanced Materials Science and Technology, Taiyuan University of Technology, Taiyuan 030024, Shanxi, China
cEcole Normale Supérieure-PSL Research University, Département de Chimie, Sorbonne Universités – UPMC Univ Paris 06, CNRS UMR 8640 PASTEUR, 24, rue Lhomond, 75005 Paris, France
First published on 30th May 2017
Abstract
Flower-like molybdenum oxide@tungsten oxide (MoO3@WO3) composite microstructures were successfully synthesized by hydrothermal and impregnation methods. The fabricated samples were characterized by XRD, EDS, SEM and TEM, and the results show that the MoO3@WO3 composite is composed of crystallized nanosheets with a thickness of about 40 nm. The gas sensing properties of the MoO3@WO3 composite microstructures towards hydrogen sulfide (H2S) were investigated as a function of operating temperature and gas concentration. The gas sensors based on MoO3@WO3 composites show better sensing performances than that of a pure one. Moreover, the Mo6W-based gas sensor exhibits the highest response (28.5 towards 10 ppm H2S), fast response/recovery time (2 s/5 s), low detection limit (20 ppb) and good selectivity at optimum operating temperature (250 °C). Such an excellent performance can be attributed to the heterojunction between MoO3 and WO3.
1. Introduction
Hydrogen sulphide (H2S), a colorless gas with a foul odor of rotten eggs, is harmful to human health and the environment.1 Usually, H2S is produced during industrial processes such as oil and natural gas drilling and refining, sewage treatment and paper milling. The threshold limit of H2S in the atmosphere defined by American Conference of Government Industrial Hygienists is 10 ppm.2 Therefore, it is necessary to develop a highly sensitive gas sensor for low concentration H2S detection in the environment.3Over the past few decades, many methods have been reported on developing novel gas sensors to detect the toxic gases.4–6 Especially, the gas sensors based on metal oxide semiconductor are the most promising candidates for toxic gases detecting due to their outstanding advantages including high sensibility, low power consumption, quick response and minitype.7 Up to now, a large number of metal oxide semiconductors such as SnO2, ZnO, Fe2O3, In2O3, NiO, and WO3 (ref. 8–15) have been widely used as gas sensing materials because of their tunable dimension and structures.
Among various materials, tungsten oxide (WO3) has great potential for gas sensing.16,17 While, the efficiency of pure WO3 is insufficient for practice uses due to the low sensitivity and long response time.18 Recently, tremendous efforts have been made to explore WO3 composites, which exhibited numerous advantages in gas sensing performance such as high response, fast response and good selectivity.19–21 For example, Kim et al.13 synthesized RuO2 nanoparticles loaded WO3 nanofibers using catalytic synthesis and functionalization method using apoferritin. The gas sensor using RuO2-functionalized WO3 nanofibers showed a significantly enhanced sensing response, which was 7.4 times higher than that of pristine WO3. Yao et al.14 fabricated Ag nanoparticle-sensitized WO3 hollow nanospheres via a simple sonochemical synthesis route. The results displayed that the Ag nanoparticle-sensitized WO3 hollow nanospheres exhibits a lower operating temperature of 230 °C, a faster response of 7 s and a superior detection limit of 0.09 ppb toward alcohol vapor. Kida et al.15 reported highly sensitive NO2 sensors using SnO2-functionalized WO3 nanolamellae by an acidification method. The WO3–SnO2 composites displayed an enhanced sensitivity of 370 to 200 ppb NO2. Up to now, although considerable efforts have been devoted to the WO3 composites, few of them focus on the flower-like MoO3@WO3 composites and optimize the content of MoO3 for H2S detection.
In this work, we successfully prepared special flower-like MoO3@WO3 composite with various Mo contents by facile hydrothermal and impregnation method. The gas sensing properties of MoO3@WO3 gas sensors were investigated under different operating temperatures. As expected, the gas sensors based on MoO3@WO3 sensors exhibit enhanced gas sensing performance compared with that of pure one. Especially, the as-prepared Mo6W sensor shows an excellent gas sensing performance toward H2S including high response, fast response/recovery time, low limit of detection, and excellent selectivity. The improvement of gas sensing performance of MoO3@WO3 composites can be attributed both to the particular structure as well as the heterojunction.
2. Materials and methods
2.1 Preparation and characterization
All chemicals are analytical grade and used as received without further purification. Pure WO3 microstructures were synthesized by the hydrothermal method. In brief, 0.4 g of tungsten hexachloride (WCl6 >99.9%, Aladdin) was dissolved into 40 mL of ethanol through vigorous stirring for 30 min. Then, the solution was transferred into a Teflon autoclave and heated at 160 °C for 24 h. The resulting product was washed with distilled water, collected via centrifugation, dried at 80 °C for 10 h and calcined at 500 °C in air for 2 h to obtain a high crystalline phase.A series of MoO3@WO3 composite microstructures (MoxW, x = 2, 4, 6, 8, correspondingly to the weight percentage of Mo element in the solution) were also prepared through a simple impregnation method, and the process is described as follows: a definite amount of ammonium heptamolybdate tetrahydrate ((NH4)6Mo7O24·4H2O >99.0%, Aladdin) were dissolved into 10 mL of deionized water. After that, 0.5 g of the WO3 powders was dispersed in the solutions with different content of Mo under continuous magnetic stirring at 80 °C for 5 h. Finally, the obtained precipitates were washed with ethanol several times and centrifugated, dried and calcined at 500 °C for 2 h. The crystal structural, morphology and chemical component of the nanostructures were characterized by X-ray diffraction (XRD, Haoyuan), scanning electron microscopy (SEM, JSM-7001F), transmission electron microscopy (TEM, JEM-2100F), and energy dispersive spectrometer (EDS, Quantas200), respectively.
2.2 Fabrication and measurement of gas sensors
The MoO3@WO3 composite gas sensors were fabricated as follows: the calcined samples were firstly mixed with a suitable amount of deionized water to form a paste. After that, the paste was coated on the ceramic tubes carefully to form sensing film. Then, a Ni–Cr heating wire was inserted in the tube to form a side heated gas sensor. Gas sensing properties of sensors were measured using a static system (CGS-1TP, Elite Tech Co., Ltd, Beijing, China). The sensor response was defined as the ratio of Ra/Rg, where Ra and Rg are the resistances of the sensor measured in air and test gas, respectively. The response and recovery times were defined as the time taken by the sensor to achieve 90% of the total resistance change in the case of air and H2S gas.3. Results and discussion
3.1 Morphology and structure analysis
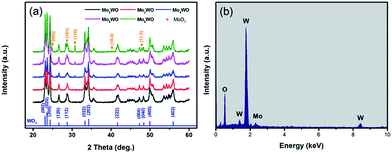
The crystal structures of the pure WO3 and MoxW after annealing at 500 °C were determined by XRD in the range of 20 to 60°, as shown in Fig. 1(a). The detected diffraction peaks for WO3 and Mo2W can be indexed to monoclinic phase of WO3 (JCPDS No. 43-1035), and no obvious characteristic peaks of MoxO can be observed. However, for Mo4W, Mo6W and Mo8W samples, the XRD patterns include not only all the peaks of WO3, but also other peaks which are well consistent with (002), (101), (110), (10−3) and (11−3) lattice planes of MoO3 (JCPDS No. 47-1320), indicating the presence of Mo. Energy dispersive spectroscopy (EDS) was employed to further verify the element in Mo8W, as shown in Fig. 1(b). There is no other element was observed except for O, W and Mo, confirming the purity of the products again.The pure WO3 and MoxW samples were characterized by FESEM, showing that all samples exhibit a flower-like hierarchical structure with a diameter of about 1.2 μm (Fig. 2(a)–(e)). Each hierarchical structure is assembled by numerous randomly ordered thin intersecting nanosheets and each nanosheet shows a thickness of around 40 nm. It is obvious that the introduction of Mo element has no apparent morphological influence. Moreover, we can observe that MoO3 nanoparticles were successfully modified on the surface of nanosheets with the increase of Mo content. Meanwhile, the high resolution TEM was introduced to confirm the nanostructural features of MoxW composite microstructures. Fig. 2(f) and (g) show the HRTEM images of the Mo8W sample, indicating the presence of the MoO3 and WO3 crystal lattices and an interplanar distances of 0.38 nm and 0.27 nm, which corresponds to the (002) planes of WO3 (ref. 22) and (110) planes of MoO3, respectively. The results indicate that MoO3 nanoparticles have been dispersed randomly on the WO3 microstructures, which is in agreement with the XRD analyses.
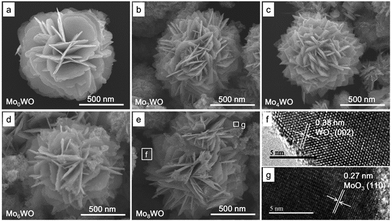 | ||
| Fig. 2 SEM and HRTEM images of as-prepared samples, (a) pure WO3, (b) Mo2W, (c) Mo4W, (d) Mo6W, (e) Mo8W, (f and g) HRTEM images of the marked section in (e). | ||
To further determine the specific distribution of O, W and Mo elements, EDS mapping was conducted on the sample of Mo8W. As shown in Fig. 3, we can clearly observe that the distribution of O and W elements are homogeneous and exhibits the identical spatial distributions (Fig. 3(b) and (c)). Moreover, the Mo element is uniform distribution in the WO3 microstructures (Fig. 3(d)), which indicates that Mo element is loaded on WO3 microstructures.
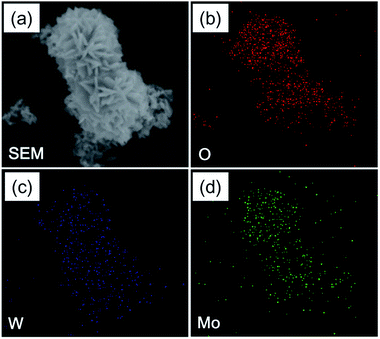 | ||
| Fig. 3 (a) SEM images of Mo8W, (b–d) corresponding elemental mapping images for oxygen, tungsten, and molybdenum, respectively. | ||
XPS measurements were also carried out on Mo6W to analyze the chemical bond configuration and surface compositions of the MoxW. The C 1s peak located at 284.6 eV is used as reference to calibrate the binding energy. Fig. 4(a) shows the low-resolution full range XPS spectrum of Mo6W, which demonstrates the presence of W, O and Mo elements. The binding energies for W 4f7/2 and W 4f5/2 peaks were measured at 35.6 and 37.8 eV, which are close to the previous reports.23 Fig. 4(c) exhibits the high resolution XPS spectrum of O 1s energy state with two distinct peaks centered at 529.9 eV and 530.4 eV. The lower and higher binding energy peaks correspond to the bulk lattice oxygen and the chemisorbed oxygen ions including O− and O2− in WO3, respectively.24 Fig. 4(d) reveals the Mo 3d XPS spectrum, which including two peaks with binding energies at 233.3 eV and 236.5 eV, corresponding to Mo 3d5/2 and Mo 3d3/2, respectively. The XPS results indicated the existence of Mo element, which is consistent with the results of XRD and EDS.25
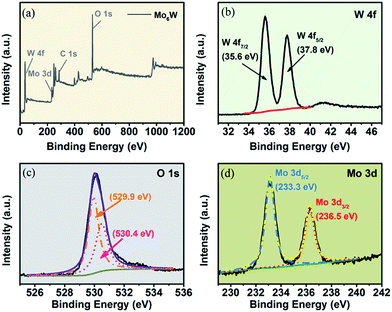 | ||
| Fig. 4 XPS scan spectrum of sample Mo6W, (a) full scan spectrum and (b–d) high resolution spectrum at W 4f, O 1s and Mo 3d state energies. | ||
3.2 Gas sensing characteristics
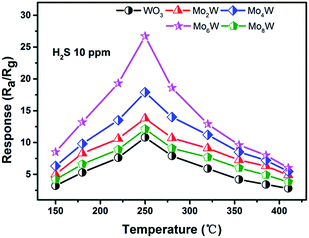
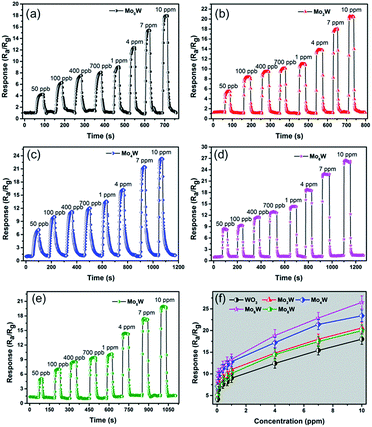
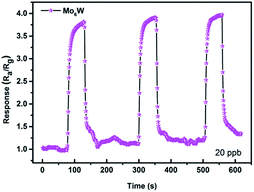
Fig. 5 shows the responses of all the as-fabricated gas sensors to 10 ppm H2S as a function of operating temperature ranging from 150 °C to 410 °C. The responses of all the gas sensors initially increase with temperature, reach their maximum values at the optimum operating temperature of 250 °C, and then dramatically decrease with the further increase of operating temperature. It is obvious that the operating temperature plays an important role in the gas sensing behavior, which can be explained from the kinetics and mechanics of gas adsorption–desorption on the surface of the MoxW. When the operating temperature is too low, the chemical activation of MoxW is consequently small, which results in a very small response. When the operating temperature is too high, some adsorbed gas molecules maybe escape before reaction because of their enhanced activation, which will lead to a decrease of the response correspondingly.26 Moreover, the MoxW sensors show higher responses, and the Mo6W sensor exhibits the highest response of 28.5 to 10 ppm H2S, which is about 2.6 times higher than that of pure WO3 sensor (10.8). The measured results indicate that the introduction of MoO3 is advantageous to improve the sensing property of WO3 gas sensor, and the as-prepared Mo6W sensor exhibits excellent gas sensing performances toward H2S detection.Fig. 6(a)–(e) presents the response transients of the gas sensors based on pure WO3 and MoxW to different concentrations of H2S gas at the optimum operating temperature. For each cycle, the response increased immediately after exposure to H2S gas and then recovered rapidly to its initial state after H2S gas removing. The results indicate that the response and recovery characteristics were almost reproducible within a short time. The responses vs. concentrations curves were plotted out to further understand the relationship between the responses and the concentrations of H2S gas, as shown in Fig. 6(f). The gas response values increase with the increase of gas concentration in the range of 0.05–10 ppm, and the sensors can detect even down to 50 ppb with high responses. Especially, the response of the gas sensor based on Mo6W towards 50 ppb H2S can reach to 8.5. However, when the gas concentration is above 4 ppm, the gas responses increase slowly, which suggests that the gas sensors become saturated at higher concentration of H2S gas. From the relationship between concentrations and responses of the as-fabricated sensors, it was found that the MoxW sensors exhibit enhanced gas sensing properties than pure WO3 sensor. By comparing, gas sensor based on Mo6W shows the highest response on each concentration of H2S among all the as-fabricated gas sensors. Meanwhile, in order to determine the detection limit, the gas sensing experiments were conducted on the Mo6W toward 20 ppb of H2S, as shown in Fig. 7. The response value can reach to 4, which indicates that the Mo6W is a potential material for lower H2S detection.
Fig. 8(a) illustrates the typical dynamic resistance curves of all the as-fabricated gas sensors to 10 ppm H2S at 250 °C. The resistance of gas sensors decreased sharply when exposure to H2S due to the reducing nature. Fig. 7(b) shows the detailed information of response/recovery times for all the sensors, demonstrating their quick response–recovery characteristics to H2S gas. Especially, the gas sensor based on Mo6W exhibits a fast response/recovery time (2 s/5 s) among all the as-fabricated gas sensors. Furthermore, the response time and recovery time of all the gas sensors as a function of the H2S concentration are shown in Fig. 9(a) and (b). Both response and recovery time decrease and finally stay in a relative stable value with increasing the gas concentration.
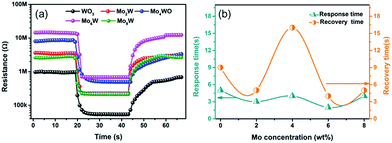 | ||
| Fig. 8 (a) Resistance transients and (b) response/recovery time of all the as-fabricated gas sensors to 10 ppm H2S. | ||
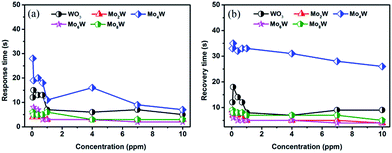 | ||
| Fig. 9 (a) Response time and (b) recovery time of all the as-fabricated gas sensors as a function of the H2S concentration. | ||
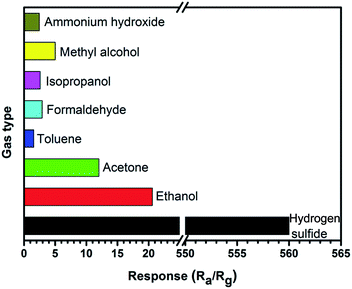
The selectivity of the gas sensor based on Mo6W was also investigated by exposing to 100 ppm various gases, including hydrogen sulphide (H2S), ethanol, acetone, toluene, formaldehyde, isopropanol, methyl alcohol and ammonium hydroxide at 250 °C, as shown in Fig. 10. Obviously, the sensor shows considerably less responsive to other gases than H2S. The measured response to 100 ppm H2S can reach to 560, which is about 28 times and 270 times higher than that of ethanol and toluene, respectively. Conclusively, the results indicate that the Mo6W composite microstructures can be used as a promising material for high performance detection of H2S. A comparable survey of the gas sensing performances between ours and other WO3-based sensors are listed in Table 1. Apparently, the Mo6W-based gas sensor exhibits a lower optimum working temperature and fastest response–recovery time than those in the reported literatures.27–34
| Material | Gas type | Concentration (ppm) | T (°C) | Response | Response/recovery time (s) | Ref. |
|---|---|---|---|---|---|---|
| Porous Au-embedded WO3 nanowires | H2S | 100 | 362 | 700 | 35/200 | 27 |
| Pristine WO3 NFs | H2S | 1 | 350 | 11.1 | 15.1/45.7 | 28 |
| Cu2O/WO3 nanoneedles | H2S | 5 | 390 | 27.5 | 2/684 | 29 |
| 0.1 wt% GR-WO3 hemitubes | H2S | 5 | 250 | 48.33 ± 21.32 | >10/>10 | 30 |
| PPy/WO3 | H2S | 1 | RT | 5 | 6/210 (min) | 31 |
| MoO3-WO3 | Ethanol | 100 | 300 | 10 | —/— | 32 |
| MoO3-WO3 thin-film | O2 | 1000 | 420 | 4.4 | 5.4/6 | 33 |
| MoO3 (5 wt%)–WO3 | NH3 | 5 | 450 | 6 | —/— | 34 |
| Mo6W | H2S | 10 | 250 | 28.5 | 2/5 | This work |
3.3 Gas sensing mechanism
It is known that the gas sensing mechanism of WO3 is surface-controlled type, and associates with the chemisorbed oxygen ions. For pure WO3, oxygen molecules on the surface will become oxygen ions through trapping electrons from the conduction bond of WO3, resulting in a decrease of carriers and increase the depletion layer. Thus, the resistance of WO3 would be in a high level. When the WO3 is exposed in H2S gas, the oxygen ions in the surface will react with H2S molecules, produce SO2 and H2O, and release electron back to the conduction bond of WO3, which cause the decrease of electric resistance of WO3. This process can be expressed in the following reaction:31,35| H2S + O−(ads) → H2O + SO2 + e− | (1) |
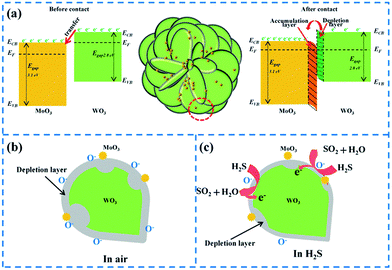
The excellent gas sensing performance of the MoxW samples might be ascribed to the heterojunction structure between WO3 and MoO3, which is similar to that reported previously.36,37 At the interface of MoO3 and WO3, the electrons move from WO3 to MoO3 until the Fermi levels align, since the different work functions as shown in Fig. 11(a).18,38 Consequently, a thicker electron depletion layer forms at the interface between MoO3 and WO3, as shown in Fig. 11(b). MoxW has a higher initial resistance in air and releases more electrons into the conduction band of WO3 when exposed to H2S ambient (Fig. 11(c)), resulting in larger resistance change (higher response) compared to the pure WO3. We found that when the weight percentage of Mo element is about 6, the MoxW shows the maximum gas sensitivity, indicating that appropriate MoO3 can significantly enhance the gas sensing properties.39
4. Conclusions
Pure WO3 and MoO3@WO3 composite microstructures were successfully synthesized through hydrothermal and impregnation method. The crystal structure and morphology of the as-prepared samples were characterized and analyzed. Gas sensing performances of pure and MoO3@WO3 composite microstructures towards hydrogen sulfide gas were also investigated and compared. The measurement results reveal that the gas sensor based on Mo6W has the a high sensitivity, a quick response/recovery time and a good selectivity to hydrogen sulfide at the optimum operating temperature of 250 °C, which is a highly promising material for gas sensing applications.Acknowledgements
This work was supported by the National Natural Science Foundation of China (51205274), the National Natural Science of Shanxi Province Science (2016011039), the Talent project of Shanxi Province (201605D211020), Higher School Science and Technology Innovation Project of Shanxi (2016137), the Graduate Education Innovation Fund (02100738), the Technology Major Project of the Shanxi and Technology Department (20121101004) and the Key Disciplines Construction in Colleges and Universities of Shanxi ([2012]45).Notes and references
- X. Liu, S. Du, Y. Sun, M. Yu, W. Tang, C. Chen, L. Sun, B. Yang, W. W. Cao and M. N. R. Ashfold, ACS Appl. Mater. Interfaces, 2016, 8, 16379–16385 CAS.
- Y. J. Chen, X. M. Gao, X. P. Di, Q. Y. Quyan, P. Gao, L. H. Qi, C. Y. Li and C. L. Zhu, ACS Appl. Mater. Interfaces, 2013, 5, 3267–3274 CAS.
- Z. S. Hosseini, A. Irajizad and A. Mortezaali, Sens. Actuators, B, 2015, 207, 865–871 CrossRef CAS.
- R. Tabassum and B. D. Gupta, Appl. Opt., 2015, 54, 1032–1040 CrossRef CAS PubMed.
- T. Hübert, L. Boon-Brett, G. Black and U. Banach, Sens. Actuators, B, 2011, 157, 329–352 CrossRef.
- E. Brauns, E. Morsbach, S. Kunz, M. Bäumer and W. Lang, Sens. Actuators, B, 2014, 193, 895–903 CrossRef CAS.
- N. Barsan, D. Koziej and U. Weimar, Sens. Actuators, B, 2007, 121, 18–35 CrossRef CAS.
- M. Yuasa, K. Suematsu, K. Yamada, K. Watanabe, T. kida, N. Yamazoe and K. Shimanoe, Cryst. Growth Des., 2016, 16, 4203–4208 CAS.
- K. Hagedorn, W. Y. Li, Q. J. Liang, S. Dilger, M. Noebels, M. R. Wagner, J. S. Reparaz, A. Dollinger, J. S. Günne, T. Dekorsy, L. Schmidt-Mende and S. polarz, Adv. Funct. Mater., 2016, 26, 3424–3437 CrossRef CAS.
- Y. J. Zhang, D. K. Zhang, W. M. Guo and S. J. Chen, J. Alloys Compd., 2016, 685, 84–90 CrossRef CAS.
- J. W. Yoon, J. S. Kim, T. H. Kim, Y. J. Hong, Y. C. Kang and J. H. Lee, Small, 2016, 12, 4229–4240 CrossRef CAS PubMed.
- A. A. Khaleed, A. Bello, J. K. Dangbegon, D. Y. Momodu, M. J. Madito, F. U. Ugbo, A. A. Akande, B. P. Dhonge, F. Barzegar, O. Olaniyan, B. W. Mwakikunga and N. Manyala, J. Alloys Compd., 2017, 694, 155–162 CrossRef CAS.
- K. H. Kim, S. J. Kim, H. J. Cho, N. H. Kim, J. S. Jang, S. J. Choi and Il. D. Kim, Sens. Actuators, B, 2017, 241, 1276–1282 CrossRef CAS.
- Y. Yao, F. X. Ji, M. L. Yin, X. P. Ren, Q. Ma, J. Q. Yan and S. Z. F. Liu, ACS Appl. Mater. Interfaces, 2016, 8, 18165–18172 CAS.
- T. Kida, A. Nishiyama, Z. Q. Hua, K. Suematsu, M. Yuasa and K. Shimanoe, Langmuir, 2014, 30, 2571–2579 CrossRef CAS PubMed.
- Y. D. Zhang, W. W. He, H. X. Zhao and P. J. Li, Vacuum, 2013, 95, 30–34 CrossRef CAS.
- M. L. Yin, L. M. Yu and S. Z. Liu, J. Alloys Compd., 2017, 696, 490–497 CrossRef CAS.
- X. J. Yang, V. Salles, Y. Kaneti, M. S. Liu, M. Maillard, C. Joumet, X. C. Jiang and A. Brioude, Sens. Actuators, B, 2015, 220, 1112–1119 CrossRef CAS.
- X. D. Zhao, H. M. Ji, Q. Q. Jia and M. J. Wang, J. Mater. Sci.: Mater. Electron., 2015, 26, 8217–8223 CrossRef CAS.
- W. W. Guo and Z. C. Wang, Mater. Lett., 2016, 169, 246–249 CrossRef CAS.
- P. Gao, H. M. Ji, Y. G. Zhou and X. L. Li, Thin Solid Films, 2012, 520, 3100–3106 CrossRef CAS.
- K. Huang, Q. Zhang, F. Yang and D. Y. He, Nano Res., 2010, 3, 281–287 CrossRef CAS.
- Y. H. Yang, F. Q. Zhan, H. Li, W. H. Liu and S. Yu, J. Solid State Electrochem., 2017 DOI:10.1007/s10008-017-3569-4.
- Y. Wang, Z. T. Zhao, Y. J. Sun, P. W. Li, J. L. Ji, Y. Chen, W. D. Zhang and J. Hu, Sens. Actuators, B, 2017, 240, 664–673 CrossRef CAS.
- J. Swiatowska-Mrowiecka, S. deDiesbach, V. Maurice, S. Zanna, L. Klein, E. Briand, I. Vickridge and P. Marcus, J. Phys. Chem. C, 2008, 112, 11050–11058 CAS.
- L. Liu, S. C. Li, J. Zhang, L. Y. Wang, J. B. Zhang, H. Y. Li, Z. Liu, Y. Han, X. X. Zhang and P. Zhang, Sens. Actuators, B, 2011, 155, 782–788 CrossRef CAS.
- N. M. Vuong, D. Kim and H. Kim, Sci. Rep., 2015, 5, 11040 CrossRef PubMed.
- N. H. Kim, S. J. Choi, D. J. Yang, J. Bae, J. Park and D. Kim, Sens. Actuators, B, 2014, 193, 574–581 CrossRef CAS.
- F. E. Annanouch, Z. Haddi, S. Vallejos, P. Umek, P. Guttmann, C. Bittencourt and E. Llobet, ACS Appl. Mater. Interfaces, 2015, 7, 6842–6851 CAS.
- S. J. Choi, F. Fuchs, R. Demadrille, B. Grevin, B. H. Jang, S. J. Lee, J. H. Lee, L. H. Tuller and D. Kim, ACS Appl. Mater. Interfaces, 2014, 6, 9061–9070 CAS.
- P. G. Su and Y. T. Peng, Sens. Actuators, B, 2014, 193, 637–643 CrossRef CAS.
- K. Galatsis, Y. X. Li, W. Wlodarski, E. Comini, G. Sberveglieri, C. Cantalini, S. Santucci and M. Passacantando, Sens. Actuators, B, 2002, 83, 276–280 CrossRef CAS.
- K. Galatsis, Y. X. Li, W. Wlodarski and K. Kalantar-zadeh, Sens. Actuators, B, 2001, 77, 478–483 CrossRef CAS.
- C. N. Xu, N. Miura, Y. Ishida, K. Matsuda and N. Yamazoe, Sens. Actuators, B, 2000, 65, 163–165 CrossRef CAS.
- R. H. Bari, S. B. Patil and A. R. Bari, Int. Nano Lett., 2013, 12, 1–5 Search PubMed.
- P. Li, H. Q. Fan and Y. Cai, Sens. Actuators, B, 2013, 185, 110–116 CrossRef CAS.
- W. L. Zang, Y. X. Nie, D. Zhu, P. Deng, L. L. Xing and X. Y. Xue, J. Phys. Chem. C, 2014, 118, 9209–9216 CAS.
- M. Ahsan, M. Z. Ahmad, T. Tesfamichael, J. Bell, W. Wlodarski and N. Motta, Sens. Actuators, B, 2012, 173, 789–796 CrossRef CAS.
- C. B. Liu, H. Shan, L. Liu, S. C. Li and H. Y. Li, Ceram. Int., 2014, 40, 2395–2399 CrossRef CAS.
| This journal is © The Royal Society of Chemistry 2017 |

