
 Open Access Article
 This Open Access Article is licensed under a
 Creative Commons Attribution 3.0 Unported Licence
Retracted Article: Spatially resolved mechanical properties of photo-responsive azobenzene-based supramolecular gels†
Gyuri Mun‡
a,
Heekyoung Choi‡a,
Nayoung Ima,
Junho Ahna,
Jaehyeon Parka,
Hyowon Seoa,
Yeonweon Choia,
Ji Ha Lee *ab and
Jong Hwa Jung*a
*ab and
Jong Hwa Jung*a
aDepartment of Chemistry and Research Institute of Natural Sciences, Gyeongsang National University, Jinju 660-701, Korea. E-mail: jonghwa@gnu.ac.kr
bDepartment of Chemistry and Biochemistry, The University of Kitakyushu, HiBikino, Kitakyushu 808-013, Japan. E-mail: l-ji@kitakyu-u.ac.jp
First published on 19th May 2017
Abstract
The viscoelastic and stiffness properties of azobenzene-based supramolecular gels have been investigated by rheometry and AFM. Interestingly, the viscoelastic properties of cis-isomers were 8–10 fold enhanced in comparison to the trans-isomer, which was a unique phenomenon. More interestingly, Young's modulus of gels increased linearly with time of UV irradiation. The stiffness of gels was finely controlled in the spatial micro-scale environment. The improved mechanical strength was attributed to electrostatic interaction with the production of radicals of the gelators.
Introduction
Stimuli-responsive supramolecular gels, which can respond to external stimuli such as pH, redox changes and light, have recently attracted great attention because such gel systems can serve as functional materials with potential applications in the areas of drug/gene delivery, photography, paints/coatings and sensors.1–19 Among photo-responsive supramolecular gels prepared from stilbene,20,21 coumarin,22 thymine23 and azobenzene derivatives,24–31 the azobenzene-based supramolecular gels have a unique light-induced trans–cis isomerization property.27–31 Irradiation of azobenzene units with light causes them to isomerize from the more stable trans to the less stable cis configuration. The trans-isomer of azobenzene-based gels also revealed usually high mechanical properties as compared to the cis-isomer. Thus, they have been used as light-responsive units in many gel systems in which the sol-to-gel or gel-to-sol phase transition is simply controlled by light-induced trans–cis isomerization of the azobenzene units.27–31 However, photoresponsive supramolecular gels have not been systematically investigated for the mechanical properties of both the trans- and cis-isomers of azobenzene-based gels prepared by light. Thus, the precise mechanical properties of the stimuli-responsive supramolecular gels are still challenging research topics. The mechanical properties of gels in the spatial micro-scale range are absolutely important for use in biological applications.32–34 For instance, the stiffness of the cell microenvironment displays high variations within the body, such as in brain (240–490 Pa), liver (640 Pa), kidney (2.5 kPa), skeletal muscle (12–100 kPa) and cartilage (950 Pa).35,36We have synthesized two azobenzene-based gelators (1 and 1A), which have C3 symmetric structures composed with a central amine. These derivatives are known to generate a cation radical on the central nitrogen atom with UV irradiation in nonpolar solvents such as chloroform and dichloromethane.37 The radicals adopt more planar configurations than the neutral forms and facilitate stacking.38–41 Also, they would enhance the intermolecular interaction with electrostatic interactions between the cation radical and negatively charged part of solvent molecule in supramolecular formations, which would, in turn, form strong gels (Fig. S1†). Herein, we show that the mechanical properties of supramolecular gels were controlled by light, and these processes could also be reversed by light. More interestingly, the mechanical properties of the cis-isomer in the supramolecular gels generated by UV irradiation were stronger than those of the trans-isomer. This finding is a unique property for mechanical properties of photoresponsive gels because the enhanced mechanical properties of azobenzene-based gels with cis-isomerization have not been examined by UV irradiation. Furthermore, the stiffness of the gels could be finely controlled on the spatial micro-scale by UV irradiation.
Results and discussion
We synthesized two azobenzene-based gelators (Fig. 1) with different carbon structures between the amide and amide groups by multi-step reactions as shown in Schemes S1 and S2.† The desired azobenzene-based gelators 1 and 1A were obtained as 55% and 78% yields, respectively. These gelators were fully characterized by 1H, 13C NMR, mass spectroscopy and elemental analysis. | ||
| Fig. 1 Chemical structures of azobenzene-based gelators 1 and 1A. | ||
The formation of self-assembled supramolecular gels was evaluated in various solvents such as chloroform, methylene chloride, toluene, methanol, ethanol, ethyl acetate, acetonitrile, tetrahydrofuran, acetone and water. The samples were then left to stand for a week, and the results are summarized in Table S1.† Supramolecular gels 1 and 1A were obtained in a mixture of DMSO/CHCl3 (1![[thin space (1/6-em)]](https://www.rsc.org/images/entities/char_2009.gif) :5 v/v) within 10 min and 30 min, respectively, which instantaneously led to the formation of robust gels that were resistant to inversion tests (Fig. S2†). These gels remained stable for more than 6 months, indicating that compounds 1 and 1A formed network structures with intermolecular interactions.
:5 v/v) within 10 min and 30 min, respectively, which instantaneously led to the formation of robust gels that were resistant to inversion tests (Fig. S2†). These gels remained stable for more than 6 months, indicating that compounds 1 and 1A formed network structures with intermolecular interactions.
Azobenezene-based derivatives exhibited two characteristic bands that shifted depending on the substituents of the phenyl rings: one intense band in the UV region (∼320–360 nm) corresponded to the π–π* transition and one weak band in the visible region (∼420–450 nm) corresponded to the n–π* transition.27–31 The absorption bands of N-phenyl central derivatives are generally shown at the range of ca. 300–350 nm, which might be overlapped with those of the azobenzene.42,43 Due to symmetry constraints, the n–π* transition of the azobenzene was not allowed in the planar trans configuration, therefore making the visible range absorbance very weak. In contrast, upon UV irradiation, the n–π* transition was allowed, and the absorbance in the visible range increase because the molar extinction coefficient for the cis n–π* transition was larger than that of the trans n–π* transition.27–31 These characteristics were observed in the supramolecular gels 1 and 1A formed here. Before exposure to UV light, the gels showed an absorbance maximum at 330 nm (Fig. 1 and S3†), which indicated the π–π* transition and the presence of the azobenzene moiety in the trans state. With UV irradiation for 3 h at 365 nm (10 mW cm−2), the absorption bands of gel-1 and gel-1A at 330 nm decreased, and absorption bands of gel-1 and gel-1A at 450 nm increased gradually (Fig. 2A and S3A†), which corresponded to the n–π* transition and the appearance of a photostationary state that is predominantly composed of the cis isomer. The absorbance band of gels at 450 nm showed a linear increase with increasing UV irradiation time for 3 h (Fig. 2B and S3B†). The decrease of the absorbance at 325 nm was not plotted due to the fact that the absorption band of N-phenyl central group could be overlapped with that of azobenzene around 325 nm. Thus, we considered that the quantitative analysis of the isomerization might not be precise in this range. Furthermore, the trans state could be recovered with minimal hysteresis by irradiation with visible light source (450 nm, 10 mW cm−2) (Fig. S4†). Interestingly, gels did not exhibit any disassembly through UV irradiation, but became more opaque. These findings are a rare example of stabilization of azobenzene-based gels 1 and 1A with the cis-isomer. The morphologies of xerogels 1 and 1A prepared by freeze drying were observed by scanning electron microscopy (SEM) and atomic force microscopy (AFM). The SEM images of gels 1 and 1A clearly displayed fibrous structures with diameters of 250–800 nm, which were branched from fiber to fiber (Fig. S5†). AFM images were also obtained and were similar to those of SEM images (Fig. S6†).
 | ||
| Fig. 2 UV spectra changes of supramolecular gel (A) 1 (red: before UV irradiation) and (C) 1A by UV irradiation. Plot for the absorbance intensity of gel (B) 1 and (D) 1A at 450 nm vs. UV irradiation times. | ||
To obtain a proper understanding of the mechanism for gel formation, the supramolecular gel formation provided intermolecular hydrogen-bonding interactions between –C![[double bond, length as m-dash]](https://www.rsc.org/images/entities/char_e001.gif) O and –NH groups of gelators. The as-prepared xerogel-1 was first characterized by FTIR, showing well-defined amide I bands centered at 1653 cm−1 and amide II bands centered at 1551 cm−1 (Fig. S7a†). In contrast, amide I and II bands of 1 in homogeneous chloroform solution appeared at around 1670 cm−1 and 1540 cm−1, respectively (Fig. S7b†). These observations suggest well-developed hydrogen bonding networks formed through the amide unit in the self-assembled nanofibers. Similarly, FTIR spectra of gel-1A showed amide I and II bands centered around 1655 cm−1 and 1550 cm−1, respectively (Fig. S8†). FTIR studies confirmed that these gels frameworks were stabilized by intermolecular hydrogen bonding interactions between amide groups.44–46
O and –NH groups of gelators. The as-prepared xerogel-1 was first characterized by FTIR, showing well-defined amide I bands centered at 1653 cm−1 and amide II bands centered at 1551 cm−1 (Fig. S7a†). In contrast, amide I and II bands of 1 in homogeneous chloroform solution appeared at around 1670 cm−1 and 1540 cm−1, respectively (Fig. S7b†). These observations suggest well-developed hydrogen bonding networks formed through the amide unit in the self-assembled nanofibers. Similarly, FTIR spectra of gel-1A showed amide I and II bands centered around 1655 cm−1 and 1550 cm−1, respectively (Fig. S8†). FTIR studies confirmed that these gels frameworks were stabilized by intermolecular hydrogen bonding interactions between amide groups.44–46
To investigate the nanofiber gel formation in greater depth, we used an analytical technique based on nuclear magnetic resonance (NMR) spectroscopy to provide quantitative insight into the phase behavior of the gelator. Using variable temperature (VT) NMR, we measured the NMR signal of gelator 1 or 1A (20 mM) in DMSO-d6/CDCl3 (1:5 v/v, 0.5 mL) at increasing temperatures (Fig. S9 and S10†). As the temperature increased, –NH protons of gelators 1 and 1A were shifted to higher field and were relatively shape in comparison to the spectra obtained at lower temperature, which suggested that there is a significant loss in the intermolecular hydrogen-bonding interaction between gelator 1 or 1A molecules. In contrast, aromatic protons were shifted to a lower field upon increasing temperature, which caused π–π stacking between gelator molecules. Thus, 1 and 1A formed self-assembled supramolecular polymers by mainly intermolecular hydrogen-bonding interactions as well as by π–π stacking.
From the VT NMR data and by implementing the van't Hoff equation38–40 to consider gelator 1 or 1A disassembly of the nanofibers as a dissolution event, we determined the thermodynamic parameters for the self-assembled gels 1 and 1A (Fig. S11 and S12†). Based on the notion that ΔH and ΔS are temperature independent over the range of 25–85 °C, the NMR data were used to provide a measure of the gel–sol transition. The enthalpy and entropy of 1 were calculated to be −94.3 kJ mol−1 and −264.8 J mol−1 K−1, respectively. In contrast, enthalpy and entropy of 1A yielded −74.8 kJ mol−1 and −229.3 J mol−1 K−1, respectively. It is worth noting that gelator 1 or 1A formed gel spontaneously at room temperature. The enthalpic value of gel 1 was larger than that of gel 1A, which was attributed to relatively well-organized molecular arrangement within a rigid molecule. Furthermore, the association constants of gels 1 and 1A were obtained at various temperatures as shown in Tables S2 and S3.† From the plot for association constants vs. temperatures (Fig. S13 and S14†), Gibb's energies (ΔG) of gels 1 and 1A were exergonic reactions until 57–60 °C, indicative of the sol–gel transition temperature for gels 1 and 1A. Thus, they formed self-assembled gels spontaneously at the sol–gel transition temperature.
To understand the viscoelastic properties of gels 1 and 1A by UV irradiation, the storage modulus (G′) and loss modulus (G′′) were determined by using rheometry in conjunction with UV irradiation. As shown in Fig. S15 and S16,† the characteristic profiles for gels 1 and 1A before UV irradiation showed that G′ was nearly an order of magnitude greater than G′′ with the response being consistent across a strain range of 0.1–1%. G′ and G′′ values of gel 1 were higher than that of gel 1A, which was consistent with the thermodynamic properties (Fig. 3, S15 and S16†). This result also suggested that gels 1 and 1A were able to sufficiently stabilize the gel formation. These viscoelastic values of gels 1 and 1A were ca. 100–1000 fold higher than those of the self-assembled gels formed with non-covalent bonds, as compared to gels reported previously.47–50 The enhanced viscoelastic properties of the gels might be due to a synergic effect of both the intermolecular hydrogen-bonds and π–π stacking of gelator molecules in gel formation. The γ (G′′/G′ = 1) value of gel 1 was smaller than that of gel 1A, because of the rigid structure of gelator 1 as compared to gelator 1A. Each gel was further assessed by frequency sweep analysis using 0.01% strain amplitude. No significant differences were obtained by frequency sweep, which indicated weaker mobility within the rigid molecules.
More interestingly, upon irradiation with UV light (365 nm, 10 mW cm−2, 0–3 h), G′ and G′′ values of gel-1 and gel-1A increased for 3 h (Fig. 3), and almost reached equilibrium after 3 h. The gel modulus values were 8–10 fold higher than those of gels 1 and 1A before UV irradiation (Fig. 3). Increased G′ and G′′ values of gel 1 by UV irradiation was due to a stronger interaction between the gelator and species with the radical produced on the central nitrogen atom of the gelator. After removal of the irradiating light, G′ remained constant for 60 min, after which a visible light cue was introduced (400–500 nm, 10 mW cm−2, 60 min) and G′′ quickly decreased back to the initial modulus. Again, with removal of the light, G′ remained constant until the next light cue was introduced. Although three cycles are shown in Fig. 4 and S17,† the gel retained its dynamic switching characteristics over numerous cycles. Furthermore, because of its small absolute value, no significant changes were observed in the loss modulus, G′′. To assess changes in mechanical properties by the thermal isomerization without visible light, the UV-irradiated gels were leaved in a darkroom for 24 h and the UV-vis spectra of the gels were measured (Fig. S18†). As a result, the absorbance of the gels were almost not changed, indicating that the cis conformation was stable and the thermal isomerization from cis to trans was not occurred without visible light.
 | ||
| Fig. 3 Plot for viscoelastic properties of (A) gel 1 and (B) gel 1A vs. UV irradiation times. | ||
 | ||
| Fig. 4 The recovery test (3 cycles) of gel 1 by light (400 nm, 10 mW cm−2). | ||
To determine the spatiotemporal mechanical properties of gel 1 and gel 1A after different times of exposure to UV irradiation, the gel sample was prepared on a silicon wafer (1 × 1 cm). The gel on the silicon wafer was irradiated with UV light by the photomasking technique (Fig. 5). Then, we measured the stiffness of the gel by atomic force microscopy (AFM). Each sample was measured with slow force–distance (FD) curves with 10 points of repeat. Fig. S19 and S20† shows the FD curves of gel prepared by different UV irradiation times through the photo masking technique. For example, at an indentation depth (nm) >0, the cantilever was not in contact with the gel. As the cantilever pyramidal tip contacted the gel at an indentation depth = 0, the force recorded by the cantilever started to increase, exhibiting a non-linear relationship with the indentation. This non-linear relationship is caused by an increase of the contact area as the pyramidal tip indents the gel. By fitting the contact part of the force–indentation curve to the 4-sided pyramidal indenter model, we precisely determined the Young's modulus (E) as a function of position on the gel surface. As shown in Fig. S19 and S20,† the FD curves of the gels showed different slopes between forces as related to indentation depth. The FD curves were reproducible. Among 9 positions on the surface of the gel 1 sample, the slope of the FD curve on the gel surface after UV irradiation for 3 h was highest, indicative of the greatest gel stiffness. In contrast, the slope of the FD curve on the gel before UV exposure was smallest. Fig. 5 illustrates the spatial variation of the Young's modulus, E, of the gel produced by different times of UV irradiation. The Young's modulus increased linearly from ∼120 kPa to 950 kPa upon increasing UV irradiation time over 3 h. In contrast, no significant change was observed in the Young's modulus of gel 1 after UV exposure for 3 h, indicating that the cis-isomer of the gelator was stabilized by UV light. As expected, the tendency toward an increase of the Young's modulus of the gel is similar to the macro-rheology measurement. In addition, Young's modulus of gel 1A after UV irradiation showed a similar tendency as gel 1 (Fig. 5C and S20†). These gel stiffness measurements strongly support the view that these gel systems can be easily controlled by a spatially resolved mechanical property in non-contact mode by an external stimulus such as light.
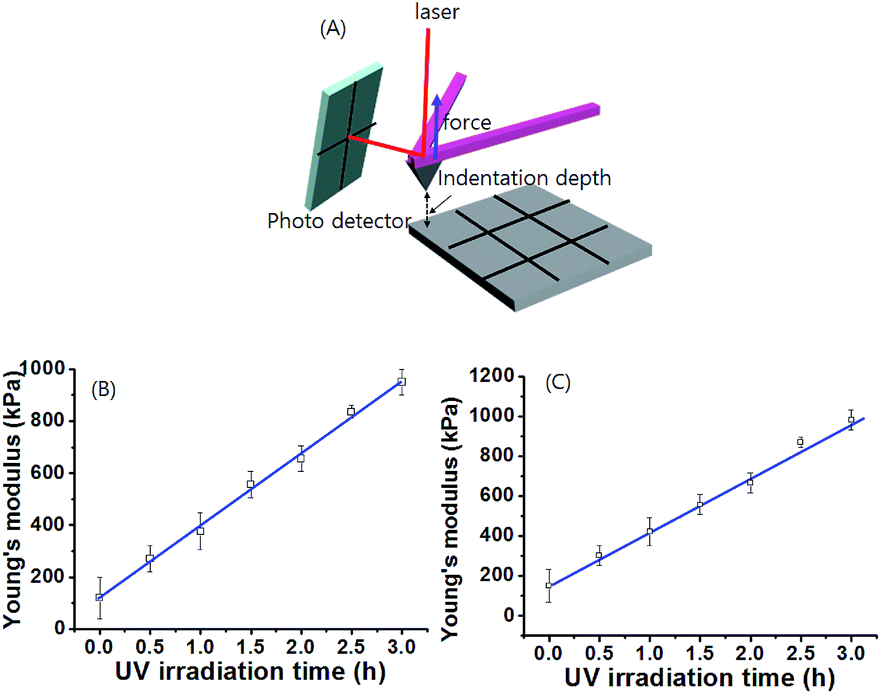 | ||
| Fig. 5 (A) The illustrate of stiffness measurements. Plot of Young's modulus of supramolecular (B) gel 1 and (C) gel 1A vs. UV irradiation time for 3 h. The Young's modulus were obtained by 10 repeated measurements. | ||
Experimental section
General characterization
Using a Bruker ARX 300, the 1H and 13C NMR spectra of the samples were obtained. IR spectra were obtained for KBr pellets, in the range 400–4000 cm−1, with a Shimadzu FTIR 8400S instrument. A Hitachi U-2900 was used to determine the optical absorption spectra while a JEOL JMS-700 mass spectrometer was used to obtain the mass spectra.Rheological properties
Rheological test of gels were carried out by using an AR-2000ex (TA Instruments Ltd., New Castle, DE, USA) was implemented with a 40 mm diameter parallel plate that was attached to a transducer. The gap in the setup for rheological testing of the gels was 1.0 mm and experiments were conducted at 25 °C. Strain sweep tests were performed with increasing amplitude oscillation up to 100% apparent strain on shear. Frequency sweeps were performed from 5–1000 Hz.SEM observation
An FE-SEM, Philips XL30 S FEG field emission scanning electron microscope was used to obtain images of freeze-dried gel samples using an accelerating voltage 5–15 kV and an emission current of 10 μA. Prior to SEM observation, the gels were transferred into liquid N2 for 10 min and subsequently freeze-dried for 24 h at −40 °C in a 0.1 Pa vacuum to thoroughly remove the water. Samples were observed from the side after cutting.Characterization of gel stiffness by atomic force microscopy
We characterized the gel stiffness by the Young's modulus (E). Values of the spatially-dependent moduli of the stiffness-gradient gels were measured by AFM, using a Bioscope Catalyst NanoScope V device (Bruker, Santa Barbara, CA) attached to an inverted optical microscope (LX71, Olympus, Japan). The gels were probed with a V-shaped cantilever (MSCT, pyramidal tipped, nominal k = 0.05 N m−1; Bruker) whose spring constant was calibrated by the thermal fluctuations method. The relationship between photodiode signal and cantilever deflection was computed from the slope of the force displacement curve obtained at bare region of the coverslip. For each gel point, we acquired ten force–distance (FD) curves (where F = kd, where d is the deflection of the cantilever) by monitoring F and D while the piezo translator was ramped forward and backward at constant speed (5 μm amplitude, 1 Hz and ∼500 nm of indentation, less than the tip height which was 2.5 μm).Preparation of supramolecular gels
Compound 1 (25 mg, 0.0198 mol) and compound 1A (25 mg, 0.018 mol) formed the gels in 1 mL of DMSO:CHCl3 = 1:5 (v/v) solvent, respectively.
Preparation of gel sample for AFM measurement
Compound 1 or compound 1A were dissolved in DMSO:CHCl3 = 1:5 (v/v) solutions. The reaction mixture was dropped (50 μL) on a silicon wafer (1 cm × 1 cm). The gel formed on the silicon wafer was exposed to UV light for different times with a photomasking technique.
Synthesis and characterization
:ethyl acetate = 2:1). 1H NMR (300 MHz, DMSO-d6) σ ppm 1.56 (m, 4H), 2.18 (m, 2H), 3.29 (m, 2H), 3.63 (s, 3H), 3.83 (d, J = 5.93 Hz, 2H), 7.61 (m, 3H), 7.95 (m, 4H), 8.02–8.10 (m, 2H), 8.27 (t, J = 5.84 Hz, 1H), 8.66 (t, J = 5.54 Hz, 1H). IR (KBr, cm−1) 675, 753, 857, 915, 965, 1014, 1210, 1299, 1368, 1422, 1461, 1520, 1648, 1761, 2858, 2951, 3047, 3333. 13C NMR (300 MHz, DMSO-d6) σ ppm 173.12, 170.99, 165.77, 153.65, 152.40, 137.33, 132.47, 130.04, 128.95, 123.21, 122.81, 52.09, 35.15, 29.13.Conclusions
In summary, we have demonstrated that the mechanical and the thermodynamic properties of azobenzene-based supramolecular gels can be controlled by light. The formations of supramolecular gels were exergonic reactions, as shown by 1H NMR measurement. The enthalpy and entropy values of gel 1 were larger than those of gel 1A. Unexpectedly, UV irradiation led to a strong gel formation. Viscoelastic properties of the supramolecular gels after UV irradiation were 8–10 fold enhanced in comparison to these same properties measured before UV irradiation, which was attributed to electrostatic interaction that occurred with production of the radical species of the gelator. These mechanical properties were completely reversible by UV and Vis light irradiation. In particular, Young's modulus of supramolecular gels increased linearly with UV irradiation over the period of 3 h, which could be controlled in a spatial environment on the micro-scale. In particular, this gel stiffness on the spatial micro-scale was controllable by UV irradiation. Thus, we expect that this approach should be applicable to a broad variety of smart-materials functional/structural gels by implementing functional derivatives.Acknowledgements
This work was supported by the NRF (2015R1A2A2A05001400 and 2012R1A4A1027750) from the Ministry of Education, Science and Technology, Korea. In addition, this work was partially supported by a grant from the Next-Generation BioGreen 21 Program (SSAC, grant#: PJ011177022016), Rural development Administration, Korea. And J. H. L. thanks the Japan Society for the Promotion of Science (JSPS) for research fellowship 15F15342.Notes and references
- A. Dawn, T. Shiraki, S. Haraguchi, S.-I. Tamaru and S. Shinkai, Chem.–Asian J., 2011, 6, 266 CrossRef CAS PubMed.
- X. Yang, G. Zhanga and D. Zhang, J. Mater. Chem., 2012, 22, 38 RSC.
- V. K. Praveen, C. Ranjith and N. Armaroli, Angew. Chem., Int. Ed., 2014, 53, 365 CrossRef CAS PubMed.
- P.-R. Raúl and D. D. David, Soft Matter, 2015, 11, 5180 RSC.
- J. Raeburn and D. J. Adams, Chem. Commun., 2015, 51, 5170 RSC.
- M. Zhang, D. Xu, X. Yan, J. Chen, S. Dong, B. Zheng and F. Huang, Angew. Chem., Int. Ed., 2012, 51, 7011 CrossRef CAS PubMed.
- A. Gopal, M. Hifsudheen, S. Furumi, M. Takeuchi and A. Ajayaghosh, Angew. Chem., Int. Ed., 2012, 51, 10505 CrossRef CAS PubMed.
- G. Fan and D. Yan, Sci. Rep., 2014, 4, 4933 CrossRef CAS PubMed.
- J. Eastoe, M. S. Dominguez, P. Wyatt and R. K. A. Heenan, Chem. Commun., 2014, 2608 Search PubMed.
- H.-J. Kim, K. Zhang, L. Moore and D. Ho, ACS Nano, 2014, 8, 2998 CrossRef CAS PubMed.
- J. KishoreáSahoo and S. K. MohanáNalluri, Chem. Commun., 2014, 50, 5462 RSC.
- S. R. Lustig, G. J. Everlof and G. D. Jaycox, Macromolecules, 2011, 44, 5105 CrossRef.
- H. Shih and C. C. Lin, J. Mater. Chem. B, 2016, 4, 4969 RSC.
- B. W. Tuft, L. Zhang, L. Xu, A. Hangartner, B. Leigh, M. R. Hansen and C. A. Guymon, Biomacromolecules, 2014, 15, 3717 CrossRef CAS PubMed.
- R. J. Mart and R. K. Allemann, Chem. Commun., 2016, 52, 12262 RSC.
- A. A. Beharry, O. Sadovski and G. A. Woolley, J. Am. Chem. Soc., 2011, 133, 19684 CrossRef CAS PubMed.
- Y. L. Zhao and J. F. Stoddart, Langmuir, 2009, 25, 8442 CrossRef CAS PubMed.
- M. Han, S. J. Cho, Y. Norikane, M. Shimizu and T. Seki, Chem.–Eur. J., 2016, 22, 3971 CrossRef CAS PubMed.
- M. Poutanen, O. Ikkala and A. Priimagi, Macromolecules, 2016, 49, 4095 CrossRef CAS.
- M. Yamauchi, T. Ohba, T. Karatsu and S. Yagai, Nat. Commun., 2015, 6, 8936 CrossRef CAS PubMed.
- J. W. Chung, B.-K. An and S. Y. Park, Chem. Mater., 2008, 20, 6750 CrossRef CAS.
- E. R. Draper, E. G. B. Eden, T. O. McDonald and D. J. Adams, Nat. Chem., 2015, 7, 848 CrossRef CAS PubMed.
- K. Yang and M. Zeng, New J. Chem., 2013, 37, 920 RSC.
- K. Iwaso, Y. Takashima and A. Harada, Nat. Chem., 2016, 8, 625 CrossRef CAS PubMed.
- L. H. Urner, B. N. S. Thota, O. Nachtigall, S. Warnke, G. von Helden, R. Haag and K. Pagel, Chem. Commun., 2015, 51, 8801 RSC.
- E. Borr, J.-F. Stumb, S. P. B. Laponnaz and M. Mauro, Angew. Chem., Int. Ed., 2016, 55, 1313 CrossRef PubMed.
- E. Merino and M. Ribagorda, Beilstein J. Org. Chem., 2012, 8, 1071 CrossRef CAS PubMed.
- J. Dokić, M. Gothe, J. Wirth, M. V. Peters, J. Schwarz, S. Hecht and P. Saalfrank, J. Phys. Chem. A, 2009, 113, 6763 CrossRef PubMed.
- Y. Norikane and N. Tamaoki, Org. Lett., 2004, 6, 2595 CrossRef CAS PubMed.
- K. Uchida, S. Yamaguchi, H. Yamada, M. Akazawa, T. Katayama, Y. Ishibashi and H. Miyasaka, Chem. Commun., 2009, 4420 RSC.
- S. Balamurugan, G. Y. Yeap, W. A. K. Mahmood, P. L. Tan and K.-Y. Cheong, J. Photochem. Photobiol., A, 2014, 278, 19 CrossRef CAS.
- X. Du, J. Zhou, J. Shi and B. Xu, Chem. Rev., 2015, 115, 13165 CrossRef CAS PubMed.
- A. M. Rosales, K. M. Mabry, E. M. Nehls and K. S. Anseth, Biomacromolecules, 2015, 16, 798 CrossRef CAS PubMed.
- Y. Matsuzawa, K. Ueki, M. Yoshida, N. Tamaoki, T. Nakamura, H. Sakai and M. Abe, Adv. Funct. Mater., 2007, 17, 1507 CrossRef CAS.
- Y. S. Dagdas, A. Tombuloglu, A. B. Tekinay, A. Dana and M. O. Guler, Soft Matter, 2011, 7, 3524 RSC.
- C. Roduit, S. Sekatski, G. Dietler, S. Catsicas, F. Lafont and S. Kasas, Biophys. J., 2009, 97, 674 CrossRef CAS PubMed.
- J. Kim, J. Lee, W. Y. Kim, H. Kim, S. Lee, H. C. Lee, Y. S. Lee, M. Seo and S. Y. Kim, Nat. Commun., 2015, 6, 6959 CrossRef CAS PubMed.
- V. Faramarzi, F. Niess, E. Moulin, M. Maaloum, J. F. Dayen, J. B. Beaufrand, S. Zanettini, B. Doudin and N. Giuseppone, Nat. Chem., 2012, 4, 485 CrossRef CAS PubMed.
- E. moulin, F. Niess, G. Fuks, N. Jouault, E. Buhier and N. Giuseppone, Nanoscale, 2012, 4, 6748 RSC.
- J. J. Armao, M. Maaloum, T. Ellis, G. Fuks, M. Rawiso, E. Moulin and N. Giuseppone, J. Am. Chem. Soc., 2014, 136, 11382 CrossRef CAS PubMed.
- I. Nyrkova, E. Moulin, J. J. Armao, M. Maaloum, B. Heinrich, M. Rawiso, F. Niess, J. J. Cid, N. Jouault, E. Buhler, A. N. Semenov and N. Giuseppone, ACS Nano, 2014, 8, 10111 CrossRef CAS PubMed.
- C. Quinton, V. Alain-Rizzo, C. Dumas-Verdes, F. Miomandre, G. Clavier and P. Audebert, RSC Adv., 2014, 4, 34332 RSC.
- X. Zhang, X. Gan, S. Yao, W. Zhu, J. Yu, Z. Wu, H. Zhou, Y. Tian and J. Wu, RSC Adv., 2016, 6, 60022 RSC.
- S. H. Gellman, G. P. Dado, G. B. Liang and B. R. Adams, J. Am. Chem. Soc., 1991, 113, 1164 CrossRef CAS.
- S. H. Jung, K. Y. Kim, A. Ahn, S. S. Lee, M. Y. Choi, J. Jaworski and J. H. Jung, New J. Chem., 2016, 40, 7917 RSC.
- W. Edwards and D. K. Smith, J. Am. Chem. Soc., 2013, 135, 5911 CrossRef CAS PubMed.
- J. H. Lee, C. Kim and J. H. Jung, Chem. Commun., 2015, 51, 15184 RSC.
- S. Tamesue, M. Ohtani, K. Yamada, Y. Ishida, J. M. Spruell, N. A. Lynd, C. J. Hawker and T. Aida, J. Am. Chem. Soc., 2013, 135, 15650 CrossRef CAS PubMed.
- E. R. Draper, B. Dietrich and D. J. Adams, Chem. Commun., 2017, 53, 1864 RSC.
- J. Ahn, S. Park, J. H. Lee, S. H. Jung, S. J. Moon and J. H. Jung, Chem. Commun., 2013, 49, 2109 RSC.
Footnotes |
| † Electronic supplementary information (ESI) available. See DOI: 10.1039/c7ra03797j |
| ‡ These authors contributed equally in this work. |
| This journal is © The Royal Society of Chemistry 2017 |