
 Open Access Article
 This Open Access Article is licensed under a
 Creative Commons Attribution 3.0 Unported Licence
LC-MS-based metabolomics reveals metabolic signatures related to glioma stem-like cell self-renewal and differentiation†
Rui Zhang‡
a,
Peishan Hu‡b,
Qingce Zanga,
Xiaofei Yuea,
Zhi Zhou a,
Xiaoyu Xua,
Jing Xua,
Shanshan Lib,
Yanhua Chena,
Boqin Qiangb,
Xiaozhong Pengb,
Wei Han*b,
Ruiping Zhang*a and
Zeper Ablizac
a,
Xiaoyu Xua,
Jing Xua,
Shanshan Lib,
Yanhua Chena,
Boqin Qiangb,
Xiaozhong Pengb,
Wei Han*b,
Ruiping Zhang*a and
Zeper Ablizac
aState Key Laboratory of Bioactive Substance and Function of Natural Medicines, Institute of Materia Medica, Chinese Academy of Medical Sciences and Peking Union Medical College, Beijing 100050, China. E-mail: rpzhang@imm.ac.cn; Fax: +86-10-63165218; Tel: +86-10-63165218
bState Key Laboratory of Medical Molecular Biology, Department of Molecular Biology and Biochemistry, Institute of Basic Medical Sciences, Biomedical Primate Research Center, Neuroscience Center Chinese Academy of Medical Sciences, School of Basic Medicine Peking Union Medical College, Beijing 100005, China. E-mail: hanweijx2002@163.com; Fax: +86-10-69156434; Tel: +86-10-69156434
cCentre for Imaging & Systems Biology, College of Life and Environmental Sciences, Minzu University of China, Beijing, China
First published on 3rd May 2017
Abstract
Gliomas are the most common and lethal primary malignant brain tumors. Recent studies implicate an important role for a rare population of glioma stem cells (GSCs) in glioma maintenance and recurrence. New therapeutic strategies are desperately needed requiring insights into the biological and molecular mechanisms underlying the self-renewal and differentiation of GSCs. We now investigate the metabolic signatures of three glioma cell lines with different stemness using a liquid chromatography-mass spectrometry (LC-MS)-based metabolomics approach. Cellular metabolites differentially expressed in U87MG stem-like cells (SLCs) relative to U87 malignant glioma cells (GCs) and U87MG stem-like cell differentiation cells (SLCDCs) were identified. The specific and significant alterations including nucleotide metabolism, glycerophospholipid metabolism, glutathione metabolism, carnitine metabolism and tryptophan metabolism were characterized. Cell function assays were further used to evaluate the self-renewal ability of SLCs treated with differential metabolites, indicating that these metabolites are involved in the maintenance of stemness. The results provide valuable information on the association of the significantly altered metabolites and metabolic pathways with SLC self-renewal and differentiation.
Introduction
Gliomas originating in glial cells are the primary tumors of the central nervous system (CNS). Although the incidence of CNS tumors is only approximately 28.57 per 100![[thin space (1/6-em)]](https://www.rsc.org/images/entities/char_2009.gif) 000 people in the United States, approximately 80% of malignant CNS tumors are malignant gliomas. They are the most common and lethal primary malignant brain tumors. For patients with glioblastoma (World Health Organization (WHO) grade-IV), the most common and severe glioma variant in adults, the median survival time is approximately 15 months even after combining chemotherapy and radiation with surgery, and only 5.1% of patients survive five years after diagnosis.1,2 Emerging experimental and clinical data strongly suggest the existence of a rare population of glioma stem cells (GSCs)3,4 that are responsible for treatment resistance and are thought to be the cause of universal recurrence after surgery.5,6 Stem cells can self-renew, proliferate unlimitedly, differentiate into other glioma cells and play a key role in tumor initiation, progression and recurrence.7–9 Therefore, a novel therapeutic strategy that directly targets and eradicates GSCs has been proposed. However, the regulation mechanism of self-renewal and differentiation of GSCs are not fully understood.
000 people in the United States, approximately 80% of malignant CNS tumors are malignant gliomas. They are the most common and lethal primary malignant brain tumors. For patients with glioblastoma (World Health Organization (WHO) grade-IV), the most common and severe glioma variant in adults, the median survival time is approximately 15 months even after combining chemotherapy and radiation with surgery, and only 5.1% of patients survive five years after diagnosis.1,2 Emerging experimental and clinical data strongly suggest the existence of a rare population of glioma stem cells (GSCs)3,4 that are responsible for treatment resistance and are thought to be the cause of universal recurrence after surgery.5,6 Stem cells can self-renew, proliferate unlimitedly, differentiate into other glioma cells and play a key role in tumor initiation, progression and recurrence.7–9 Therefore, a novel therapeutic strategy that directly targets and eradicates GSCs has been proposed. However, the regulation mechanism of self-renewal and differentiation of GSCs are not fully understood.
Metabolomics allows the simultaneous determination of many small molecule metabolites in a given physiological or pathological situation. Therefore it represents a highly sensitive and comprehensive tool for studying the events associated with a cellular or biological system. Subtle alterations in the expression level of a gene or protein can result in significant changes in the “downstream” products (i.e. metabolites) level.10,11 Metabolomics approach has been increasingly applied to biomarker discovery, mechanistic elucidation as well as new therapeutic strategy developing.12 Cell models had the advantages of low cost, high reproducibility and possibility of a human origin. The combination of metabolomics and cell models has already been applied to the investigation on metabolic differences of various gliomas cell lines,13 staging of gliomas,14,15 microenvironment16 and drug-induced effects.17–20 In fact, very few studies have actually benefitted from cell metabolomics to investigate self-renewal and differentiation in cancer stem cells (CSCs), particularly in GSCs.
In the present study, the metabolic signatures of three glioma cell lines, U87 malignant glioma cells (GCs), U87MG stem-like cells (SLCs) and U87MG stem-like cell differentiation cells (SLCDCs) were systematically studied using an LC-MS-based cell metabolomics approach in conjunction with multivariate data analysis (MVDA). Untargeted global profiling followed by targeted metabolomics was applied to obtain a comprehensive view of the interconnected differential metabolites as well as the selected biochemical pathways of interest. By comparing the metabolic signatures of GCs and SLCs, we were able to identify the specific metabolite and pathway alterations associated with SLC self-renewal, while those associated with SLC differentiation were determined by comparing SLC and SLCDC metabolic signatures. Sphere formation assays, limiting dilution assays and Western blotting were further used to evaluate the influence of relevant metabolites on the self-renewal ability of SLCs. A flowchart of the strategy used in this study is shown in Fig. S1.†
Experimental
Chemicals and reagents
All standard samples and isotope internal standards used in the metabolomic analysis, including choline, L-leucine, L-proline, valine, trans-cinnamic acid, creatine, hypoxanthine, spermidine, methionine sulfoxide, guanine, L-carnitine, 2-hydroxycinnamic acid, phenylalanine, L-tyrosine, acetylcarnitine, L-tryptophan, kynurenine, pantothenic acid, L-formylkynurenine, N1-acetylspermine, D-glucose 6-phosphate, guanosine, xanthosine, 5′-methylthioadenosine, glutathione, UMP, GMP, ADP, LPE (18:1), LPC (15:0), oxidized glutathione, nicotinamide adenine dinucleotide (NAD), pyrrolidonecarboxylic acid, indoleacrylic acid, IMP, UDP-glucose, N-acetyl-D-glucosamine, L-tryptophan-(indole-d5), L-tyrosine-(phenyl-3,5-d2), 7-methylxanthine-2,4,5,6-13C4,1,3,9-15N3, androstene-3,17-dione-2,3,4-13C3 and succinic acid-2,2,3,3-d4 were purchased from Sigma-Aldrich (St. Louis, MO, USA). HPLC-grade methanol, acetonitrile, and formic acid were purchased from Merck (Darmstadt, Germany). Pure water was obtained from the Wahaha Group Co., Ltd. (Hangzhou, China).
Cell lines and cell culture
The human glioma cell line U87MG was purchased from the American Type Culture Collection (ATCC, Manassas, VA, USA). GCs were maintained in Modified Eagle Medium containing 1 mM sodium pyruvate, 1% NEAA, 10% fetal bovine serum (FBS, HyClone), 2 mM L-glutamine and 1% penicillin/streptomycin. SLCs were cultured in Neurobasal Medium (Gibco) supplemented with 2% B27 (without vitamin A, Gibco), 10 μg mL−1 heparin (Sigma), 20 ng mL−1 basic fibroblast growth factor (bFGF, Peprotech) and 20 ng mL−1 epidermal growth factor (EGF, Peprotech). To induce differentiation, 10% FBS was added and bFGF and EGF were removed from the final SLC culture medium. All cells were cultured according to the guidelines recommended by the ATCC and were maintained at 37 °C in a humidified atmosphere containing 5% CO2-95% air.Sample preparation
Intracellular metabolite extraction was primarily performed according to a previously reported method.21 (1) Cells (5 × 10⁶) were quickly washed twice with phosphate-buffered saline (PBS) (37 °C) to remove residual enzymes and medium before cell lysis. (2) The cells were then quenched and extracted by directly adding 0.5 mL of −80 °C 100% methanol, and the solution was then transferred to a microcentrifuge tube (Tube 1) and snap-frozen in liquid nitrogen. (3) The cells were thawed, vortexed for 60 s (2500 rpm), and centrifuged for 5 min at 1100 rpm, and the supernatant was then transferred to a fresh microcentrifuge tube (Tube 2) on dry ice. (4) The cell pellet was resuspended in 0.5 mL of −80 °C 100% methanol, the previous freeze–thaw cycle was repeated, and the supernatants were combined in Tube 2. (5) The cell pellet (Tube 1) was resuspended in 0.25 mL of ice-cold Milli-Q water, the previous freeze–thaw cycle was repeated, the cells were centrifuged for 5 min at 12000 rpm, and the supernatants were combined in Tube 2. (6) Tube 2 was centrifuged at 12000 rpm for 5 min, and the supernatant was transferred to a fresh tube (Tube 3). (7) The supernatant in Tube 3 was dried using a centrifugal evaporator at 30 °C. (8) The samples were resuspended in 100 μL of 80% aqueous methanol and centrifuged at 12000 rpm for 5 min, and the supernatants were then transferred to autosampler vials and used for LC-MS analysis. A quality control (QC) sample was prepared by pooling and mixing the same volume of each cell sample.
Global metabolomics analysis by LC-MS
The intracellular metabolite extracts were analyzed on a Dionex UHPLC Ultimate 3000 system (Thermo Scientific, Dionex, Sunnyvale, California, USA), coupled to a Q-Exactive mass spectrometer with a heated electrospray ionization (HESI) source and controlled by the Xcalibur 2.3 software program (Thermo Fisher Scientific, Waltham, MA, USA). Chromatographic separation was performed on a Waters ACQUITY UPLC CSH C18 column (2.1 mm × 100 mm, 1.7 μm), and the column temperature was maintained at 30 °C. The mobile phase consisted of 0.1% formic acid (A) and acetonitrile (B) at a flow rate of 0.25 mL min−1. The gradient conditions were as follows: 0 min, 2% B; 9 min, 60% B; 18 min, 60% B; 20 min, 100% B; and 30 min, 100% B. The injection volume was 10 μL and the autosampler temperature was set at 4 °C.The mass spectrometric settings for positive/negative ionization modes were as follows: spray voltage, 3.5/−3.2 kV; sheath gas flow rate, 40/45 arbitrary units (arb); aux gas flow rate, 11/10 arb; aux gas heater temperature, 220 °C; capillary temperature, 350 °C; isolation width, 1 m/z. The full scan range was 67–1000 m/z with a resolution of 70000, and the automatic gain control (AGC) target for MS acquisitions was set to 3 × 10⁶ with a maximum ion injection time of 50 ms. Subsequent MS2 scans with a target value of 2 × 10⁵ ions were collected with a maximum ion injection time of 200 ms and resolution of 35000. The normalized collision energy was set to 35/20, and the stepped normalized collision energy (NCE) was set to 50%. High-purity nitrogen (N2) was used as the nebulizing gas and the collision gas for higher energy collisional dissociation. The samples were randomly injected independent of cell type to eliminate systematic bias. A solvent blank and a QC sample were analyzed after every 10 samples to evaluate the sample carryover and check for stability.
The acquired LC-MS raw data files were converted to the mzXML profile format by MM File Conversion 3.9 exe (http://mm-file-conversion.software.informer.com/3.9/). The mzXML data were processed with the bioinformatics program XCMS (http://masspec.scripps.edu/xcms/xcms.php)22 in R project 3.2.0 (http://www.R-project.org), including peak finding, filtering, alignment, matching, and identification. A data matrix consisting of the retention time, m/z value and peak area was obtained. Each peak area was normalized to the total peak area of each chromatogram, and then the normalized preprocessed data sets were imported into the SIMCA-P 14.0 software package (Umetrics AB, Umeå, Sweden) for MVDA including principal component analysis (PCA), orthogonal partial least-squares discriminant analysis (OPLS-DA) and permutation tests. The data were mean-scaled and pareto-scaled to reduce instrumental and chemical noise before MVDA. An unsupervised PCA was used to observe the natural cluster trend of the three cell types and the QC sample. A permutation test using 999 random iterations was used to test the model validity against overfitting. OPLS-DA was applied to explore differences in each comparison of two cell types. Variables with a VIP (variable importance in the projection) value ≥2.0 were considered to be differential variables. Subsequently, other statistical analyses, such as s-plot, jack-knifed-based confidence intervals, independent t-test, ParCorA, R-package camera and extracted ion chromatograms, were used to further filter out more reliable differential variables.
Targeted metabolomics analysis by LC-MS/MS
Another 90 cell samples (30 for each cell type) were used for targeted analysis. All differential variables obtained from each comparison of two groups were combined together for further validation analysis. L-Tyrosine-(phenyl-3,5-d2), 7-methylxanthine-2,4,5,6-13C4,1,3,9-15N3, androstene-3,17-dione-2,3,4-13C3, and succinic acid-2,2,3,3-d4 were chosen as the internal standards to monitor the stability of the analysis.The ACQUITY UPLC system (Waters, Milford, MA, USA) equipped with a binary solvent delivery system and an autosampler was used for the separation on a Synergi Hydro-RP column (4.6 mm × 250 mm, 4 μm) (Phenomenex, Torrance, CA, USA), and the column temperature was maintained at 25 °C. The mobile phase was 0.1% formic acid (A) and MeOH (B), at a flow rate of 0.25 mL min−1 for both positive and negative ionization modes. In positive ion mode, the following elution gradient was used: 0 min, 2% B; 7 min, 20% B; 8 min, 70% B; 18 min, 100% B; and 23 min, 100% B. This gradient was followed by a return to the initial conditions, which were maintained for 5 min to re-equilibrate the column. In negative ion mode, the following elution gradient was used: 0 min, 2% B; 7 min, 20% B; 10 min, 100% B; and 15 min, 100% B. The total run time was shortened to 20 min, including the 5 min equilibration.
The mass spectrometric data were collected using a QTRAP 5500 mass spectrometer (AB SCIEX, Foster City, CA, USA) equipped with an electrospray ionization (ESI) source. The MS/MS detection was performed using multiple reaction monitoring (MRM) in both positive and negative ion modes. The declustering potentials (DPs), collision energies (CEs) and suitable product ions for each variable were optimized to obtain the best signals. The measurement conditions were as follows: ESI source voltage, 5.5 kV or −4.5 kV; nebulizer gas (Gas1), 70 psi; turbo gas (Gas2), 60 psi; and curtain gas (CUR), 30 psi. The collision-activated dissociation (CAD) gas level was set at medium, the dwell time was 10 ms, and the source temperature (TEM) was 450 °C.
The peak areas for each metabolite were integrated using MultiQuant version 3.0.2 software (AB/SCIEX). An independent validation test based on the LC-MS/MS targeted metabolomics analysis was performed to screen more reliable variables (p < 0.05).
Metabolites were identified by database searching against their accurate masses in publicly accessible databases, including the HMDB (http://www.hmdb.ca/), MassBank (http://www.massbank.jp/) and Metlin (http://metlin.scripps.edu/).23 The fragmentation patterns and retention time information were then adapted to narrow the scope of the target compounds. Finally, available commercial standards were used to verify the potential structures.
Metabolic pathway analysis
The biological functions and affected metabolic pathways of the identified differential metabolites were analyzed using KEGG (http://www.kegg.com/), PubMed (http://www.ncbi.nlm.nih.gov/) and MetaboAnalyst 3.0 (ref. 24) (http://www.MetaboAnalyst.ca/) based on the Homo sapiens (human) pathway library.SLC self-renewal ability assay
The self-renewal ability of SLCs exposed to differentially expressed metabolites (p < 0.05, fold change > 2) was evaluated by a sphere formation assay, limiting dilution assay and Western blotting. Cell spheres were dissociated and seeded into six-well plates, and metabolites were then added to the SLC culture medium, including xanthosine (600 ng mL−1), ADP (60 ng mL−1), tryptophan (75 μg mL−1), kynurenine (400 ng mL−1), L-formylkynurenine (1200 ng mL−1), NAD (80 μg mL−1), glutathione (12 μg mL−1), and GMP (300 ng mL−1). The cells were supplemented with fresh medium. In the control group, the cells were cultured normally without adding metabolites. For the sphere formation assay, after 5 days, the spheres with a diameter larger than 50 μm were counted in each well under an inverted microscope. Phase-contrast photomicrographs of SLCs were also taken. The limiting dilution assay was performed as described previously.25 After 12 days, the percentage of wells that did not contain spheres (diameter ≥ 50 μm) for each cell plating density was calculated.Western blotting was performed as described previously.26 According to standard procedures, cells were lysed in TNTE buffer in the presence of 4 protease inhibitors. Subsequently, the lysates were subjected to SDS-PAGE, and the proteins were separated under denaturing conditions. A semi-dry gel transfer device was then used to transfer the proteins to nitrocellulose membranes. Finally, an ECL reagent was used to detect the bound antibodies. The following antibodies were used: anti-NESTIN (1:2500, Millipore), anti-CD133 (1:200, Miltenyi), anti-OCT4 (1:500, Abcam) and anti-SOX2 (1:500, Abcam). β-Actin (1:500, Peprotech) was used as an internal control.
Results and discussion
Metabolic profiling
Metabolomics studies typically take a relatively long time from sample preparation to the completion of the LC-MS data acquisition. Therefore, the QC samples were adapted to monitor and evaluate the stability of the analysis. In total, fifty-four cell extracts (18 parallel biological samples for each cell type) and eleven QCs were analyzed. The total ion chromatograms (TICs) of different cell samples are shown in ESI Fig. S2.† The PCA scatter plots (95% confidence interval), peak area deviations of QCs (<2 SD), and majority retention time deviation profiles (R-software) of all samples (<10 s for ESI+, <20 s for ESI−) indicated that the data were stable and reproducible throughout the analysis and that any differences were derived from the samples themselves instead of technical errors (Fig. S3–S5†). A total of 9758 and 7701 features were detected in the positive and negative ion modes, respectively. The data sets were then imported into SIMCA-P for MVDA. A PCA was initially performed on the LC-MS data sets to obtain the natural clustering trend for the three types of glioma cells. As shown in (Fig. 1A and B), apparent clustering and separation were observed among the cell lines in both ion modes.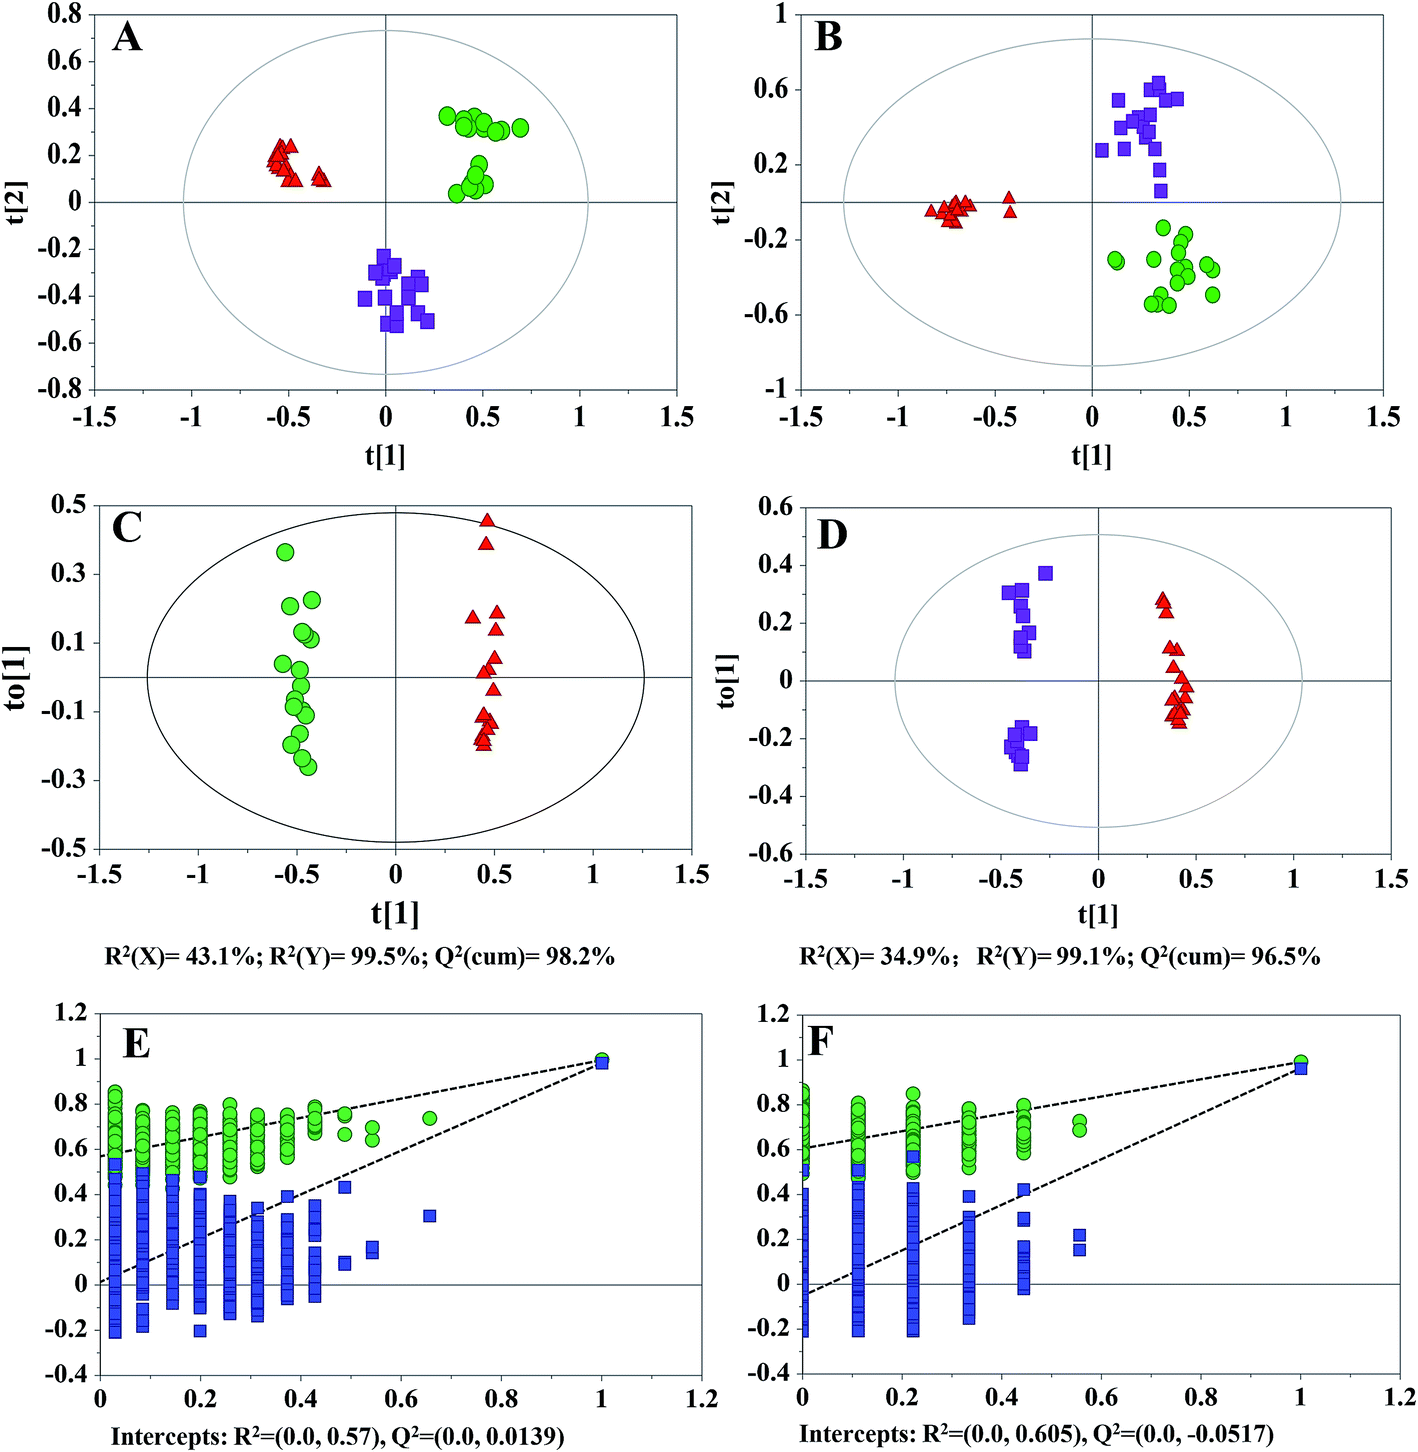 | ||
| Fig. 1 Multivariate data analysis for three types of glioma cells. PCA score plots based on the LC-(+) ESI-MS (A) and LC-(−) ESI-MS (B) data sets, OPLS-DA score plots (C and D) and plots of the permutation tests of the PLS-DA models (E and F) based on the LC-(+) ESI-MS data sets. GCs vs. SLCs (C and E), SLCDCs vs. SLCs (D and F), (green ●) GCs, (red ▲) SLCs, (purple ■) SLCDCs. | ||
To further investigate the differences observed in each comparison of two cell lines and to identify more reliable differential variables, OPLS-DA was subsequently applied. The OPLS-DA score plots of the LC-(+) ESI-MS data showed a marked discrimination of metabolic phenotypes when comparing GCs vs. SLCs and SLCs vs. SLCDCs (Fig. 1C and D). The quality of the models was first described by R2(Y) and Q2(cum) values. For the GC vs. SLC model, R2(Y) = 99.5% and Q2(cum) = 98.2%; for the SLC vs. SLCDC model, R2(Y) = 99.1% and Q2(cum) = 96.5%. Similarly, the OPLS-DA model of the LC-(−) ESI-MS data are shown in ESI (Fig. S6A and B†). For the GC vs. SLC model, R2(Y) = 98.7% and Q2(cum) = 96.7%; for the SLC vs. SLCDC model, R2(Y) = 98.7%, Q2(cum) = 97.7%. The R2(Y) and Q2(cum) values were close to the optimal value of 1, indicating that all models had a good fitness and predictive ability of all models. To prevent model overfitting, permutation tests were further performed. Through 999 random permutations, the intercepts of R2 and Q2 for the positive ion mode data (Fig. 1E and F) and negative ion mode data (Fig. S6C and D†) indicated that the corresponding OPLS-DA models could reliably explain and predict the observed variations. Based on the OPLS-DA results, metabolites that were statistically significantly different in each comparison of two groups were filter out according to a threshold of VIP values (VIP > 2), an independent t-test (p < 0.05) and an intensity fold-change of at least 1.2 (up or down).
To further validate the reliability of the screened metabolites, independent validation tests based on an LC-MS/MS targeted metabolomics analysis were performed. The typical XICs of the LC-MS/MS MRM analysis are shown in Fig. S7.† An independent t-test was performed in succession, and variables without significant differences between the groups (p > 0.05) were eliminated. Finally, 102 variables from the positive ion mode data and 66 variables from the negative ion mode data were obtained from the comparison of GCs and SLCs, while 119 variables from the positive ion mode data and 51 variables from the negative ion mode data were obtained from the comparison of SLCs and SLCDCs.
Differential metabolites
Differential metabolites were identified based on our previously described strategy.27,28 As a result, 55 differential metabolites were identified from the three types of glioma cells (Table 1), including thirteen amino acids and derivatives, eight carboxylic acids and derivatives, nine carnitines, eight glycerophospholipids, ten nucleosides, five hydrocarbon derivatives, and two purines and purine derivatives. Of all these, thirty-seven metabolites were confirmed using standard compounds. The detailed information of the identified differential metabolites is shown in ESI Tables S1 and S2.†| No. | Metabolite | m/z value | Chemical formula | GC/SLC | SLCDC/SLC | ||||
|---|---|---|---|---|---|---|---|---|---|
| VIP | P | FC | VIP | P | FC | ||||
| a All metabolites were identified through database matching. Those marked with “a” were validated by authentic standards, those in italic type were identified in negative ion mode, while the others were identified in positive ion mode. The superscript 1,2 represent differential metabolites identified between GC/SLC and SLCDC/SLC, respectively. VIP was obtained from the OPLS-DA model. The P value was calculated by Student's t-test. FC (fold change) was obtained from the ratio of average mass response (normalized peak area) among the three types of cells (where a value >1 means that the average mass response of the metabolite in the first cell type is larger than that in the second type). | |||||||||
| 1 | Kynureninea,2 | 208.0848 | C10H12N2O3 | 3.39 | <0.001 | 58.84 | |||
| 2 | L-Formylkynureninea,2 | 236.07971 | C11H12N2O4 | 2.34 | 0.0097 | 24.55 | |||
| 3 | Stearoylcarnitine2 | 428.3734 | C25H49NO4 | 2.44 | <0.001 | 15.53 | |||
| 4 | Propionylcarnitine2 | 217.1314 | C10H19NO4 | 3.42 | 0.0049 | 13.95 | |||
| 5 | Gamma-Glu–Leu2 | 260.13722 | C11H20N2O5 | 2.89 | <0.001 | 7.85 | |||
| 6 | Acetylcarnitinea,2 | 203.11576 | C9H17NO4 | 2.18 | 0.0018 | 6.97 | |||
| 7 | L-Carnitinea,2 | 161.10519 | C7H15NO3 | 3.98 | <0.001 | 6.41 | |||
| 8 | Tetradecanoylcarnitine2 | 371.3036 | C21H41NO4 | 2.09 | 0.0044 | 5.02 | |||
| 9 | NADa,2 | 663.1091 | C21H27N7O14P2 | 2.84 | <0.001 | 3.71 | |||
| 10 | LPC (18:0)2 |
523.36379 | C26H54NO7P | 7.53 | <0.001 | 3.36 | |||
| 11 | Pantothenic acida,2 | 219.1107 | C9H17NO5 | 6.49 | 0.0179 | 2.9 | |||
| 12 | LPE (18:0)2 |
481.31684 | C23H48NO7P | 4.21 | 0.0016 | 2.04 | |||
| 13 | Glutathionea,2 | 307.08381 | C10H17N3O6S | 5.43 | <0.001 | 1.92 | |||
| 14 | Hypoxanthinea,2 | 136.03851 | C5H4N4O | 2.6 | 0.0331 | 0.68 | |||
| 15 | Xanthosinea,1 | 284.07568 | C10H12N4O6 | 3.2 | <0.001 | 37.38 | |||
| 16 | XMP1 | 364.04201 | C10H13N4O9P | 3.39 | <0.001 | 33.98 | |||
| 17 | LPC (15:0)a,1 |
481.31684 | C23H48NO7P | 2.95 | <0.001 | 21.13 | |||
| 18 | Oxidized glutathionea,1 | 612.15196 | C20H32N6O12S2 | 2.99 | <0.001 | 14.65 | |||
| 19 | trans-2-Hexadecenoyl-carnitine1 | 397.31921 | C23H43NO4 | 2.5 | <0.001 | 9.51 | |||
| 20 | Spermidinea,1 | 145.1579 | C7H19N3 | 6.71 | 0.0019 | 3.97 | |||
| 21 | ADPa,1 | 427.02941 | C10H15N5O10P2 | 5.5 | 0.0394 | 3.83 | |||
| 22 | N-Oleoylethanolamine1 | 325.29808 | C20H39NO2 | 2.11 | <0.001 | 3.79 | |||
| 23 | LPC (14:0)1 |
467.30119 | C22H46NO7P | 4.04 | 0.0158 | 2.9 | |||
| 24 | trans-Cinnamic acida,1 | 148.05243 | C9H8O2 | 2.04 | <0.001 | 2.44 | |||
| 25 | LPC (20:1)1 |
549.37944 | C28H56NO7P | 2.53 | <0.001 | 2.16 | |||
| 26 | L-Prolinea,1 | 115.0633 | C5H9NO2 | 3.35 | <0.001 | 1.28 | |||
| 27 | Valinea,1 | 117.079 | C5H11NO2 | 2.96 | <0.001 | 0.8 | |||
| 28 | 2-Hydroxycinnamic acida,1 | 164.0473 | C9H8O3 | 2.2 | <0.001 | 0.64 | |||
| 29 | L-Leucinea,1 | 131.0946 | C6H13NO2 | 6.57 | <0.001 | 0.59 | |||
| 30 | IMPa,1 | 348.0471 | C10H13N4O8P | 3.59 | <0.001 | 0.29 | |||
| 31 | D-Glucose 6-phosphatea,1 | 260.02972 | C6H13O9P | 2.41 | <0.001 | 0.12 | |||
| 32 | LPC (22:6)1,2 |
567.33249 | C30H50NO7P | 2.54 | <0.001 | 35.53 | 2.08 | <0.001 | 15.24 |
| 33 | Pentanoylcarnitine1,2 | 245.16271 | C12H23NO4 | 3.94 | <0.001 | 20.07 | 4.15 | 0.0026 | 16.47 |
| 34 | L-Palmitoylcarnitine1,2 | 399.33486 | C23H45NO4 | 4.18 | <0.001 | 13.59 | 3.63 | <0.001 | 7.25 |
| 35 | Oleoylcarnitine1,2 | 425.35051 | C25H47NO4 | 5.3 | <0.001 | 12.35 | 2.99 | 0.0017 | 3.53 |
| 36 | Guanosinea,1,2 | 283.09167 | C10H13N5O5 | 3.52 | <0.001 | 11.09 | 2.67 | <0.001 | 4.4 |
| 37 | Methionine sulfoxidea,1,2 | 165.04596 | C5H11NO3S | 5.62 | <0.001 | 10.64 | 2.9 | <0.001 | 3.76 |
| 38 | Guaninea,1,2 | 151.0494 | C5H5N5O | 3.87 | <0.001 | 9.5 | 3.09 | 0.0389 | 4.1 |
| 39 | Pyrrolidonecarboxylic acida,1,2 | 129.04259 | C5H7NO3 | 4.93 | <0.001 | 7.25 | 3.96 | 0.0014 | 4.41 |
| 40 | Creatinea,1,2 | 131.0695 | C4H9N3O2 | 7.76 | <0.001 | 6.74 | 5.57 | 0.0017 | 3.53 |
| 41 | GMPa,1,2 | 363.058 | C10H14N5O8P | 5.29 | <0.001 | 6.73 | 2.67 | <0.001 | 2.4 |
| 42 | UMPa,1,2 | 324.0359 | C9H13N2O9P | 4.21 | <0.001 | 5.26 | 2.06 | 0.0063 | 6.31 |
| 43 | N-Acetyl-D-glucosaminea,1,2 | 221.0899 | C8H15NO6 | 5.65 | <0.001 | 5.18 | 13.34 | <0.001 | 16.15 |
| 44 | Cholinea,1,2 | 104.1075 | C5H13NO | 10.31 | <0.001 | 4.14 | 5.01 | 0.0466 | 1.61 |
| 45 | L-Tryptophana,1,2 | 204.08988 | C11H12N2O2 | 7.36 | <0.001 | 3.29 | 6.39 | <0.001 | 2.21 |
| 46 | Indoleacrylic acida,1,2 | 187.0633 | C11H9NO2 | 8.44 | <0.001 | 3.2 | 7.47 | <0.001 | 2.23 |
| 47 | Glycerophosphocholine1,2 | 257.10282 | C8H20NO6P | 3.34 | <0.001 | 2.78 | 3.77 | <0.001 | 2.99 |
| 48 | 5′-Methylthioadenosinea,1,2 | 297.08956 | C11H15N5O3S | 6.58 | <0.001 | 2.63 | 5.38 | <0.001 | 1.79 |
| 49 | Phenylalaninea,1,2 | 165.07898 | C9H11NO2 | 15.7 | <0.001 | 2.34 | 15.99 | 0.0029 | 1.97 |
| 50 | UDP-N-acetyl-glucosamine1,2 | 607.08157 | C17H27N3O17P2 | 16.36 | <0.001 | 2.15 | 29.66 | <0.001 | 4.43 |
| 51 | Pantothenic acida,1,2 | 219.11067 | C9H17NO5 | 3.4 | <0.001 | 1.63 | 9.79 | <0.001 | 3.92 |
| 52 | LPE (18:1)a,1,2 |
479.3012 | C23H46NO7P | 4.7 | 0.0144 | 1.63 | 2.36 | <0.001 | 0.59 |
| 53 | UDP-glucosea,1,2 | 566.05502 | C15H24N2O17P2 | 2.62 | <0.001 | 0.47 | 2.67 | <0.001 | 1.73 |
| 54 | L-Tyrosinea,1,2 | 181.07389 | C9H11NO3 | 3.33 | <0.001 | 0.38 | 2.59 | 0.0408 | 0.66 |
| 55 | N1-Acetylsperminea,1,2 | 244.22631 | C12H28N4O | 3.19 | <0.001 | 0.03 | 2.46 | 0.0019 | 2.83 |
| 56 | N1-Acetylspermidine1,2 | 187.1685 | C9H21N3O | 13.89 | <0.001 | 0.02 | 10.24 | <0.001 | 0.57 |
Seventeen significantly changed differential metabolites were uniquely observed in the comparison of GCs and SLCs. This comparison identified increases in the levels of some nucleosides (xanthosine, XMP) and glycerophospholipids (LPC (15:0), LPC (14:0), LPC (20:1)) as well as in the levels of oxidized glutathione, while it also identified nucleosides with decreased levels (IMP, D-glucose 6-phosphate). Fourteen significantly changed differential metabolites were uniquely observed in the comparison of SLCDCs and SLCs, including increased amino acids (kynurenine, L-formylkynurenine) and carnitines (stearoylcarnitine, propionylcarnitine, acetylcarnitine, L-carnitine, tetradecanoylcarnitine), while only hypoxanthine was decreased. Additionally, twenty-five overlapping metabolites contributed to the distinctions among the three cell types. These metabolites not only reflect alterations in the metabolic phenotype but could also improve the understanding of the mechanisms involved in the self-renewal and differentiation of glioma stem-like cells.
A hierarchical cluster analysis of the metabolites in the investigated cell lines is shown in Fig. 2, depicting the changes of these metabolites in GCs and SLCDCs compared with SLCs. Shades of green and red represent a decreased or increased fold change, respectively, of a metabolite in GCs or SLCDCs relative to SLCs. Significant hierarchical clustering groups were observed among the cells.
 | ||
| Fig. 2 Hierarchical cluster analysis of identified differential metabolites in GC, SLC and SLCDC glioma cell lines. The metabolites were clustered, and shades of green and red represent down-regulation or up-regulation, respectively, of a metabolite in GCs and SLCDCs compared to SLCs (the row on the right lists the metabolites, and the column on the top indicates the cell lines; green: GCs, red: SLCs, purple: SLCDCs). | ||
Alterations in metabolic pathways
The metabolite profiles of GCs and SLCDCs were compared to that of SLCs, and both exhibited ten times higher levels of seven metabolites. The levels of guanosine, oxidized glutathione, pentanoylcarnitine, LPC (15:0), XMP, LPC (22:6) and xanthosine were higher in GCs than in SLCs, while the levels of propionylcarnitine, LPC (22:6), stearoylcarnitine, N-acetyl-D-glucosamine, pentanoylcarnitine, L-formylkynurenine and kynurenine were higher in SLCDCs than in SLCs (all marked in red, Fig. 3A and B). The differences in the overlapping metabolites among the three cell types are depicted in ESI Fig. S8.†
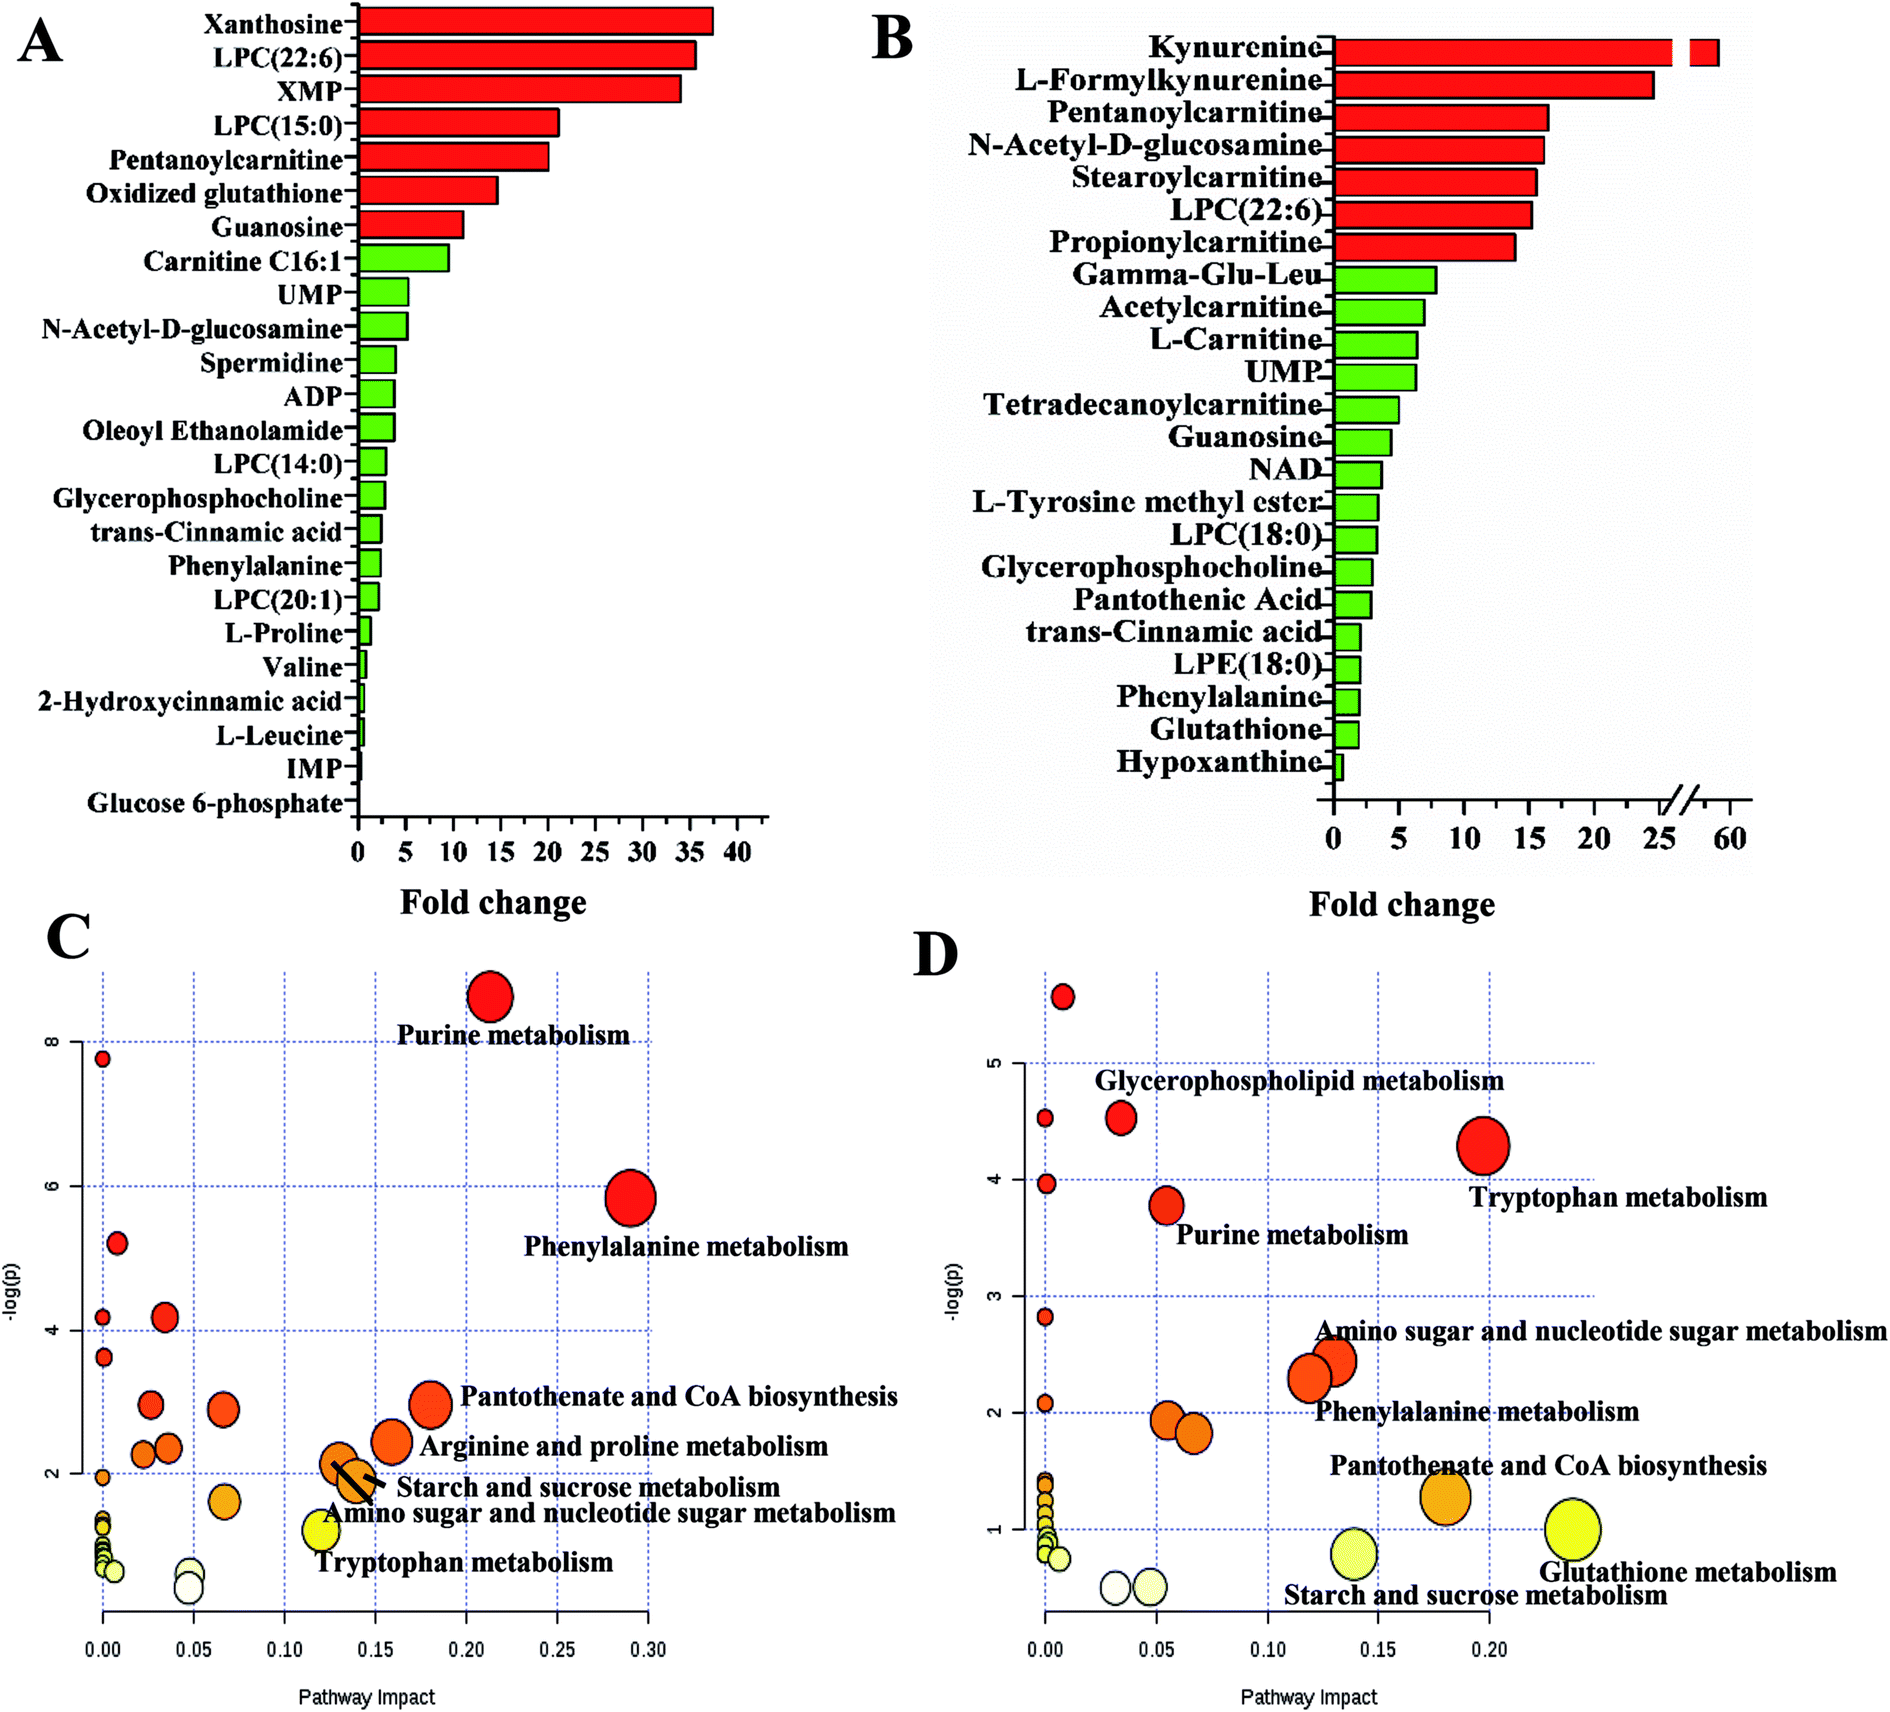 | ||
| Fig. 3 Profiles of significantly altered metabolites and pathways in GCs vs. SLCs (A and C) and SLCDCs vs. SLCs (B and D). | ||
Based on an analysis using KEGG, PubMed and MetaboAnalyst 3.0, several key metabolic pathways that were altered in the three types of glioma cells are shown in Fig. 3C and D. The impact-value threshold calculated from the pathway topology analysis was set to 0.10. Seven pathways significantly perturbed between SLCs and GCs were identified as potential self-renewal pathways of glioma stem-like cells, including purine metabolism, phenylalanine metabolism, pantothenate and CoA biosynthesis, arginine and proline metabolism, starch and sucrose metabolism, amino sugar and nucleotide sugar metabolism and tryptophan metabolism. Six pathways altered between SLCDCs and SLCs were identified as potentially related to the differentiation of glioma stem-like cells, including tryptophan metabolism, phenylalanine metabolism, glutathione metabolism, pantothenate and CoA biosynthesis, starch and sucrose metabolism and amino sugar and nucleotide sugar metabolism.
Biological validation
The self-renewal ability of SLCs exposed to differential metabolites xanthosine, ADP, tryptophan, kynurenine, L-formylkynurenine NAD, GSSG and GMP (p < 0.05, fold change > 2) was evaluated by a sphere formation assay, limiting dilution assay and Western blotting. In the sphere formation assay, xanthosine and kynurenine markedly inhibited the neurosphere formation ability of SLCs (Fig. 4A). Similar results were observed with other metabolites and are shown in ESI Fig. S10.† The results of the limiting dilution assay are shown in (Fig. 4B) and ESI Fig. S11,† demonstrating that the addition of 8 differentially expressed metabolites repressed SLC self-renewal. Western blot analyses showed that these metabolites down-regulated stemness markers such as NESTIN, CD133, OCT4 and SOX2 in SLCs (Fig. 4C), which indicated that these metabolites contributed to the self-renewal process in SLCs.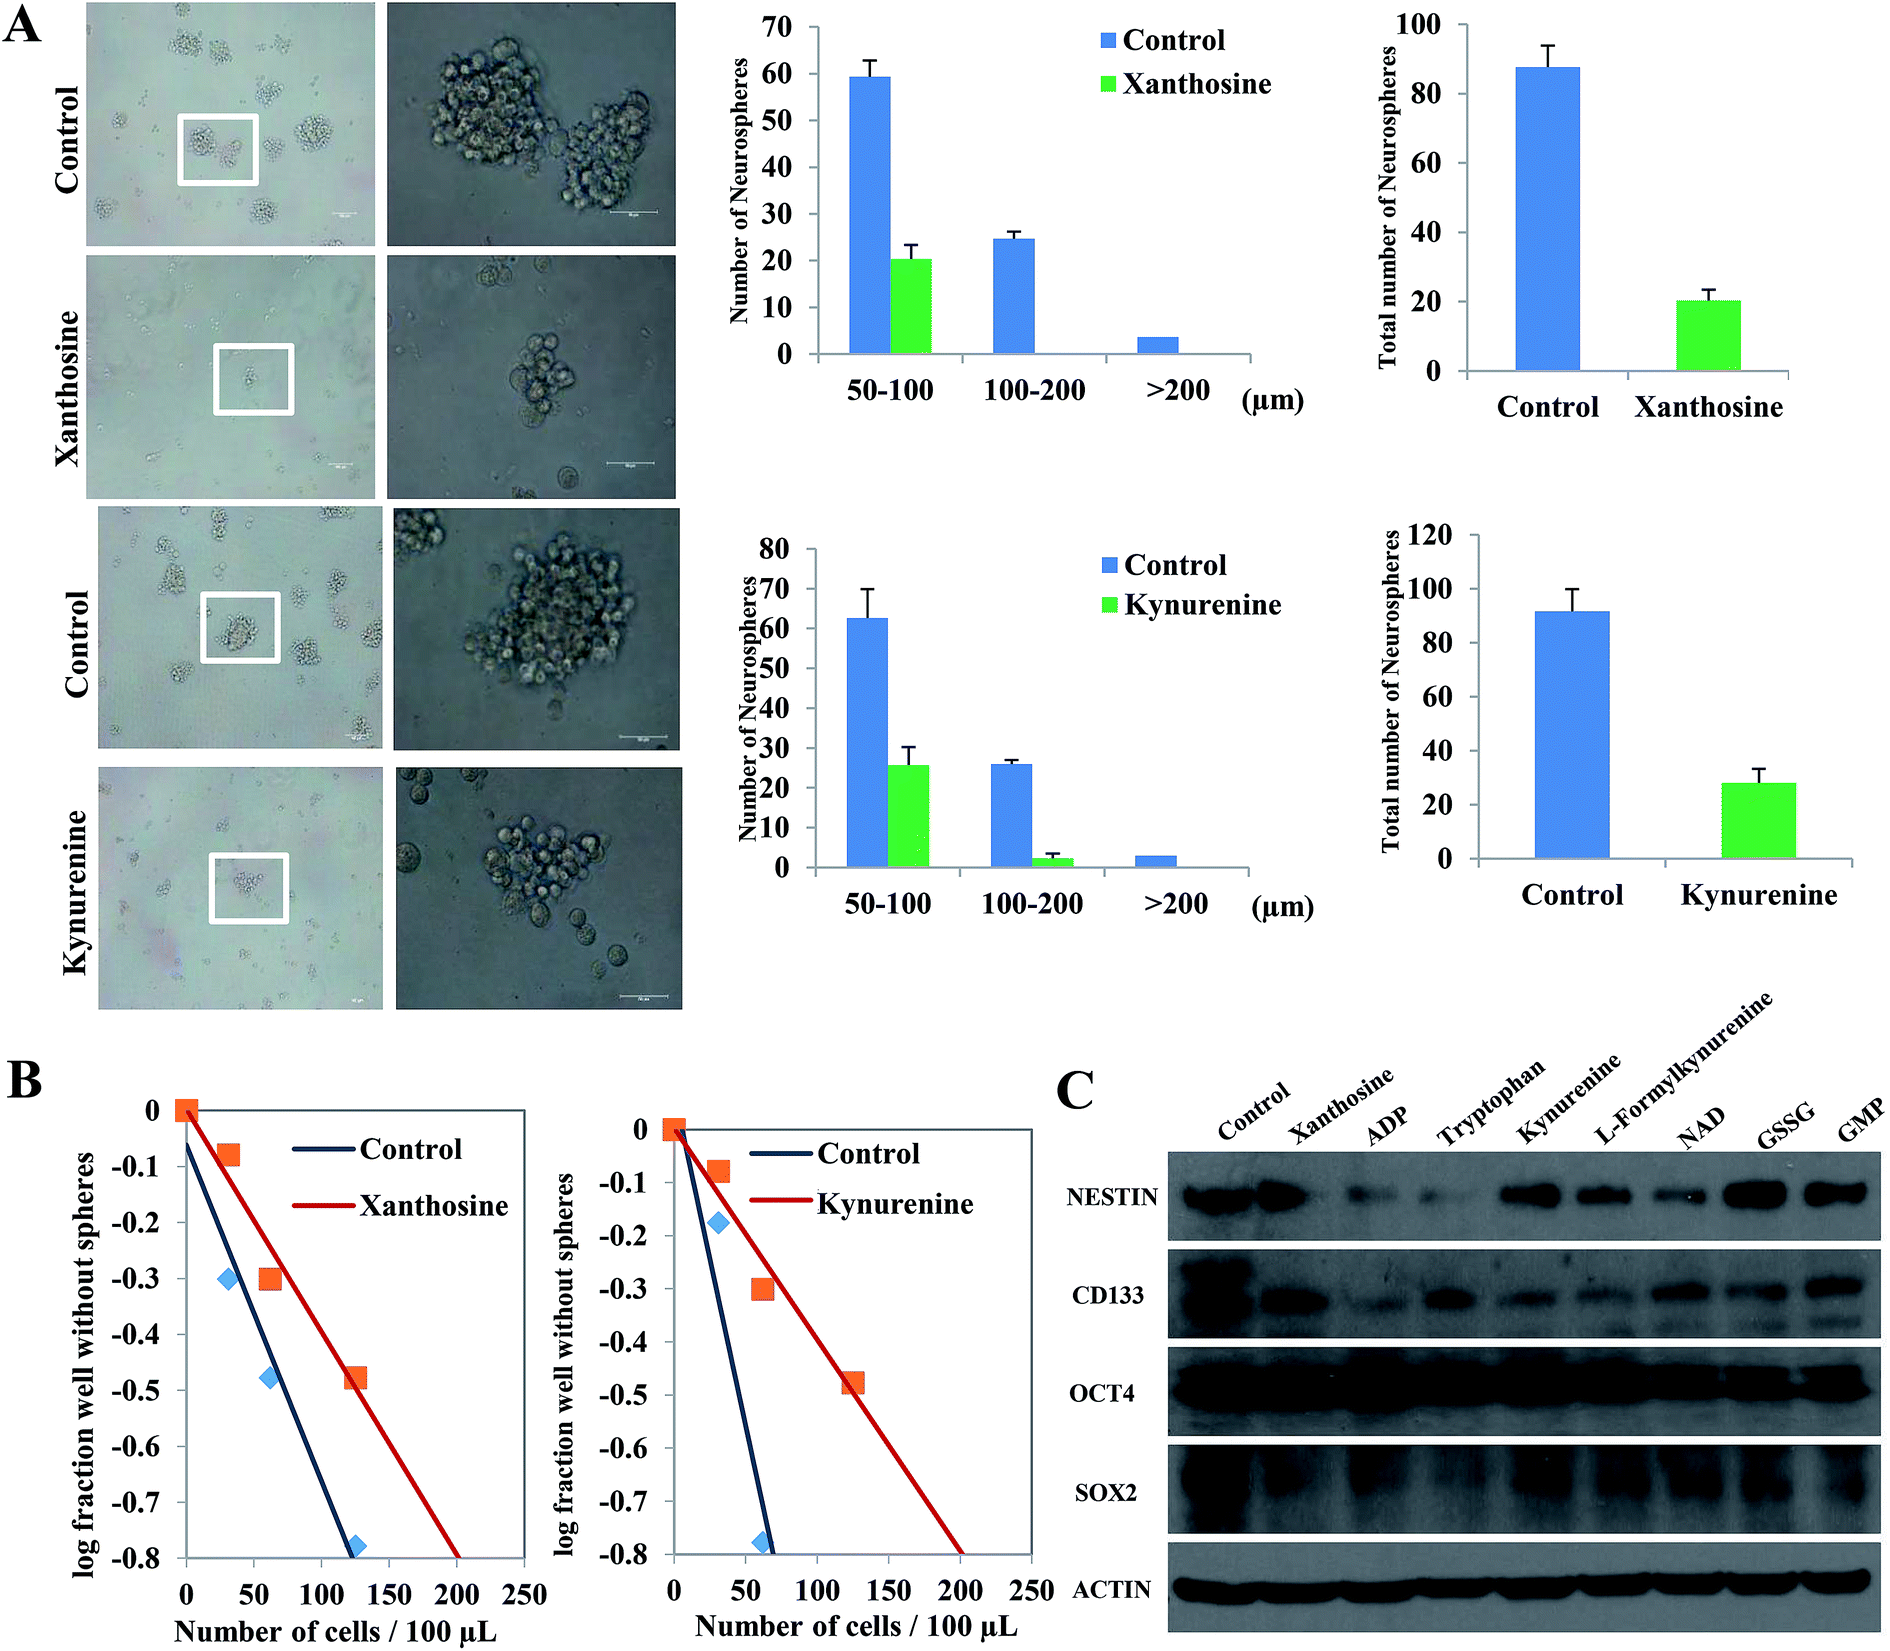 | ||
| Fig. 4 Self-renewal ability assay of SLCs exposed to differential metabolites. (A) Sphere formation assay. Left panel: Phase-contrast photomicrographs of SLCs treated with xanthosine and kynurenine (bar = 100 μm, left; bar = 50 μm, right). Right panel: Sphere formation assay of SLCs treated with xanthosine and kynurenine; neurospheres with diameters larger than 50 μm were counted. The values shown are the means ± SD of at least 3 independent experiments. (B) Limiting dilution neurosphere assay. (C) Western blotting. | ||
Biological interpretation
On the basis of the above findings, an integrative view plot of the perturbed metabolites and metabolic pathways is shown in Fig. 5, which involved 39 differential metabolites and 5 relevant metabolic pathways. The key pathways involved in the self-renewal and differentiation of GSCs are discussed below.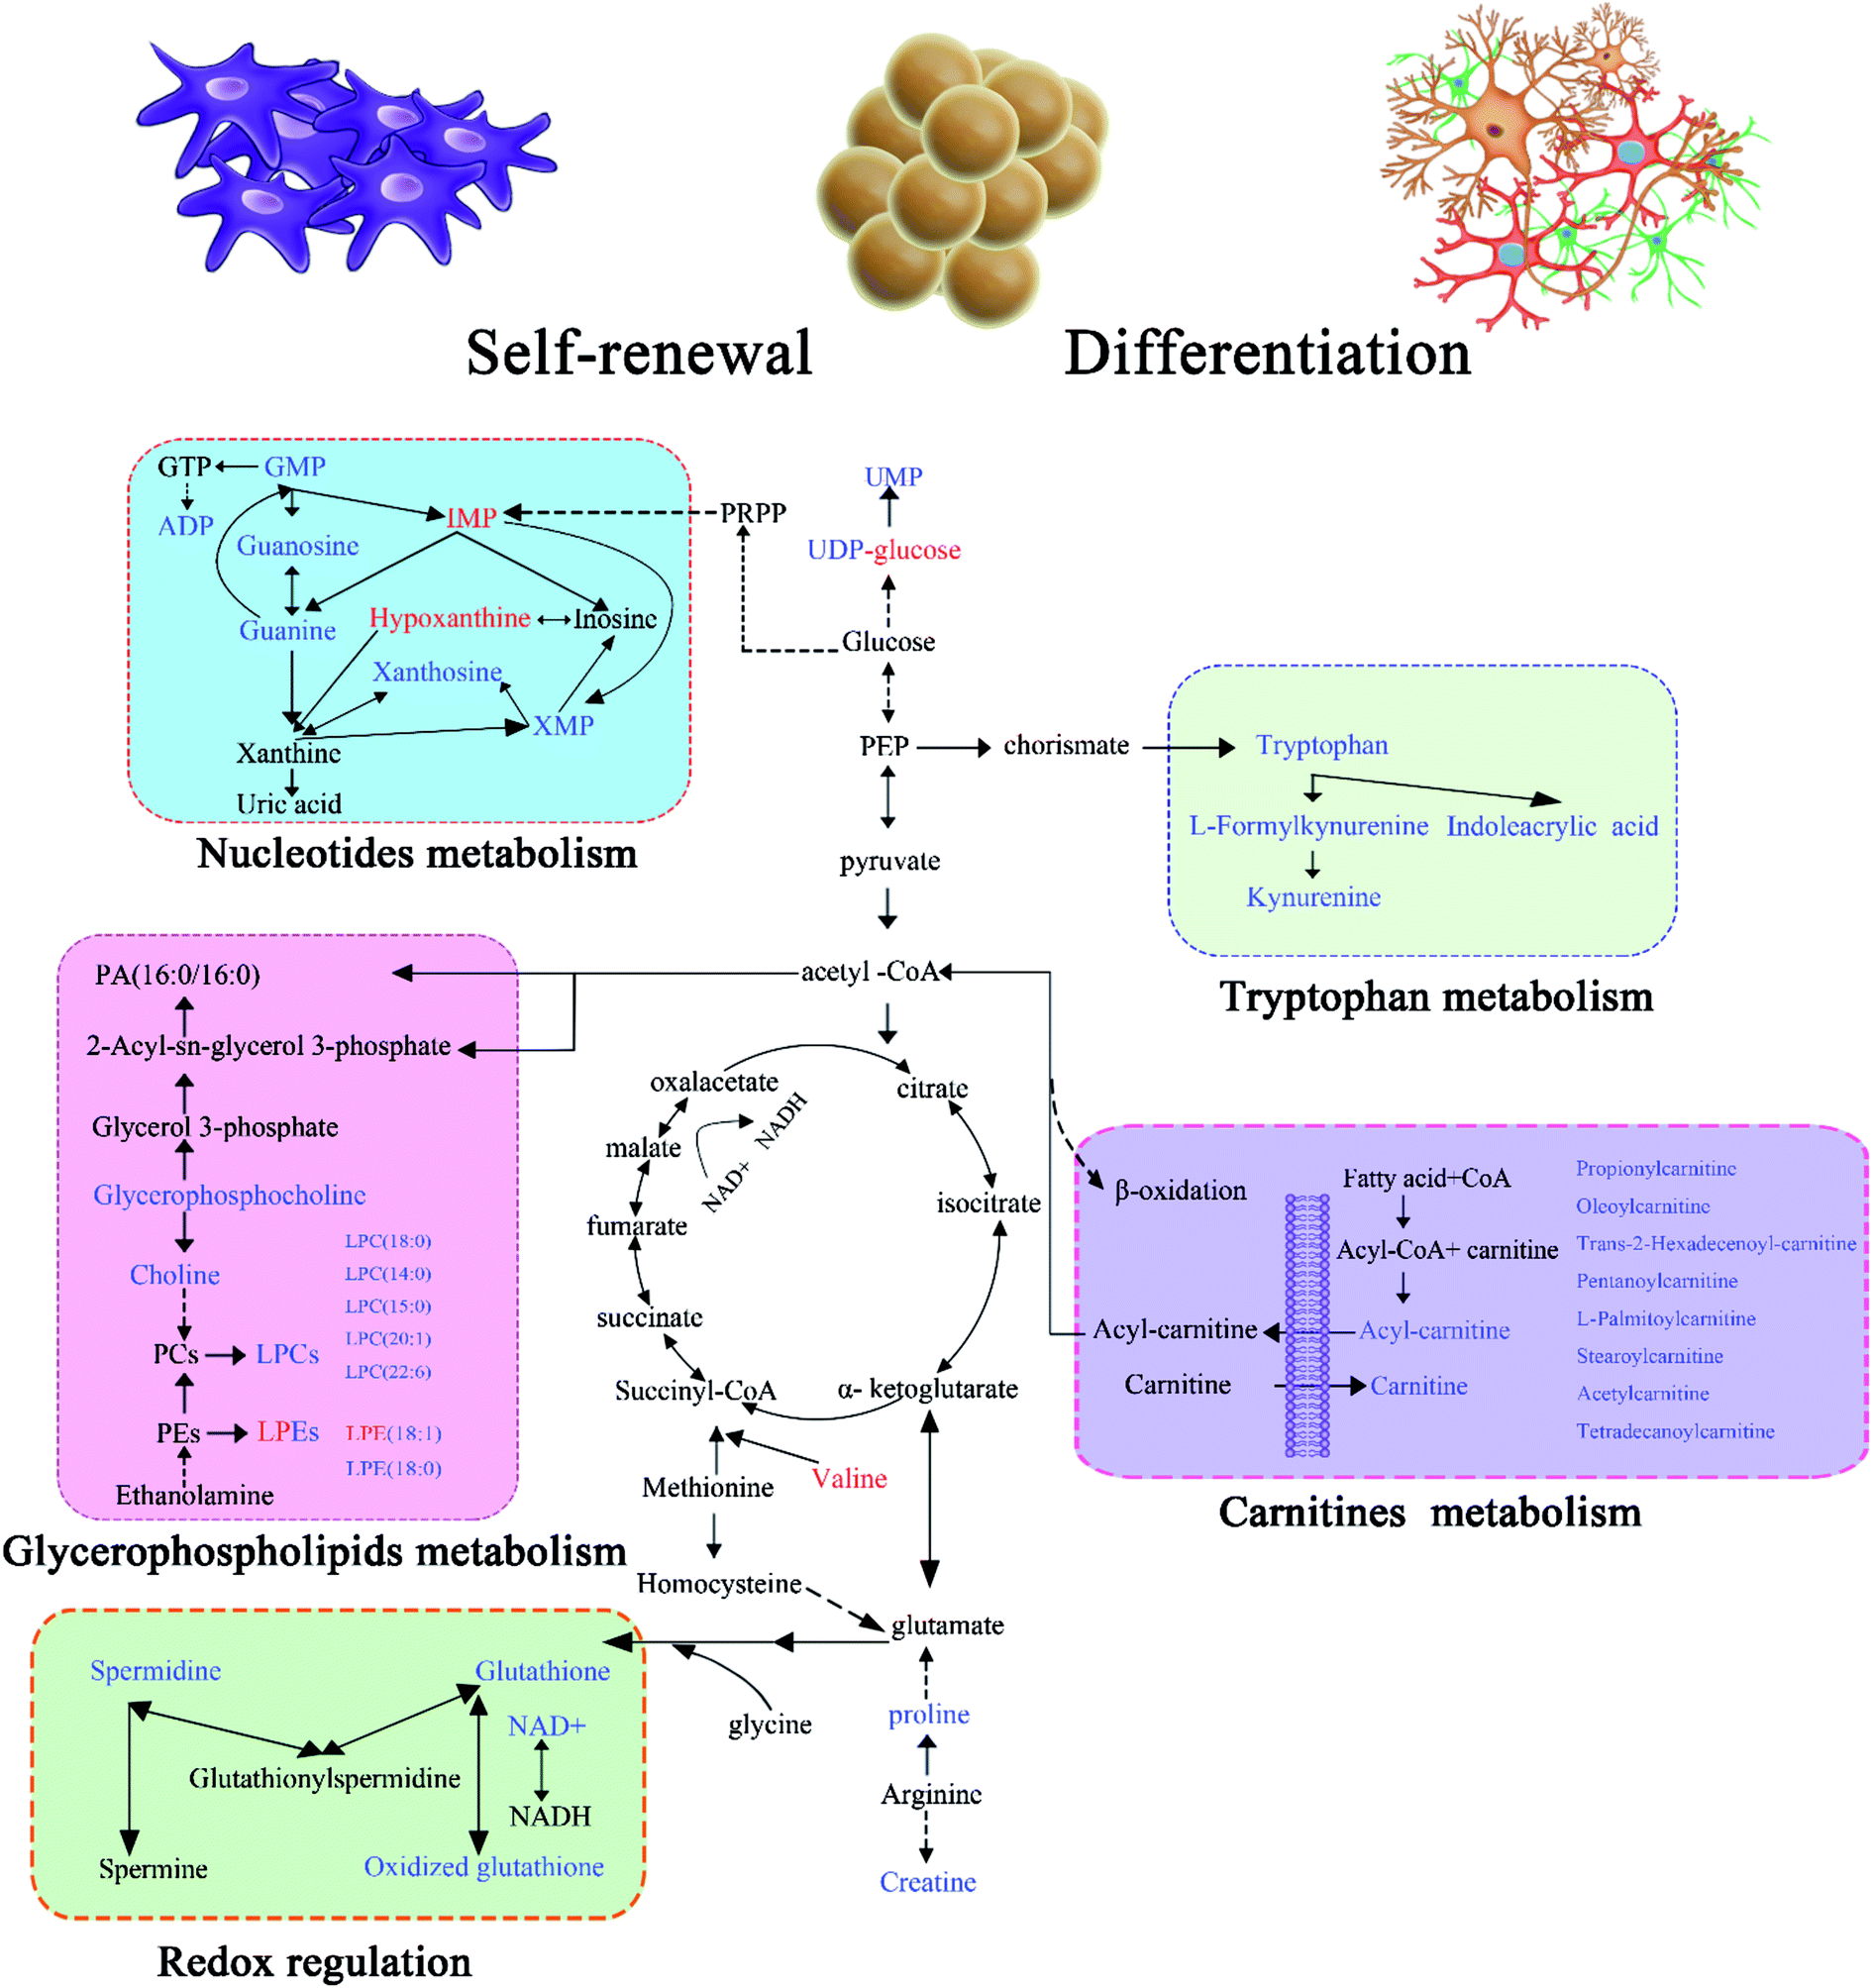 | ||
| Fig. 5 Schematic overview of the metabolites and key metabolic pathways involved in the self-renewal and differentiation of GSCs. Identified metabolites are shown in color; red represents up-regulated metabolites in SLCs compared with GCs or SLCDCs, and blue represents down-regulated metabolites in SLCs compared with GCs or SLCDCs, while the mixed colored UDP-glucose and LPEs have opposite trends in GC/SLC and SLCDC/SLC comparisons. | ||
Down-regulation of nucleotide metabolism in SLCs
Nucleotides have been associated with various types of cancer due to the regulated cell turnover rate29,30 and also increase in glioma during apoptosis.31 In gliomas there are large variations in the activities of enzymes involved in both purine and pyrimidine metabolism, and some sensitive targets in purine and pyrimidine metabolism have recently been identified for chemotherapeutic treatment of malignant tumors.32,33 The differentiation of a neural stem cell/neural progenitor cell into a neuron, astrocyte, or oligodendrocyte is associated with numerous transcriptional changes, including at genes associated with metabolism and energy sensing.34 In this study, several nucleotide metabolites were altered among the three types of glioma cells. XMP, xanthosine and ADP were significantly down-regulated in SLCs relative to GCs, whereas IMP and hypoxanthine were up-regulated. Although GMP, guanosine, guanine and UMP showed same trends in the GC/SLC and SLCDC/SLC comparisons, the fold-changes in the former are larger than those in the latter, indicating the enhanced nucleotide metabolism in GCs. Thus our observations agree with that stem cells have to ensure genomic stability during its self-renewable.Impaired glycerophospholipid metabolism in SLC self-renewal
Glycerophospholipids are key components of the cell membrane, serving as energy source to support the proliferation of cancer cells. LPCs can hydrolyze into fatty acids and then disintegrate in the mitochondrial matrix to produce energy through β-oxidation, a process that generates acetyl-CoA while producing ATP. Previous investigations have demonstrated that the accumulation of reactive oxygen species (ROS) reduces the PC, PE and GSH levels, while their oxidized forms LPCs, LPEs and GSSG are greatly increased.35,36 In this study, 8 glycerophospholipids were identified, including 6 glycerophosphocholines (LPCs) and 2 glycerophosphoethanolamines (LPEs). Most of the glycerophospholipids identified were up-regulated in GCs compared to SLCs, indicating impaired glycerophospholipid and energy metabolism in SLC self-renewal.Redox regulation in SLC stemness maintenance
Glutathione is biosynthesized from glutamate, cysteine, and glycine and exists in two forms, the reduced form (GSH) and oxidized form (GSSG), as a major redox buffer within the cell that is essential for maintaining homeostasis. Glutathione plays important roles in cellular functions including gene expression, DNA and protein synthesis, cell differentiation, proliferation, apoptosis, signal transduction, and the immune response. Glutathione also acts as a reducing agent and an antioxidant protecting cells from ROS,37,38 through the following reaction: 2GSH + R–O–OH → GSSG + H2O + R–OH. Therefore, decreased GSH or a low GSH/GSSG ratio are commonly associated with various pathological conditions as an effect of oxidative stress.39 Among the three types of glioma cells, SLCs exhibited the lowest level of GSSG and the highest GSH/GSSG ratio. This ratio was 12.85 and 1.56 times higher in SLCs than in GCs and SLCDCs, respectively. This indicates that stem cells contain lower levels of ROS compared to the other two cell types. To validate this metabolic change, the levels of intracellular ROS were determined according to the described protocols, and the ROS trend is consisting with the metabolomics results (Fig. S9†). Indeed, it has been reported that CSCs contain lower levels of ROS than their more mature progeny, which is likely due to oxidative stress occurring during differentiation.40,41 In addition, the intracellular oxidation state of glial precursor cells regulates the balance between self-renewal and differentiation.42 Therefore, this pathway may have potential for development as an adjuvant therapy to eradicate CSCs by increasing ROS production to induce differentiation.Metabolic responses of carnitines to SLC self-renewal and differentiation
L-carnitine and acylcarnitines levels were significantly higher in both GCs and SLCDCs compared to SLCs. Interestingly, the augmented levels of L-carnitine, propionylcarnitine, stearoylcarnitine, acetylcarnitine and tetradecanoylcarnitine were only observed in SLCDCs, up-regulated trans-hexadec-2-enoyl carnitine was only found in GCs, while the common altered pentanoylcarnitine, oleoylcarnitine and L-palmitoylcarnitine showed higher level in GCs than SLCDCs. The up-regulated metabolites found in this study are associated with major biofunctions such as (1) the transfer of long-chain fatty acids from the cytoplasm into the mitochondria matrix to undergo β-oxidation, (2) facilitating the movement of the peroxisomal β-oxidation product acetyl-CoA into the mitochondria for oxidation,43 (3) assisting in the removal of short-chain and medium-chain fatty acids from mitochondria,44 and (4) acting as a component of lipid catabolism and membrane integrity/stability. Various disorders are also characterized by the production and excretion of unusual acylcarnitines.45–47 The elevated levels of carnitine and acylcarnitines in GCs and SLCDCs might be due to the increase in fatty acid β-oxidation in mitochondria and the production of energy to promote rapid cell growth and neuronal differentiation, which is critical for the expanding energetic demands of differentiated progeny cells. The metabolic signatures of carnitines suggest that different carnitine metabolic pathways are involved in SLC self-renewal and differentiation.Enhanced tryptophan metabolism in SLC differentiation
As an essential amino acid required for the biosynthesis of proteins, tryptophan degradation occurs via two biochemical pathways, the kynurenine (Kyn) pathway and the serotonin (5-HT) pathway. The Kyn pathway is the major route of tryptophan catabolism and processes approximately 99% of ingested tryptophan not used for protein synthesis.48 In the Kyn pathway, tryptophan oxidation can be catalyzed by indoleamine-2,3-dioxygenase (IDO) or tryptophan-2,3-dioxygenase (TDO) to yield N-formylkynurenine, which is subsequently hydrolyzed to Kyn, finally resulting in the production of NAD and other neuroactive intermediates.49 Previous studies have shown that the Kyn pathway plays a role in neurological diseases, tumor proliferation, inflammation and depression. The significant up-regulation of the metabolites of tryptophan in SLCDCs suggests that the Kyn pathway is a promising target for therapeutic development.Conclusions
The present study is the first metabolomics study focused on metabolic signatures of glioma stem-like cells. The combination of untargeted and targeted metabolomics approach was used to investigate differentially expressed metabolites among cell lines with different stemness. The biochemical significance of metabolic alterations was explored according to known metabolic pathways. Then we obtained a comprehensive view of biochemical alterations and their functional metabolic connectivity. The altered nucleotide metabolism, glycerophospholipid metabolism, glutathione metabolism, carnitine metabolism and tryptophan metabolism all participate in or are related to mitochondrial dynamics and energy metabolic pathways, including the tricarboxylic acid cycle and oxidative phosphorylation. Therefore targeting of these metabolic pathways would facilitate an understanding of the mechanisms of self-renewal and differentiation of U87MG SLCs. Our study suggests the feasibility of using cell metabolomics for the biochemical mechanism elucidation. Further investigations based on integration of metabolomics and other omics are attractive to reveal the unique metabolic network within SLCs, to understand how metabolism contributes to SLC self-renewal and differentiation, and to develop novel treatment to fight gliomas.Conflict of interest
The authors declare no competing financial interests.Author contributions
Conceived and designed the experiments: RPZ WH ZA BQQ XXP. Performed the experiments: RZ PSH QCZ XYX SSL. Analyzed the data: RZ XFY ZZ JX YHC. Wrote the paper: RZ RPZ QCZ PSH WH.Acknowledgements
This work was supported by the National Natural Science Foundation of China (21327902), the National Key Research and Development Plan (2016YFC0902502) and the CAMS Innovation Fund for Medical Sciences (2016-I2M-1-001, 2016-I2M-3-010).References
- Q. T. Ostrom, H. Gittleman, J. Fulop, M. Liu, R. Blanda, C. Kromer, Y. Wolinsky, C. Kruchko and J. S. Barnholtz-Sloan, Neuro-Oncology, 2015, 17(suppl 4), iv1–iv62 CrossRef PubMed.
- C. Alifieris and D. T. Trafalis, Pharmacol. Ther., 2015, 152, 63–82 CrossRef CAS PubMed.
- S. K. Singh, C. Hawkins, I. D. Clarke, J. A. Squire, J. Bayani, T. Hide, R. M. Henkelman, M. D. Cusimano and P. B. Dirks, Nature, 2004, 432, 396–401 CrossRef CAS PubMed.
- B. Auffinger, A. L. Tobias, Y. Han, G. Lee, D. Guo, M. Dey, M. S. Lesniak and A. U. Ahmed, Cell Death Differ., 2014, 21, 1119–1131 CrossRef CAS PubMed.
- D. Beier, J. B. Schulz and C. P. Beier, Mol. Cancer, 2011, 10, 1 CrossRef PubMed.
- R. Galli, E. Binda, U. Orfanelli, B. Cipelletti, A. Gritti, S. De Vitis, R. Fiocco, C. Foroni, F. Dimeco and A. Vescovi, Cancer Res., 2004, 64, 7011–7021 CrossRef CAS PubMed.
- E. Vlashi, C. Lagadec, L. Vergnes, T. Matsutani, K. Masui, M. Poulou, R. Popescu, L. Della Donna, P. Evers and C. Dekmezian, Proc. Natl. Acad. Sci. U. S. A., 2011, 108, 16062–16067 CrossRef CAS PubMed.
- C. A. O'Brien, A. Kreso and C. H. Jamieson, Clin. Cancer Res., 2010, 16, 3113–3120 CrossRef PubMed.
- M. F. Clarke, J. E. Dick, P. B. Dirks, C. J. Eaves, C. H. Jamieson, D. L. Jones, J. Visvader, I. L. Weissman and G. M. Wahl, Cancer Res., 2006, 66, 9339–9344 CrossRef CAS PubMed.
- M. Cuperlovic-Culf, D. A. Barnett, A. S. Culf and I. Chute, Drug Discovery Today, 2010, 15, 610–621 CrossRef CAS PubMed.
- L. M. Raamsdonk, B. Teusink, D. Broadhurst, N. Zhang, A. Hayes, M. C. Walsh, J. A. Berden, K. M. Brindle, D. B. Kell and J. J. Rowland, Nat. Biotechnol., 2001, 19, 45–50 CrossRef CAS PubMed.
- C. H. Johnson, J. Ivanisevic and G. Siuzdak, Nat. Rev. Mol. Cell Biol., 2016, 17, 451–459 CrossRef CAS PubMed.
- P.-D. St-Coeur, J. J. Poitras, M. Cuperlovic-Culf, M. Touaibia and P. Morin Jr, J. Neuro-Oncol., 2015, 125, 91–102 CrossRef CAS PubMed.
- M. Cuperlovic-Culf, D. Ferguson, A. Culf, P. Morin Jr and M. Touaibia, J. Biol. Chem., 2012, 287, 20164–20175 CrossRef CAS PubMed.
- S. Wei, J. Gu, C. Huang, L. Dan, H. Huang, Z. Huang, L. Zhen, W. Yang, K. Liu and D. Lin, Mol. Cancer, 2014, 13, 197 CrossRef PubMed.
- P. Kucharzewska, H. C. Christianson and M. Belting, PLoS One, 2015, 10, e0116740 Search PubMed.
- P. Morin Jr, D. Ferguson, L. M. LeBlanc, M. J. Hebert, A. F. Pare, J. Jean-Francois, M. E. Surette, M. Touaibia and M. Cuperlovic-Culf, J. Proteome Res., 2013, 12, 2165–2176 CrossRef PubMed.
- C. Zhao, H. Du, L. Xu, J. Wang, L. Tang, Y. Cao, C. Li, Q. Wang, Y. Liu, F. Shan, J. Feng, F. Xu and P. Gao, J. Pharm. Biomed. Anal., 2015, 115, 48–54 CrossRef CAS PubMed.
- T. P. Mathews, S. Hill, K. L. Rose, P. T. Ivanova, C. W. Lindsley and H. A. Brown, ACS Chem. Biol., 2015, 10, 1258–1268 CrossRef CAS PubMed.
- R. Pandher, C. Ducruix, S. A. Eccles and F. I. Raynaud, J. Chromatogr. B: Anal. Technol. Biomed. Life Sci., 2009, 877, 1352–1358 CrossRef CAS PubMed.
- C. A. Sellick, R. Hansen, G. M. Stephens, R. Goodacre and A. J. Dickson, Nat. Protoc., 2011, 6, 1241–1249 CrossRef CAS PubMed.
- C. A. Smith, E. J. Want, G. O'Maille, R. Abagyan and G. Siuzdak, Anal. Chem., 2006, 78, 779–787 CrossRef CAS PubMed.
- R. Tautenhahn, K. Cho, W. Uritboonthai, Z. Zhu, G. J. Patti and G. Siuzdak, Nat. Biotechnol., 2012, 30, 826–828 CrossRef CAS PubMed.
- J. Xia, I. V. Sinelnikov, B. Han and D. S. Wishart, Nucleic Acids Res., 2015, 43, W251–W257 CrossRef PubMed.
- F. Wu, P. Hu, D. Li, Y. Hu, Y. Qi, B. Yin, T. Jiang, J. Yuan, W. Han and X. Peng, Oncotarget, 2016, 7, 61619–61629 Search PubMed.
- Y. Gong, J. Yue, X. Wu, X. Wang, J. Wen, L. Lu, X. Peng, B. Qiang and J. Yuan, Nucleic Acids Res., 2006, 34, 6158–6169 CrossRef CAS PubMed.
- J. Xu, Y. Chen, R. Zhang, Y. Song, J. Cao, N. Bi, J. Wang, J. He, J. Bai and L. Dong, Mol. Cell. Proteomics, 2013, 12, 1306–1318 CAS.
- Z. An, Y. Chen, R. Zhang, Y. Song, J. Sun, J. He, J. Bai, L. Dong, Q. Zhan and Z. Abliz, J. Proteome Res., 2010, 9, 4071–4081 CrossRef CAS PubMed.
- L. Men, Z. Pi, Y. Zhou, Y. Liu, M. Wei, F. Song and Z. Liu, RSC Adv., 2017, 7, 16494–16504 RSC.
- J. Wang, T. T. Christison, K. Misuno, L. Lopez, A. F. Huhmer, Y. Huang and S. Hu, Anal. Chem., 2014, 86, 5116–5124 CrossRef CAS PubMed.
- K. K. Lehtimaki, P. K. Valonen, J. L. Griffin, T. H. Vaisanen, O. H. Grohn, M. I. Kettunen, J. Vepsalainen, S. Yla-Herttuala, J. Nicholson and R. A. Kauppinen, J. Biol. Chem., 2003, 278, 45915–45923 CrossRef PubMed.
- K. Pillwein, P. Chiba, A. Knoflach, B. Czermak, K. Schuchter, E. Gersdorf, B. Ausserer, C. Murr, R. Goebl and G. Stockhammer, Cancer Res., 1990, 50, 1576–1579 CAS.
- V. Bardot, A. Dutrillaux, J. Delattre, F. Vega, M. Poisson, B. Dutrillaux and C. Luccioni, Br. J. Cancer, 1994, 70, 212 CrossRef CAS PubMed.
- V. A. Rafalski and A. Brunet, Prog. Neurobiol., 2011, 93, 182–203 CrossRef CAS PubMed.
- X. Shao, D. Gao, Y. Wang, F. Jin, Q. Wu and H. Liu, J. Chromatogr. B: Anal. Technol. Biomed. Life Sci., 2016, 1025, 40–47 CrossRef CAS PubMed.
- R. Weng, S. Shen, C. Burton, L. Yang, H. Nie, Y. Tian, Y. Bai and H. Liu, Anal. Bioanal. Chem., 2016, 408, 2963–2973 CrossRef CAS PubMed.
- J. M. Estrela, A. Ortega and E. Obrador, Crit. Rev. Clin. Lab. Sci., 2006, 43, 143–181 CrossRef CAS PubMed.
- N. Traverso, R. Ricciarelli, M. Nitti, B. Marengo, A. L. Furfaro, M. A. Pronzato, U. M. Marinari and C. Domenicotti, Oxid. Med. Cell. Longevity, 2013, 2013, 972913 Search PubMed.
- R. Franco, O. J. Schoneveld, A. Pappa and M. I. Panayiotidis, Arch. Physiol. Biochem., 2007, 113, 234–258 CrossRef CAS PubMed.
- O. Yanes, J. Clark, D. M. Wong, G. J. Patti, A. Sanchez-Ruiz, H. P. Benton, S. A. Trauger, C. Desponts, S. Ding and G. Siuzdak, Nat. Chem. Biol., 2010, 6, 411–417 CrossRef CAS PubMed.
- M. Ushio-Fukai and J. Rehman, Antioxid. Redox Signaling, 2014, 21, 1587–1590 CrossRef CAS PubMed.
- J. Smith, E. Ladi, M. Mayer-Proschel and M. Noble, Proc. Natl. Acad. Sci. U. S. A., 2000, 97, 10032–10037 CrossRef CAS PubMed.
- R. J. Wanders, Biochem. J., 2002, 361, 417–429 CrossRef.
- G. Peluso, R. Nicolai, E. Reda, P. Benatti, A. Barbarisi and M. Calvani, J. Cell. Physiol., 2000, 182, 339–350 CrossRef CAS PubMed.
- T. Ueland, A. Svardal, E. Oie, E. T. Askevold, S. H. Nymoen, B. Bjorndal, C. P. Dahl, L. Gullestad, R. K. Berge and P. Aukrust, Int. J. Cardiol., 2013, 167, 1892–1899 CrossRef PubMed.
- S. Ganti, S. L. Taylor, K. Kim, C. L. Hoppel, L. Guo, J. Yang, C. Evans and R. H. Weiss, Int. J. Cancer, 2012, 130, 2791–2800 CrossRef CAS PubMed.
- K. Chughtai, L. Jiang, T. R. Greenwood, K. Glunde and R. M. Heeren, J. Lipid Res., 2013, 54, 333–344 CrossRef CAS PubMed.
- I. Davis and A. Liu, Expert Rev. Neurother., 2015, 15, 719–721 CrossRef CAS PubMed.
- G. J. Guillemin, S. J. Kerr, G. A. Smythe, P. J. Armati and B. J. Brew, Adv. Exp. Med. Biol., 1999, 467, 125–131 CrossRef CAS PubMed.
Footnotes |
| † Electronic supplementary information (ESI) available. See DOI: 10.1039/c7ra03781c |
| ‡ These authors contributed equally to this work. |
| This journal is © The Royal Society of Chemistry 2017 |