
 Open Access Article
 This Open Access Article is licensed under a
 Creative Commons Attribution 3.0 Unported Licence
Ab initio molecular dynamics study of the interaction of plutonium with oxygen in the gas phase†‡
QingQing Wang a,
WenLang Luob,
XiaoLi Wangc and
Tao Gao*a
a,
WenLang Luob,
XiaoLi Wangc and
Tao Gao*a
aInstitute of Atomic and Molecular Physics, Sichuan University, Chengdu, 610065, China. E-mail: gaotao@scu.edu.cn
bSchool of Electronics and Information Engineering, Jinggangshan University, Ji'an 343009, China
cInstitute of Nuclear Physics and Chemistry, China Academy of Engineering Physics, Mianyang, 621900, China
First published on 20th July 2017
Abstract
There are two kinds of plutonium surface corrosion, one of which is oxidation between plutonium and oxygen or oxygen compounds. To investigate the corrosion mechanism of plutonium with oxygen, density functional theory (DFT) calculations have been carried out in the present study to investigate the interaction of plutonium atoms with oxygen molecules. Considering all possible spin states, a comprehensive description of the reaction mechanism is presented. All minima and transition state structures along the reaction pathway are optimized and the interaction energies and equilibrium distances were evaluated. The nature of the Pu–O bonding mode evolution along the reaction pathways was further validated using electron localization function (ELF) calculations, which indicated that the interaction could be considered as an electrostatic interaction in the entrance channel and a strong covalent interaction in the exit channel. We analyzed the density of states (DOS) for the minima and transition states, for the sake of analyzing the contribution of 5f electrons/orbitals in the title reaction. The results indicate that the most of the contributions to the HOMO come from the 5f orbitals of the plutonium atoms. Furthermore, reaction rate constants computed between 298 and 1000 K using variational transition state theory (VTST) suggest that Wigner tunneling effects are generally large for the reactions considered. Additionally, product energy distributions for the title reaction were evaluated by carrying out direct classical trajectory calculations. The results demonstrate that most of the available energy appears as the vibration energy of the products. The outcomes of the current theoretical studies provide detailed insights for understanding the interaction of plutonium with oxygen molecules.
1 Introduction
In the past decades, the reactions of actinide atoms with small molecules have been a subject of considerable interest,1–4 while the corrosion of plutonium in air is a topic of continuing interest and is an important consideration in establishing procedures for the safe handling and storage of the metal. Plutonium can react with a variety of gases, resulting in damage from the surface to the inside. Some theoretical studies have provided important insights into the electronic structure of plutonium elements,5–7 where the 5f electrons are relatively high in energy and are spatially extended. Furthermore, numerous investigations have been executed and provided a wealth of insight concerning the reactions of actinide with small molecules, both experimentally1,2,8–22 and theoretically,3,4,22–24 which can be used as reference when investigating plutonium corrosion.Experimentally, using Fourier transform ion cyclotron resonance mass spectrometry (FTICR-MS),2–4 new kinetic and thermochemical data for systems involving Pa,25 Np,2,14,26 Pu,2,14 Am,2,13 and Cm27 have been obtained by examining reactions of singly and doubly charged cations with oxidants. John M. Haschke et al. studied the reaction kinetics of plutonium with oxygen, water and humid air,28 and demonstrated the main reaction products.
In the process of the application of nuclear materials, one challenge is the corrosive effects of the environmental atmosphere, e.g. O2, H2O, etc. Moreover, it's quite difficult to study corrosive effects through experiment because of the virulence and radioactivity of Pu atoms. Therefore, a reliable and accurate theoretical model is required in order to study the physical properties of compounds involved in the process of corrosion.
Using theory, several investigations into the reaction mechanisms of actinide atoms with small molecules have been performed using different calculation methods. In fact, detailed reaction processes have been obtained for the following systems: Pu + H2O,29 PuO2 + H2,30,31 Th + NH3,32 and Th+(Th2+) + H2O.33 These studies demonstrated the reaction mechanisms and electronic structures along the minimum energy reaction pathways as well as the potential energy profiles.
From what has been discussed above, although some experimental studies have been published on the Pu + O2 system, obtaining the rate constants and products, there is no systematic research on detailed micro-reaction mechanisms, structures, spectra, density of states and reaction dynamics for the system Pu + O2, either in theory or in practice. Consequently there is a compelling need for systematic high-level computational studies of this reaction.
For a better understanding of the corrosion mechanism of plutonium with oxygen, DFT calculations have been carried out in the current study to investigate the interaction of plutonium with oxygen. This paper reports the molecular structures and bond characteristics of all the equilibrium structures along the reaction pathway. The electron localization function (ELF) theoretical method is used for obtaining detailed information about bonding characteristics. We analyze the roles of the 5f orbitals by means of the total density of states (TDOS), partial density of states (PDOS) and overlap potential density of states (OPDOS).34 In addition, reaction rate constants are computed between 298 and 1000 K using variational transition state theory (VTST). Additionally, classical trajectory calculations are carried out by using an ab initio molecular dynamics method.
2 Theoretical methods
All structures of reactants, intermediates, transition states and products were optimized using three different computational methods. Firstly, the DFT approach, utilizing B3LYP,35,36 B3PW91,37 PBE0,38 PW91PW91,39 and TPSSTPSS,40 along with the 6-311++G(d,p) basis set of Pople and co-workers, was employed for O atoms41–43 and the Stuttgart–Dresden relativistic effective core potential (RECP) was used for describing the atomic Pu species.44,45 The plutonium atomic nucleus potential changes significantly, while the pseudopotential is relatively gentle, where the result is the same as the real potential. Therefore, we take the pseudopotential for the plutonium atoms in order to facilitate calculations. This relativistic small-core RECP replaces the59 electrons in the inner shells 1–4, leaving the explicit treatment of the n ≥ 5 shell valence electrons.46 The present computational methodology has been successfully established for treating actinide systems and has been well employed in a series of previous calculations.4–6,47 The frequencies of all geometric structures were calculated at the same level of theory to confirm that the structures were minima (no imaginary frequencies) or transition states. Intrinsic reaction coordinates (IRC)48 were calculated for the transition states to confirm that the structures did indeed connect two designated minima. Analyses by Alejandro Montoya and Thanh N. Truong49 show that DFT methods should be used in chemical reactions due to smaller spin contamination. Consequently, there are smaller differences in both the geometry and binding energy. Here, spin contamination of the complexes and transition states has been checked, and we found, in all cases, that the calculated values are different from S(S + 1) by less than 5%.All of the above calculations have been carried out by using the Gaussian 09 program package.50 Secondly, relativistic two-component zero-order regular approximation (ZORA) with both scalar relativistic (SR) and PW91 functional calculations was performed with the ADF code (designated as PW91/ZORA-SR), along with triple-zeta plus polarization functions (TZP) for plutonium atoms, and TZ2P for oxygen atoms. Finally, the spin–orbit (SO) coupling was considered for the optimized geometries obtained with PW91/ZORA-SR, as implemented in the ADF2013 package.
To get a deep understanding of the role of the 5f electrons in the chemical bonds of plutonium complexes, TDOS, PDOS and OPDOS were calculated.34 These calculations were performed with the Multiwfn51 package. The Multiwfn package was also used to study the bonding properties along the reaction pathways. The understanding of the bond evolution is based on analyses of the electron localization function (ELF),52,53 which provides a new description of chemical bonds for almost all kinds of compounds. The ELF can have maxima at the most probable positions of localized electron pairs, and each special position is surrounded by a basin in which the probability of finding an electron pair increases. In addition, these electron basins correspond to the electron pair domains from the VSEPR model.54,55 The larger the electron localization value is in a region, the greater the possibility that electron motion is confined within it. These studies have provided useful information on the bonding evolution over the reaction pathway.
The reaction rate constants for all the reaction channels were computed between T = 298 and 1000 K using VTST, as implemented in the KiSThelP program.56 One-dimensional tunneling and variational effects have also been incorporated in the TST calculations as used by Wigner.
The Born–Oppenheimer molecular dynamics (BOMD) method was implemented using the Gaussian 09 package. A fifth-order polynomial fitted to the energy, gradient and Hessian at each time step was used for this method. During the process of integrating the trajectories, the step size was 0.25 amu1/2 bohr. In addition, we evaluated the product energy distributions (PEDs) for the Pu + O2 reaction.
3 Results and discussion
For the reaction of bare actinide atoms with small molecules, it's important to analyze the different spin states. In the recent study, more than one spin state was considered: those studied were the quintet, septet, and nonet. In addition, it's necessary for a better description of the whole reaction mechanism to describe the actinide atom energy ordering correctly and the relative energies of the ground state and low-lying excited states. Therefore, we computed the energies of the ground state and low-lying excited states of the Pu atom and compared them with the experimental values, as collected in Table 1.| Species | B3LYP/SDD | B3PW91/SDD | PBE0/SDD | PW91/SDD | TPSS/SDD | Exptla |
|---|---|---|---|---|---|---|
| a Statistically averaged spin orbit energy levels taken from http://web2.lac.u-psud.fr/lac/Database/Contents.html. | ||||||
| [Rn]5f67s2(5) | 32.99 | 41.10 | 43.17 | 40.81 | 32.60 | 39.10 |
| [Rn]5f67s2(7) | 0.00 | 0.00 | 0.00 | 0.00 | 0.00 | 0.00 |
| [Rn]5f66d7s2(9) | 54.39 | 47.70 | 47.70 | 52.56 | 36.52 | 45.02 |
Table 1 shows a better comparison between the different kinds of methods. As can be seen from Table 1, the ground state of the Pu atom is the 5f67s2(7) configuration. The quintet state, 5f67s2(5), and nonet state, 5f66d7s2(9), are 39.107 kcal mol−1 and 45.019 kcal mol−1 over the ground state experimentally, respectively. The plutonium atom energy ordering calculated using all these methods predicts the ordering correctly, and in accordance with the experimental data, while the TPSS/SDD method gives an underestimated energy for the nonet electronic state.
3.1 Reaction mechanisms
The reaction we studied involves the reaction pathway Pu + O2 → RC → TS → IM → PuO2. John M. Haschke, Thomas H. Allen, and Jerry L. Stakebake studied the reaction kinetics of plutonium with oxygen, water and humid air. The results indicate that the oxidation product of Pu + O2 is PuO2,28 which is consistent with the reaction mechanism we studied. Next we will analyze this in detail.The geometric structures and key parameters calculated corresponding to the reaction intermediates and the transition states involved in the reaction are reported in Fig. 1. Transition vectors and corresponding imaginary frequencies for the transition state structures are indicated. The differences between the geometries of the sextet state, the quintet state and the nonet state are small. We do not refer to the geometries of the nonet state or any of quintet state, since we only care about the minimum energy path. Fig. 2 demonstrates the computed potential energy profile for the reaction of Pu + O2 in the sextet, quintet and nonet states. The profile connects the reaction intermediates (local minima) and the transition states (saddle points) on the potential energy surfaces.
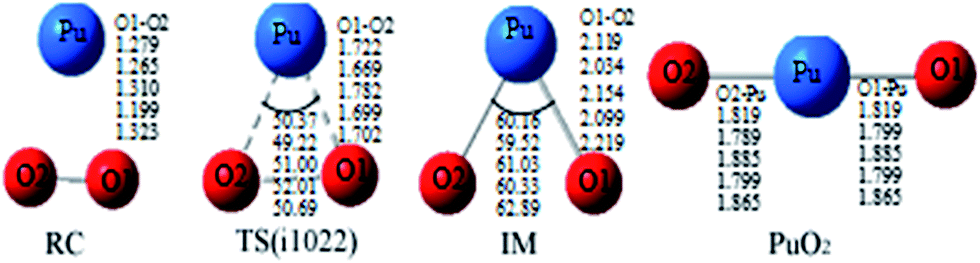 | ||
| Fig. 1 Geometrical parameters of all of the special points involved in the reaction calculated using B3LYP/SDD, PW91/SDD, PBE0/SDD, PBE/SDD, and TPSS/SDD (from the top to the bottom row, respectively). RC: reactant complex; TS: transition state; and IM: intermediate species. Bond distances are in angstroms, and angles are in degrees. | ||
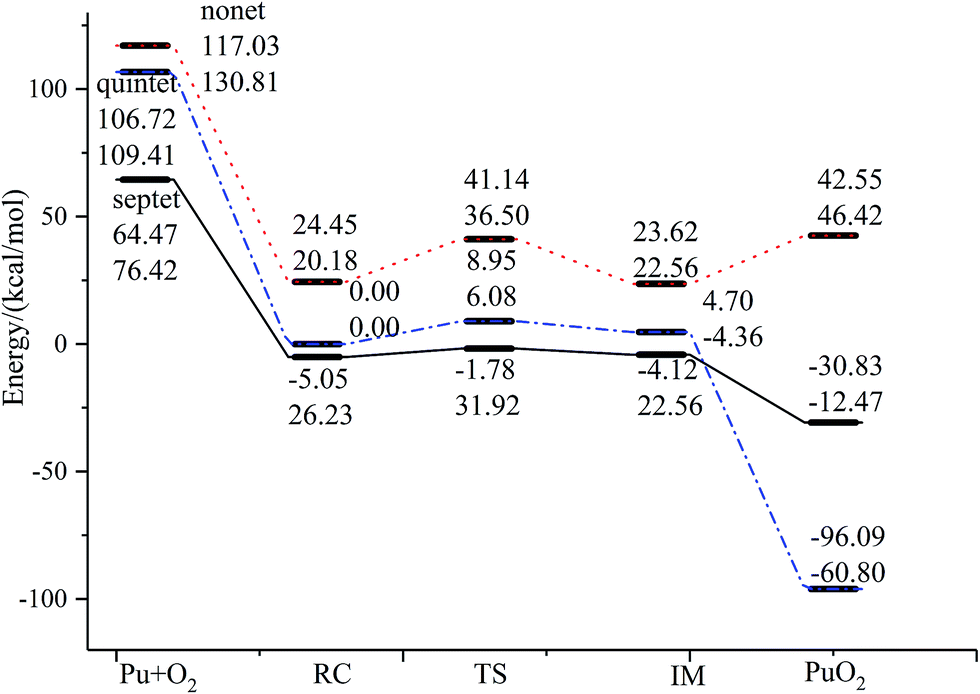 | ||
| Fig. 2 The geometric structures and potential energy profile for the reaction of Pu + O2 → PuO2 computed at the PW91/SDD (above) and B3LYP/SDD (below) levels of theory. | ||
Fig. 1 presents that the bond distance is getting longer going from RC to IM. The final product O–Pu–O is formed following the isomerization of IM, and O–Pu–O has a linear structure. We demonstrate from detailed IRC analyses that the reaction pathways of the three spin states are connected by the reaction intermediate and the transition state correctly. Let us first immediately discuss the IRC analyses of the reaction pathway from the reactant complex (RC) to the intermediate (IM) via TS. The IRC is the steepest descent path that connects a reactant and a product via a transition state on a potential energy surface. It is confirmed from IRC analyses that TS correctly connects the whole reaction pathway for a combination of a plutonium atom and an oxygen molecule. This process can be viewed as a fracturing of the O–O bond. This is the most important step, in which the O–O bond of oxygen is cleaved to migrate toward the plutonium, leading to a plutonium–oxygen intermediate. A detailed description of the oxygen migration in the septet state is given in Fig. 1, with respect to the changes in geometrical parameters along the whole reaction pathway. The IRC was traced from TS, which exhibits a C2v structure with an imaginary vibrational mode of 1021 cm−1, in both reactant and product directions. Our IRC analyses show that the reaction pathway of steepest descent leads to an energy minimum in product “valleys”.
The most important aspect of this reaction pathway is a change in energy, as shown in Fig. 2. The reaction pathway is believed to involve the initial step of the approaching of a Pu atom and an O2 molecule, yielding a first complex RC with a reduced energy of 69.52 kcal mol−1 at the PW91/SDD level and 50.19 kcal mol−1 at the B3LYP/SDD level, respectively. Then the system rises to the transition state energy, which is 5.68 kcal mol−1 higher than RC and 9.36 kcal mol−1 higher than the intermediate product IM at the PW91/SDD level. The fracturing of the O–O bond results in the formation of the intermediate IM. There is a crossing point between the septet and quintet energy profiles, as shown in Fig. 2; thus, the reacting system preferentially follows the septet potential energy surface over the first half of the reaction and the quintet potential energy surface over the second half of the reaction. Such spin inversion, which can occur in the vicinity of a crossing region, should play an essential role in combination reactions. Throughout the potential energy surface, we can conclude that the potential energy surface is repulsive, and a characteristic is that energy is released during the forming of products. Most of the energy released transforms into vibrational energy in the reaction products.
The relative energies of stationary species of Pu + O2 with respect to the ground-state transition state TS are listed in Table 2. For a system where there are no experimentally determined structural parameters and energy values, it is important to calculate the system energy using different functionals to see if they give consistent results.57 It is well known that some DFT methods perform well in predicting energies, but the results can be sensitive to the functional. Therefore, in addition to the B3LYP/SDD and PW91/SDD levels of theory used in this study, we also investigated the potential energy surface using several other levels of theory, including PBE0/SDD, B3PW91/SDD and TPSS/SDD. The results from these methods were consistent, with the exception of TPSS/SDD, which underestimated the energy of all special points along the reaction mechanism. In addition, the relative energy is also calculated at the level of ZORA-SO and ZORA-SR due to the importance of spin–orbit effects on plutonium. As can be seen, the PW91/SDD calculations were consistent with PW91/ZORA-SO. This range of methods should provide a broad survey of the structures and energetics associated with the reaction of Pu + O2.
| RC | TS | IM | PuO2 | |
|---|---|---|---|---|
| a For plutonium atoms the basis set is SDD, and for oxygen atoms it is 6-311++G(d,p).b For plutonium atoms the basis set is TZP, and for oxygen atoms it is TZ2P, PW91/ZORA-SR.c For plutonium atoms the basis set is TZP, and for oxygen atoms it is TZ2P, with single-point PW91/ZORA-SO results. | ||||
| B3LYPa | −5.68 | 0.00 | −9.36 | −35.03 |
| PW91a | −3.27 | 0.00 | −2.34 | −29.05 |
| ZORA-SRb | −6.82 | 0.00 | −9.97 | −17.45 |
| ZORA-SOc | −4.48 | 0.00 | −11.26 | −18.23 |
| PBE0a | −13.18 | 0.00 | −12.56 | −39.53 |
| B3PW91a | −15.69 | 0.00 | −2.51 | −42.67 |
| TPSSa | −29.50 | 0.00 | −34.51 | −43.30 |
Through a comparison of the calculation results, we finally chose the PW91/SDD method for the following analyses, including bonding evolution and trajectory calculations. This option gave a practical compromise between cost calculation and the reliability of the calculation results. This functional performed well for reactions involving actinide compounds and has been employed in previous studies of actinide systems.
3.2 ELF analyses
As previously mentioned, electronic localization function (ELF) analyses were performed for the minima and transition states along the pathway of plutonium reacting with oxygen (see Fig. 3), which can identify changes clearly in the chemical bonding character along the reaction pathway. ELF = 1 denotes electron localization, while ELF = 0 corresponds to a completely delocalized situation. Generally a large ELF value at a given point indicates that electrons are greatly localised, which indicates that there will be a covalent bond, a lone pair, or inner electron shells therein.58 ELF can resolve different problems, including the verification of charge-shift bonds and atomic shell structure, and the classification of chemical modes.57 Therefore, it has been widely used for different systems, such as atomic crystals, coordination compound clusters, and organic and inorganic small molecules. The details of the analyses are as follows. Monosynaptic basins represent lone pair electrons, whereas disynaptic basins belong to covalent interactions. ELF shaded surfaces with projection maps and contour line maps corresponding to the lowest-energy minima and transition states involved in the pathways are presented in Fig. 3.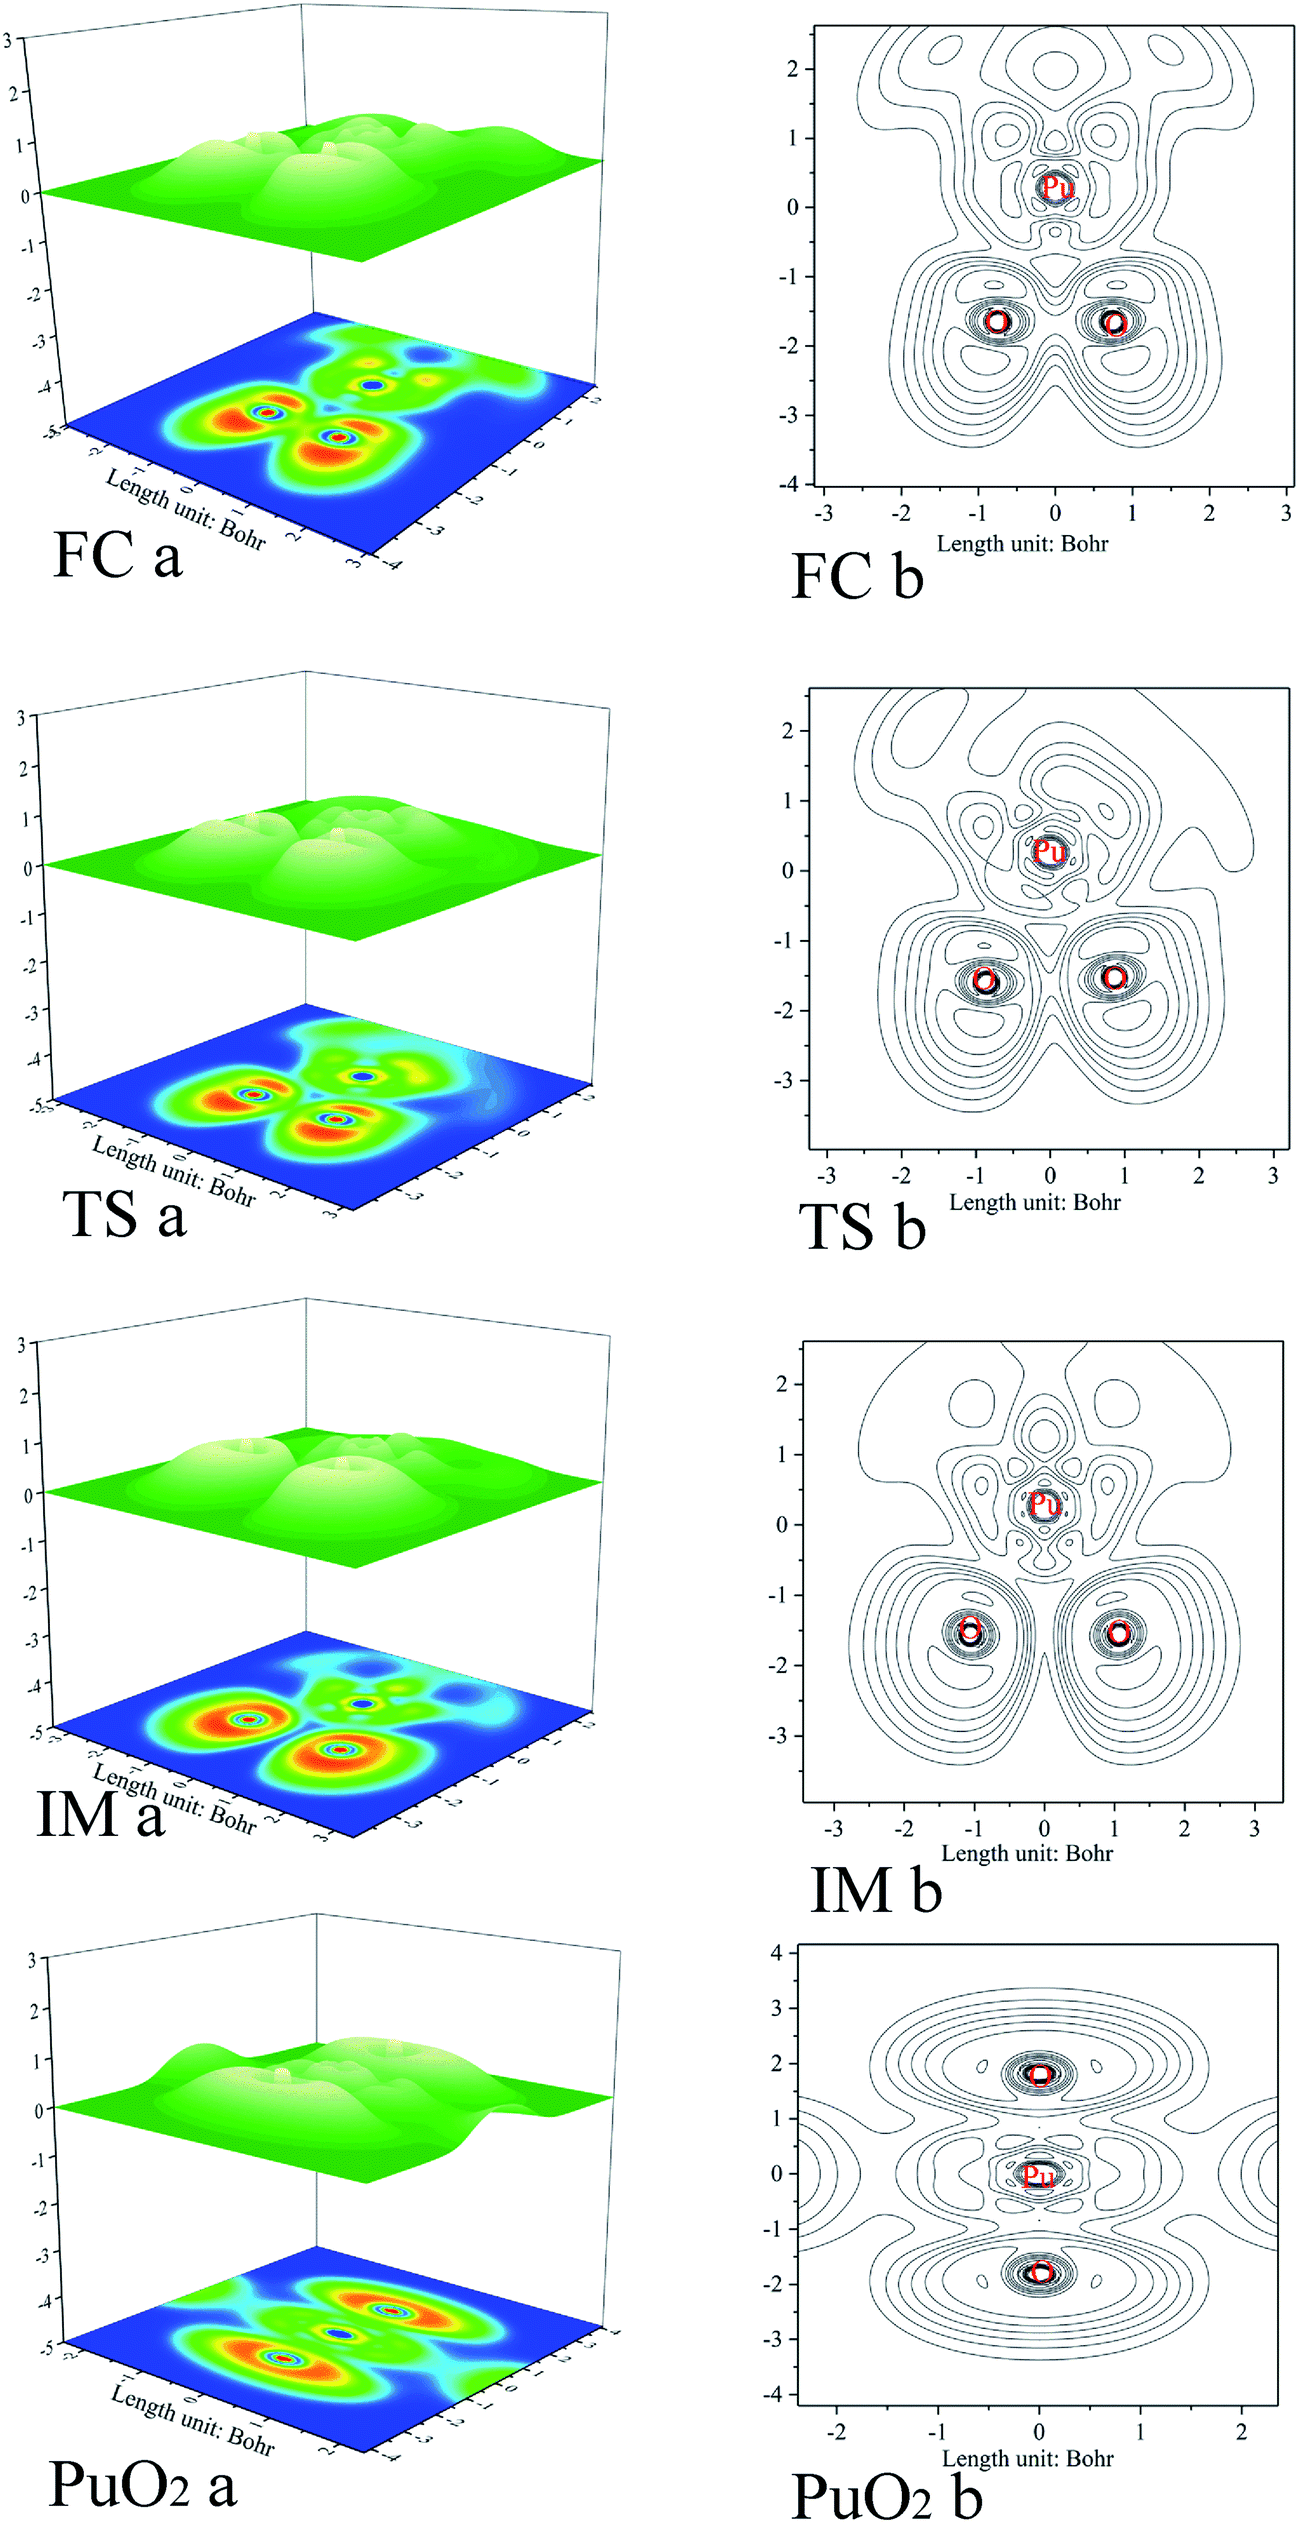 | ||
| Fig. 3 ELF shaded surface maps with projections and contour line maps of stationary points on the Pu + O2 → PuO2 reaction pathway: (a) shaded surface map with projection; and (b) contour line map. | ||
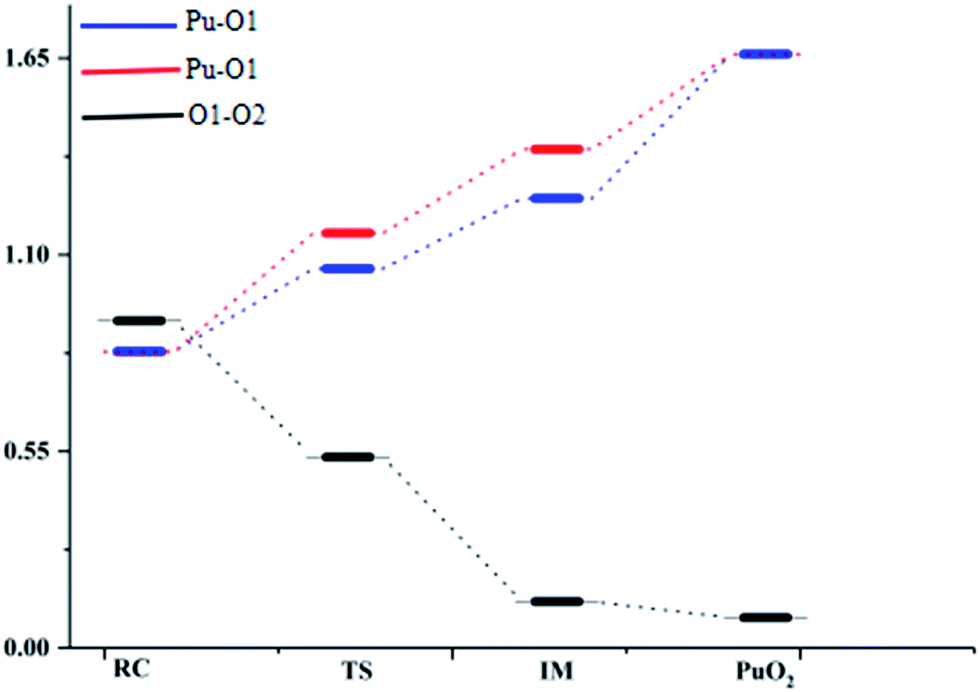
The ELF description of the first complex RC shows an absence of a trisynaptic valence basin between Pu and the O2 molecule. This fact indicates that there is no covalent character in the Pu–O interaction, which confirms that the interaction could be considered as an electrostatic interaction. ELF topological analyses of the TS structure shows that the O–O bond breaking takes place at this stage, which is evidenced by the weakening of the V(O, O) basin (see Fig. 3), which is replaced by the trisynaptic V(Pu, O, O) basin, indicating that the electrons begin to locally concentrate among the plutonium and oxygen. Meanwhile, the O1–O2 distance is lengthened from 1.265 Å to 1.669 Å. The ELF analysis clearly indicates that the Pu atom and the oxygen molecule interact with each other and the O–O bond is broken going from the RC structure to the IM structure. After the breaking of the O–O bond, Pu may keep close to O–O. As the electron densities between the Pu atom and the O1 atom, Pu atom and O2 atom are further increased, Pu–O1 and Pu–O2 show a strong covalent interaction when the IM structure forms. There is a strengthening of the trisynaptic V(Pu, O, O) valence basin, giving rise to the absence of a disynaptic V(O, O) basin, which proves that the breakage of the O–O bond and the formation of the Pu–O bond occur at this stage. In the case of the final product O–Pu–O, ELF analyses show that the linear V(Pu, O, O) trisynaptic valence basin is formed from the isomerization of the V(Pu, O, O) valence basin that belongs to the IM structure.
Mayer bond order analyses corroborate the formation of new covalent Pu–O1 and Pu–O2 bonds, with a significant value of 1.67 (Fig. 4). Furthermore, stronger interactions between the Pu atom and the two O atoms enhance delocalization between the O1 atom and the O2 atom. As a result, the O–O bond is completely broken, with the O–O bond having a Mayer bond order value of about 0.0. As is shown in the ELF maps in Fig. 3 (IM a), there is a high degree of synchronization between O–O bond breaking and Pu–O1 and Pu–O2 bond formation in the formation of the IM structure.
 | ||
| Fig. 4 Mayer bond orders for the minima and transition states along the pathway of O2 reacting with plutonium. A Mayer bond order lower than the default threshold of 0.05 is regarded as zero. | ||
The ELF maps shown in Fig. 3 and the Mayer bond order map shown in Fig. 4 show that the higher the ELF value, the higher the value of the Mayer bond order. With a decrease in the corresponding atomic distance, both the ELF value and Mayer bond order increase, and vice versa. Both ELF analyses and the Mayer bond order provide a good description of the O–O bond breaking and the Pu–O1 and Pu–O2 bond formation processes in the reaction.
3.3 Density of states
The most important application of density of states figures is to exhibit molecular orbital (MO) compositions and their contributions to chemical bonding through OPDOS plots. The OPDOS shows the non-bonding, anti-bonding and bonding interactions of two orbitals, atoms or groups. The densities of states of the title compounds were analyzed using the Multiwfn program. The discrete energy levels of the isolated system were broadened artificially to a curve by the Multiwfn program. The TDOS, PDOS, and OPDOS were calculated with the purpose of getting more information about the roles that the 5f electrons and 5f orbitals play in plutonium species. As we know that the 5f orbitals are relatively spread out and are close to the 7s atomic valence orbital, this may increase the size of the activation barrier.The TDOS, PDOS, and OPDOS for all plutonium species are plotted in Fig. 5. The curve for the TDOS was simulated based on the distribution of the MO energy levels. The orbitals are molecular orbitals (MOs); fragment 1 is defined as the f-shells of plutonium (corresponding to 5f atomic orbitals), and fragment 2 is defined as an oxygen atom; both the original and broadened TDOS/PDOS/OPDOS are shown in Fig. 5. The vertical dashed line indicates the position of the HOMO orbital. For the dashed curve (i.e., the OPDOS lines), values of the corresponding density-of-states greater than or less than zero respectively denote corresponding MOs that are conducive or not conducive to the formation of a chemical bond between plutonium 5f-orbitals and oxygen atoms. These conclusions can be confirmed further through observing the isosurfaces of the corresponding MOs. Fig. 5 shows that, from the PDOS, it is clear that the oxygen molecule contributes the most to the valence MOs over the range from −200 kcal mol−1 to −100 kcal mol−1. As a result, we can conclude that oxygen atomic orbitals contribute significantly to the corresponding molecular orbitals. For the whole pathway, over the range from −100 kcal mol−1 to −50 kcal mol−1, there are comparable contributions from oxygen and plutonium 5f, except for in the IM structure. At the position of the HOMO level, the 5f orbitals of the plutonium atom approach the TDOS line, which means that most of the contribution to the HOMO comes from the plutonium atom 5f orbitals. The different contributions from fragment 1 and fragment 2 lead to the diverse total density of states.
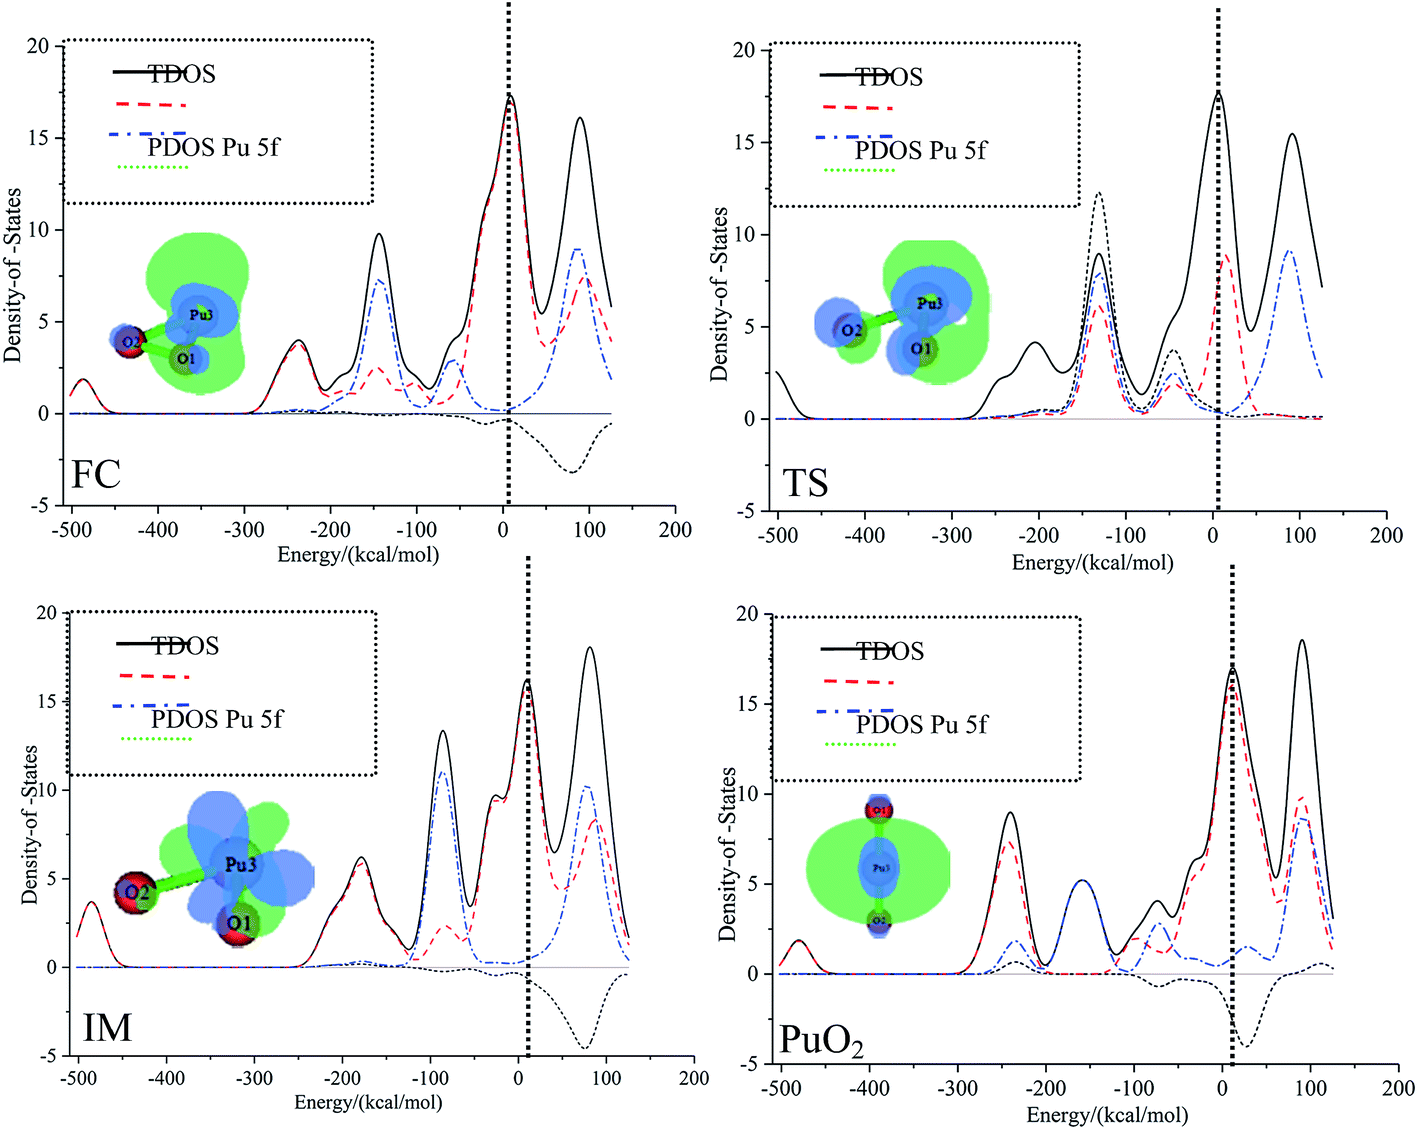 | ||
| Fig. 5 The TDOS, PDOS, and OPDOS curves for all special points in the reaction of Pu + O2 → PuO2 computed at the PW91/SDD levels of theory. | ||
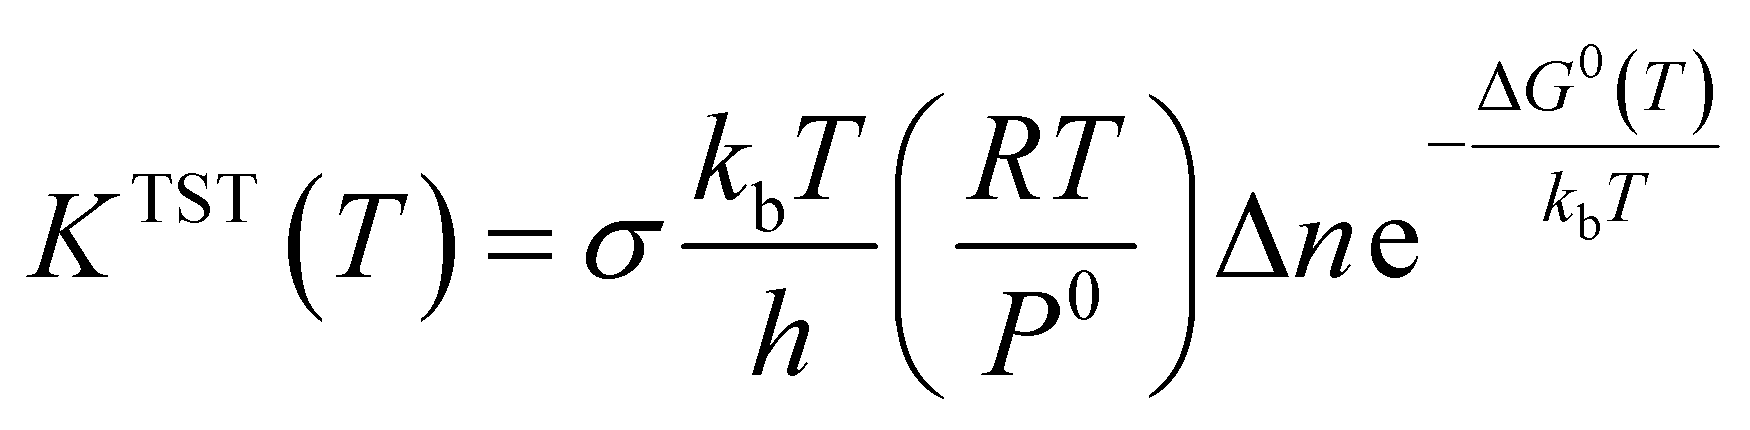
3.4 Reaction rate coefficients
In this section, rate constant calculations were carried out using VTST, using KiSThelP. The rate constants are calculated over the 298 to 1000 K temperature range based on the optimized geometric structures. Commonly, the rate constant for a gas-phase reaction is obtained using the following expression,where ΔG0(T) represents the standard Gibbs free energy of activation for the considered reaction, kb is Boltzmann's constant, T is temperature, Δn = 1 or 0 for gas-phase bimolecular or unimolecular reactions, P is the pressure, P0 = 1 bar, h is Planck's constant, and σ is the reaction path degeneracy, respectively. This provides a quick and convenient way of predicting the temperature dependence of rate constants over the selected range. One-dimensional tunneling and variational effects have also been incorporated in TST calculations as used by Wigner. By choosing VTST including Wigner tunnelling effects, one can then compare several levels of theory on the same plot. In KiSThelP, one-dimensional quantum mechanical effects on reaction coordinate motion are included through a transmission coefficient χ(T), so that: kTST/T(T) = χ(T) × kTST(T), where TST/T denotes TST incorporated tunnelling corrections. The Wigner correction59 can be applied only based on the imaginary frequency Im(ν), which describes the reaction mode through the relational expression:
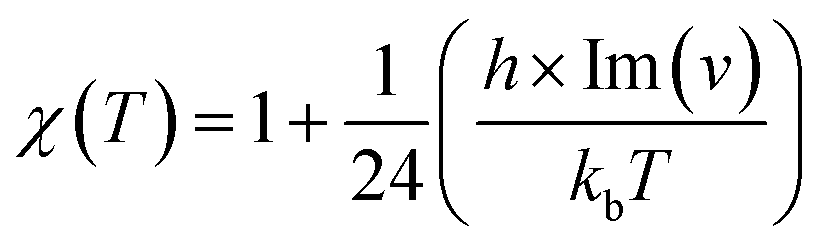
The rate constants for all the reaction pathways between 298 and 500 K are listed in Table 3. As shown in Table 3, the order of magnitude of the rate constants for the pathway is 10−11 s−1. It can be seen from the table that Wigner tunnelling effects are obvious. It is significant to draw some conclusions about the relative process from the temperature dependence of the rate constants. The computed rate constant k changes with temperature T and log_10k versus 1/T plots for Pu + O2 are depicted in Fig. 6. The black line represents kVTST values, while the red line represents kVTST/Wigner values. As shown in Fig. 6, the kVTST values are very different from the kVTST/Wigner values in the case of TS, suggesting that tunneling effects are generally large for the reactions considered. In addition, the temperature is linear with the reaction rate constant, as shown in experiments.28 As demonstrated in Fig. 6, the log_10k versus 1/T plots show a more clear difference in the relatively low T region. On the contrary, plots of k varying with T are more likely to reflect differences in the relatively high T region for the same reaction process.
| T | RC → TS → IM | |
|---|---|---|
| k(VTST) | k(VTST/Wigner) | |
| 298 | 1.325 × 10¹¹ | 2.669 × 10¹¹ |
| 300 | 1.367 × 10¹¹ | 2.736 × 10¹¹ |
| 330 | 2.096 × 10¹¹ | 3.830 × 10¹¹ |
| 360 | 3.003 × 10¹¹ | 5.090 × 10¹¹ |
| 390 | 4.083 × 10¹¹ | 6.501 × 10¹¹ |
| 420 | 5.325 × 10¹¹ | 8.044 × 10¹¹ |
| 450 | 6.714 × 10¹¹ | 9.700 × 10¹¹ |
| 480 | 8.235 × 10¹¹ | 1.145 × 10¹² |
| 510 | 9.871 × 10¹¹ | 1.329 × 10¹² |
 | ||
| Fig. 6 Computed VTST rate constants and temperature plots obtained using PW91/SDD energies and frequencies: k versus T (left) and log_10k versus 1/T (right) for path 1. | ||
3.5 Dynamics
An ab initio molecular dynamics simulation technique is developed, employing the Born–Oppenheimer approach in the framework of a Gaussian implementation of Kohn–Sham density functional theory. Simulation results for the Pu + O2 reaction are reported.To obtain the detailed reaction process of the title reaction, the molecular dynamics (MD) of the Pu + O2 reaction were simulated using classical trajectory calculations. The previous discussion has shown that the PW91/SDD level of theory is suitable and practical for simulating the molecular dynamics (MD) of the title reaction. Although a more clear description of the molecular dynamics could be got using higher levels of theory, the PW91/SDD level is a reasonable method that compromises between computational accuracy and efficiency. 304 reaction trajectories for path 1 were carried out in the present calculations. In fact, we actually calculated around 600 trajectories for each path, but 49.3% of those trajectories didn't reach the final product.
The formation of the initial RC complex is quite exothermic, and TS lies 70 kcal mol−1 below the reactants, Pu + O2. Since an additional 10 kcal mol−1 is released in the formation of the IM intermediate from TS, at least 80 kcal mol−1 is available for the reaction. As a result, calculations of the trajectories were initiated with 80 kcal mol−1 extra energy, ensuring that most of the trajectories reached the products. We calculated trajectories starting with the transition state because very few trajectories reached the products when the barrier was greater than 5 kcal mol−1. In addition, the trajectories were computationally intensive and our calculations used more than 2 years of CPU time in total.
The number of decomposition paths was set to zero for all BOMD trajectory calculations. Since the Pu + O2 reaction belongs to the combination reaction class, we set the three atoms as the same fragment. In addition, there are four termination criteria. Firstly, the maximum distance between any atom and the center of mass was set at less than 100 bohr. Secondly, the maximum distance between any two atoms in the same fragment was less than 100 bohr, which is the same as last one. Thirdly, we set the gradient of the fragment as less than 10−5. Finally, we set the atomic distance between O1 and O2 at larger than 7.0 bohr.
Typical snapshots along the BOMD trajectory and the corresponding time-evolution of the potential energy are presented in Fig. 7 and 8. The time of this trajectory is 56.72 fs, close to the average time of all trajectories (42.39–59.24 fs). It is seen that the product is formed in about 52 fs.
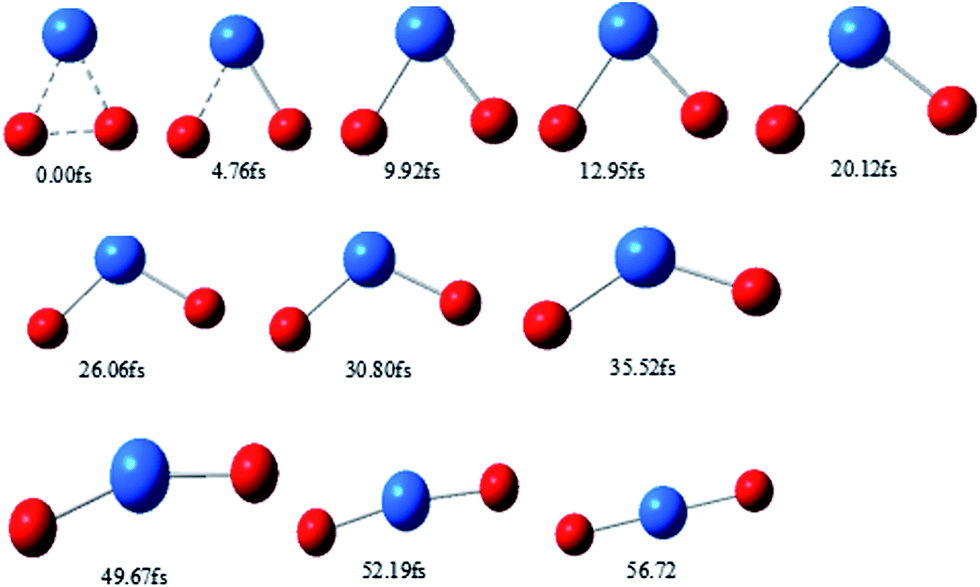 | ||
| Fig. 7 Snapshots of typical trajectories along the pathway. | ||
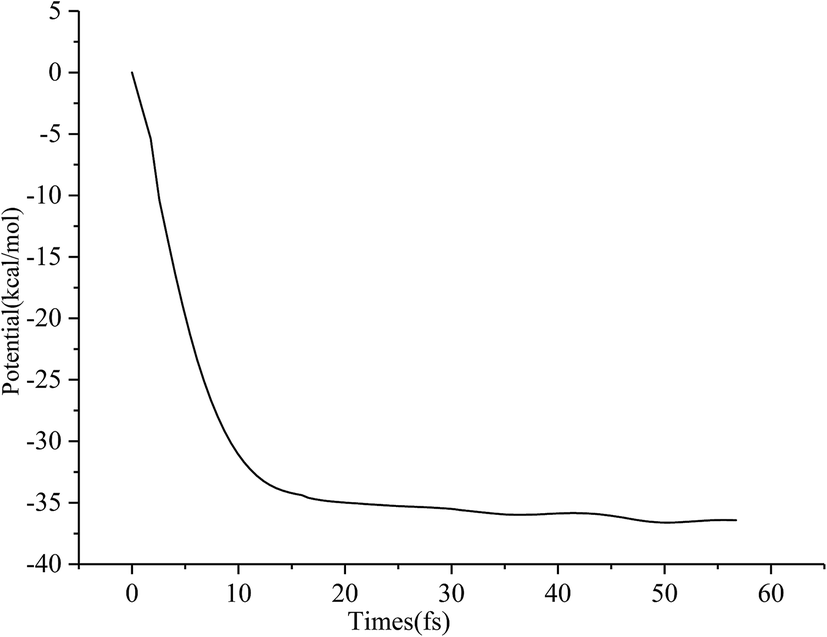 | ||
| Fig. 8 The time-evolution of the potential energy corresponding to TS → PuO2. | ||
The total product energy distributions for the reaction are presented in Fig. 9: (a) shows the rotational energy of PuO2; (b) shows the vibrational energy of PuO2; and (c) shows the internal energy of PuO2.
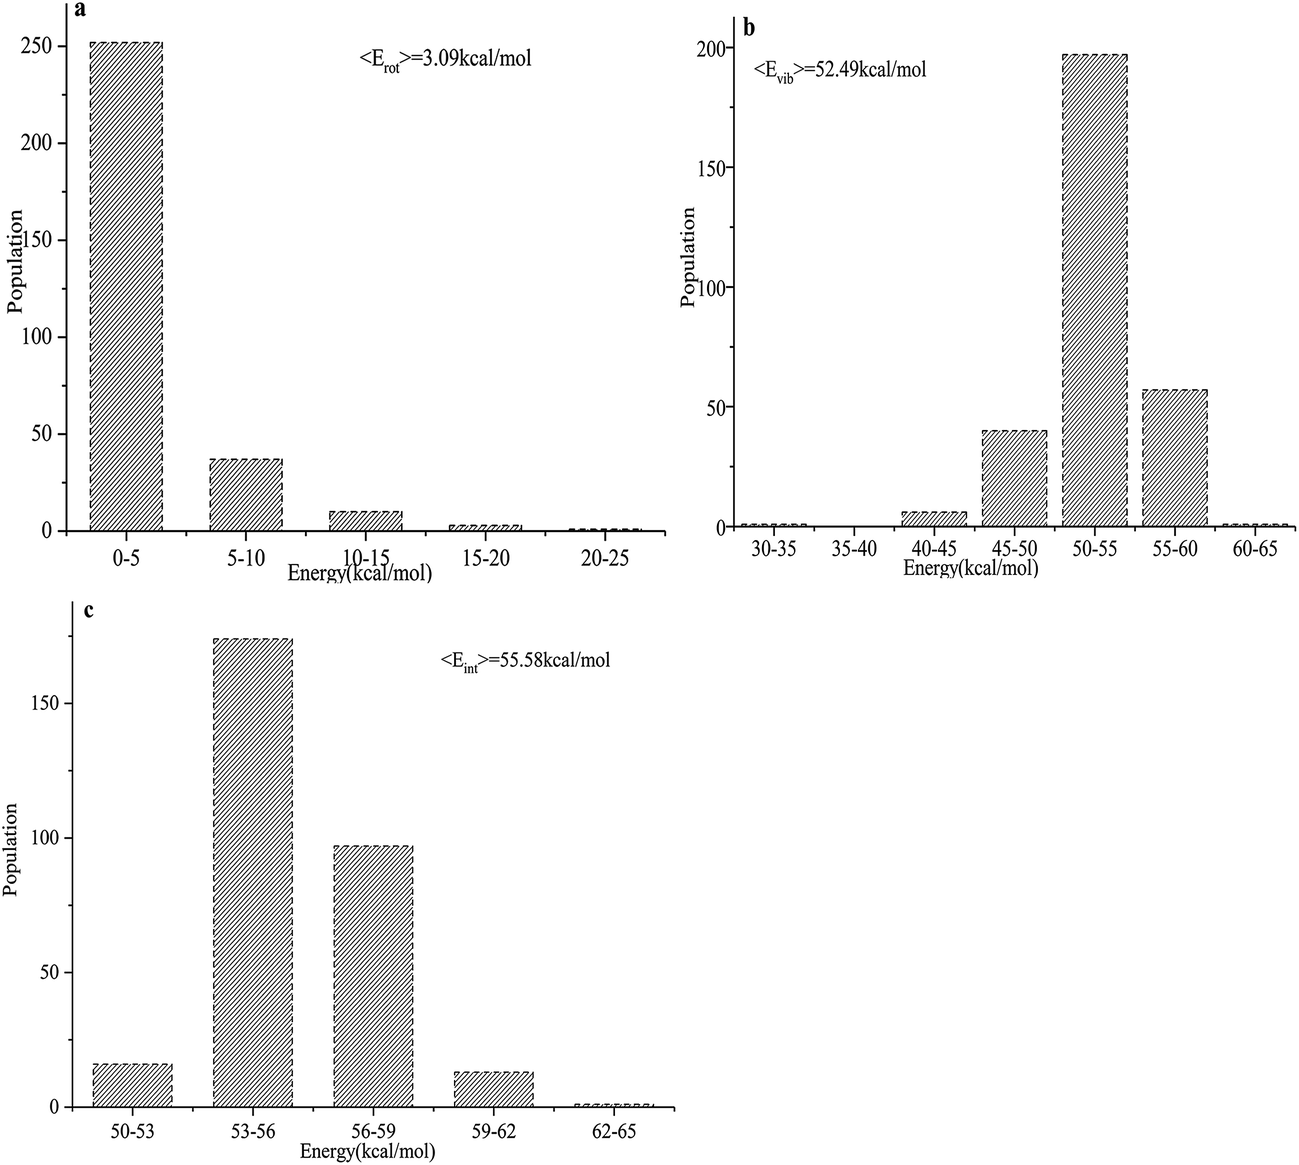 | ||
| Fig. 9 (a–c) Product energy distributions for the title reaction: (a) the rotational energy of PuO2; (b) the vibrational energy of PuO2; and (c) the internal energy of PuO2. | ||
It is seen that the internal energies of PuO2 are distributed from 50 to 65 kcal mol−1, with the peak being at around 53–56 kcal mol−1. The vibrational energies have a wide distribution ranging from 30–65 kcal mol−1, and the averaged value is 52.49 kcal mol−1. The PuO2 rotational energies are seen to range from 0–25 kcal mol−1 and the peak is around 0–5 kcal mol−1. The average available energy calculated using BOMD for the reaction is 55.58 kcal mol−1. To sum up, about 5.56% of the available energy went into the rotational energies of PuO2. The vibrational energy of PuO2 accounts for about 94.44% of the available energy, which is consistent with the analyses of the potential energy surfaces.
4 Conclusions
In this work, we have investigated the interaction between a Pu atom and an O2 molecule. The structures, densities of states and vibrational frequencies of species involved in this system have been obtained. In addition, we have reported the reaction rate using VTST with one-dimensional tunneling effects (Wigner) at elevated temperatures (T = 298–1000 K). The conclusions from the presented results are as follows:(1) The reaction pathway is identified for the Pu + O2 → O–Pu–O reaction.
| Pathway: Pu + O2 → RC → TS → IM → O–Pu–O |
The potential energy surface is attractive, with the characteristic that energy is released during the approach of reactants. Most of the energy released transforms into vibrational energy in the reaction product.
(2) The bonding nature is analyzed using ELF and PDOS, TDOS, OPDOS calculations. The ELF analyses provide a distinct description of the bonding evolution along the reaction pathway. They demonstrate the process of the activation of the O–O bond. In the ELF analyses, all the special structures along the pathway are characterized through the covalent character between the Pu atom and the O atoms. Meanwhile, the DOS calculation results indicate that the most of the contributions to the HOMO come from the 5f orbitals of the plutonium atom.
(3) Analyses of reaction rate constants reveal that Wigner tunnelling effects are important for the reaction pathway.
(4) To get accurate energy distributions for the reaction, we computed direct classical trajectory calculations using the BOMD method. The computed results demonstrated that most of the available energy appears as vibrational energy in the products. The average available energy estimated for the title reaction was 55.58 kcal mol−1 and on average 3.09 (5.56%) and 52.49 (94.44%) kcal mol−1 are partitioned into rotational energy in PuO2 and vibrational energy in PuO2, respectively, which is consistent with analyses of the potential energy surfaces.
Atmospheric plutonium oxide forms new particles, and such particles play a significant role in the corrosion of plutonium. Consequently, this work could help to promote our understanding of the plutonium cycle in the atmosphere. The mechanism described herein also provides new insight into cost-effective and efficient methods of plutonium migration, which are based on the precise reaction pathway.
Acknowledgements
This research was supported by the National Natural Science Foundation of China (Grant No. 11364023). We are very grateful to Dr Sobereva for many helpful discussions. We are also very grateful to the Center of High Performance Computing at the Physics Discipline of Sichuan University for providing computer time.References
- J. K. Gibson and J. Marçalo, Coord. Chem. Rev., 2006, 250, 776–783 CrossRef CAS.
- J. K. Gibson, R. G. Haire, M. Santos, J. Marçalo and A. Pires de Matos, J. Phys. Chem. A, 2005, 109, 2768–2781 CrossRef CAS PubMed.
- M. C. Michelini, N. Russo and E. Sicilia, Angew. Chem., Int. Ed., 2006, 45, 1095–1099 CrossRef CAS PubMed.
- M. C. Michelini, N. Russo and E. Sicilia, J. Am. Chem. Soc., 2007, 129, 4229–4239 CrossRef CAS PubMed.
- G. Mazzone, M. C. Michelini, N. Russon and E. Sicilia, Inorg. Chem., 2008, 47, 2083–2088 CrossRef CAS PubMed.
- J. T. Lyon, L. Andews, P. Malmqvist, B. O. Roos, T. Yang and B. E. Bursten, Inorg. Chem., 2007, 46, 4917–4925 CrossRef CAS PubMed.
- B. O. Roos, P. A. Malmqvist and L. Gagliardi, J. Am. Chem. Soc., 2006, 105, 17000–17006 CrossRef PubMed.
- J. K. Gibson, R. G. Haire, J. Marcalo, M. Santos, J. P. Leal, A. Pires de Matos, R. Tyagi, M. K. Mrozik, R. M. Pitzer and B. E. Bursten, Eur. Phys. J. D, 2007, 45, 133–138 CrossRef CAS.
- J. K. Gibson, Int. J. Mass Spectrom., 2002, 214, 1–21 CrossRef CAS.
- J. K. Gibson and R. G. Haire, Inorg. Chem., 2002, 41, 5897–5906 CrossRef CAS PubMed.
- J. K. Gibson and R. G. Haire, Radiochim. Acta, 2003, 91, 441–448 CrossRef CAS.
- J. K. Gibson and R. G. Haire, Organometallics, 2005, 24, 119–126 CrossRef CAS.
- M. Santos, J. Marçalo, J. P. Leal, A. Pires de Matos, J. K. Gibson and R. G. Haire, Int. J. Mass Spectrom., 2003, 228, 457–465 CrossRef CAS.
- M. Santos, J. Marçalo, A. Pires de Matos, J. K. Gibson and R. G. Haire, J. Phys. Chem. A, 2002, 106, 7190–7194 CrossRef CAS.
- H. H. Cornehl, R. Wesendrup, M. Diefenbach and H. Schwarz, Chem.–Eur. J., 1997, 3, 1083–1090 CrossRef CAS.
- J. K. Gibson, R. G. Haire, J. Marçalo, M. Santos, A. Pires de Matos, M. K. Mrozik, R. M. Pitzer and B. E. Bursten, Organometallics, 2007, 26, 3947–3956 CrossRef CAS.
- C. Heinemann, H. H. Cornehl and H. Schwarz, J. Organomet. Chem., 1995, 501, 201–209 CrossRef CAS.
- J. Marçalo, J. P. Leal and A. Pires de Matos, Int. J. Mass Spectrom., 1996, 157, 265–274 CrossRef.
- J. Marçalo, J. P. Leal, A. Pires de Matos and A. G. Marshall, Organometallics, 1997, 16, 4581–4588 CrossRef.
- G. P. Jackson, F. L. King, D. E. Goeringer and D. C. Duckworth, J. Phys. Chem. A, 2002, 106, 7788–7794 CrossRef CAS.
- G. P. Jackson, J. K. Gibson and D. C. Duckworth, Int. J. Mass Spectrom., 2002, 220, 419–441 CrossRef CAS.
- G. P. Jackson, J. K. Gibson and D. C. Duckworth, J. Phys. Chem. A, 2004, 108, 1042–1051 CrossRef CAS.
- M. E. Alikhani, M. C. Michelini, N. Russo and B. Silvi, J. Phys. Chem. A, 2008, 112, 12966–12974 CrossRef CAS PubMed.
- G. Mazzone, M. C. Michelini, N. Russo and E. Sicilia, Inorg. Chem., 2008, 47, 2083–2088 CrossRef CAS PubMed.
- M. Santos, A. Pires de Matos, J. Marc-alo, J. K. Gibson, R. G. Haire, R. Tyagi and R. M. Pitzer, J. Phys. Chem. A, 2006, 110, 5751–5759 CrossRef CAS PubMed.
- J. K. Gibson, R. G. Haire, J. Marc-alo, M. Santos, A. Pires de Matos and J. P. Leal, J. Nucl. Mater., 2005, 344, 24–29 CrossRef CAS.
- J. K. Gibson, R. G. Haire, M. Santos, A. Pires de Matos and J. Marc-alo, J. Phys. Chem. A, 2008, 112, 11373–11381 CrossRef CAS PubMed.
- J. M. Haschke, T. H. Allen and J. L. Stakebake, J. Alloys Compd., 1996, 243, 23–35 CrossRef CAS.
- P. Li, W. X. Niu, T. Gao and H. Y. Wang, ChemPhysChem, 2014, 15, 3078–3088 CrossRef CAS PubMed.
- H. L. Yu, G. Li, H. B. Li, R. Z. Qiu, H. Huang and D. Q. Meng, J. Alloys Compd., 2016, 654, 567–573 CrossRef CAS.
- H. L. Yu, T. Tang, S. T. Zheng, Y. Shi, R. Z. Qiu, W. H. Luo and D. Q. Meng, J. Alloys Compd., 2016, 666, 287–291 CrossRef CAS.
- W. Niu, H. Zhang, P. Li and T. Gao, Int. J. Quantum Chem., 2015, 115, 6–18 CrossRef CAS.
- G. Mazzone, M. del C. Michelini, N. Russo and E. Sicilia, Inorg. Chem., 2008, 47(6), 2083–2088 CrossRef CAS PubMed.
- J. G. Małecki, Polyhedron, 2010, 29, 1973 CrossRef.
- A. D. Becke, J. Chem. Phys., 1993, 98, 1372–1377 CrossRef CAS.
- A. D. Becke, J. Chem. Phys., 1993, 98, 5648–5652 CrossRef CAS.
- A. D. Becke, Phys. Rev. A, 1988, 38, 3098–3100 CrossRef CAS.
- (a) C. Adamo and V. Barone, J. Chem. Phys., 1999, 110, 6158–6170 CrossRef CAS; (b) M. Ernzerhof and G. E. Scuseria, J. Chem. Phys., 1999, 110, 5029–5036 CrossRef CAS.
- J. P. Perdew, K. Burke and Y. Wang, Phys. Rev. B: Condens. Matter Mater. Phys., 1996, 54, 16533–16539 CrossRef CAS.
- J. Tao, J. P. Perdew, V. N. Staroverov and G. E. Scuseria, Phys. Rev. Lett., 2003, 91, 146401 CrossRef PubMed.
- C. Lee, W. Yang and R. G. Parr, Phys. Rev. B: Condens. Matter Mater. Phys., 1988, 37, 785–789 CrossRef CAS.
- R. Krishnan, J. S. Binkley, R. Seeger and J. A. Pople, J. Chem. Phys., 1980, 72, 650–654 CrossRef CAS.
- J.-P. Blaudeau, M. P. McGrath, L. A. Curtiss and L. Radom, J. Chem. Phys., 1997, 107, 5016–5021 CrossRef CAS.
- T. Clark, J. Chandrasekhar and P. V. R. Schleyer, J. Chem. Phys., 1983, 74, 294–301 Search PubMed.
- W. Kuchle, M. Dolg, H. Stoll and H. Preuss, J. Chem. Phys., 1994, 100, 7535–7542 CrossRef.
- P. Yang, I. Warnke, R. L. Martin and P. J. Hay, Organometallics, 2008, 27, 1384–1392 CrossRef CAS.
- X. Cao and M. Dolg, Coord. Chem. Rev., 2006, 250, 900–910 CrossRef CAS.
- K. Fukui, J. Phys. Chem., 1970, 74, 4161–4163 CrossRef CAS.
- A. Montoya, T. N. Truong and A. F. Sarofim, J. Phys. Chem. A, 2000, 104, 6108–6110 CrossRef CAS.
- M. J. Frisch, G. W. Trucks, H. B. Schlegel, G. E. Scuseria, M. A. Robb, J. R. Cheeseman, G. Scalmani, V. Barone, B. Mennucci, G. A. Petersson, H. Nakatsuji, M. Caricato, X. Li, H. P. Hratchian, A. F. Izmaylov, J. Bloino, G. Zheng, J. L. Sonnenberg, M. Hada, M. Ehara, K. Toyota, R. Fukuda, J. Hasegawa, M. Ishida, T. Nakajima, Y. Honda, O. Kitao, H. Nakai, T. Vreven, J. A. Montgomery Jr, J. E. Peralta, F. Ogliaro, M. Bearpark, J. J. Heyd, E. Brothers, K. N. Kudin, V. N. Staroverov, R. Kobayashi, J. Normand, K. Raghavachari, A. Rendell, J. C. Burant, S. S. Iyengar, J. Tomasi, M. Cossi, N. Rega, J. M. Millam, M. Klene, J. E. Knox, J. B. Cross, V. Bakken, C. Adamo, J. Jaramillo, R. Gomperts, R. E. Stratmann, O. Yazyev, A. J. Austin, R. Cammi, C. Pomelli, J. W. Ochterski, R. L. Martin, K. Morokuma, V. G. Zakrzewski, G. A. Voth, P. Salvador, J. J. Dannenberg, S. Dapprich, A. D. Daniels, Ö. Farkas, J. B. Foresman, J. V. Ortiz, J. Cioslowski and D. J. Fox, Gaussian 09 (Revision A.02), Gaussian, Inc, Wallingford CT, 2009 Search PubMed.
- T. Lu and F. Chen, J. Comput. Chem., 2012, 33, 580–592 CrossRef CAS PubMed.
- A. D. Becke and K. E. Edgecombe, J. Chem. Phys., 1990, 92, 5397–5403 CrossRef CAS.
- A. Savin, R. Nesper, S. Wengert and T. R. Fassler, Angew. Chem., Int. Ed. Engl., 1997, 36, 1808–1832 CrossRef CAS.
- R. J. Gillespie, E. A. Robinson and N. Gilbert, J. Comput. Chem., 2007, 28, 87–97 CrossRef CAS PubMed.
- T. Lu and F. Chen, Acta Phys.-Chim. Sin., 2011, 27, 2786–2792 CAS.
- S. Canneaux, F. Bohr and E. Henon, J. Comput. Chem., 2014, 35, 82–93 CrossRef CAS PubMed.
- (a) A. D. Becke and K. E. Edgecombe, J. Chem. Phys., 1990, 92, 5397–5405 CrossRef CAS; (b) X. Li, J. Mol. Model., 2012, 18, 1003 CrossRef CAS PubMed.
- W. Scherer, P. Sirsch, D. Shorokhov, M. Tafipolsky, G. S. McGrady and E. Gullo, Chem.–Eur. J., 2003, 9, 6057 CrossRef CAS PubMed.
- E. Wigner, J. Phys. Chem. B, 1932, 19, 203–216 Search PubMed.
Footnotes |
| † Project supported by the National Natural Science Foundation of China (Grant No. 11364023). |
| ‡ Electronic supplementary information (ESI) available: Movies of the ELF shaded surface maps with projections and contour line maps from Fig. 3 are in ESI (1) and (2); Movies of the trajectories from Fig. 7 and 8 are in ESI (3). See DOI: 10.1039/c7ra03745g |
| This journal is © The Royal Society of Chemistry 2017 |