
 Open Access Article
 This Open Access Article is licensed under a
 Creative Commons Attribution 3.0 Unported Licence
Bioreactors for low-pH iron(II) oxidation remove considerable amounts of total iron†
Yizhi Sheng *abc,
Bradley Kaleya,
Kyle Bibbyd,
Christen Grettenbergere,
Jennifer L. Macaladye,
Guangcai Wangb and
William D. Burgosa
*abc,
Bradley Kaleya,
Kyle Bibbyd,
Christen Grettenbergere,
Jennifer L. Macaladye,
Guangcai Wangb and
William D. Burgosa
aDepartment of Civil and Environmental Engineering, The Pennsylvania State University, 212 Sackett Building, University Park, PA 16802, USA
bSchool of Water Resources and Environment, China University of Geosciences, Beijing 100083, China. E-mail: shengyz@cugb.edu.cn
cSchool of Environment, Tsinghua University, Beijing 100084, China
dDepartment of Civil and Environmental Engineering, University of Pittsburgh, 709 Benedum Hall, Pittsburgh, Pennsylvania 15261, USA
eDepartment of Geosciences, The Pennsylvania State University, 503 Deike Building, University Park, PA 16802, USA
First published on 20th July 2017
Abstract
Low-pH Fe(II) oxidation occurs naturally in certain acid mine drainage (AMD) systems and can be incorporated into passive treatments by enhancing the development of terraced iron formations (TIFs). For extremely difficult-to-treat AMD (very low pH, high concentrations of Fe(II) and associated metals), an active treatment bioreactor may be required. Based on field studies of eight low-pH TIF sites in the Appalachian Bituminous Coal Basin, US, two sites that displayed the fastest and regional-average rates of Fe(II) oxidation were selected to enrich for Fe(II)-oxidizing microbes in chemostatic bioreactors with controlled geochemistry. After 74 to 128 days of fed-batch enrichment periods and a series of hydraulic residence time (HRT) experiments, four bioreactors (two for each site) were operated in flow-through mode through a series of pH set-points (pH 2.1 to 4.2; fixed [Fe(II)]in) or influent Fe(II) concentrations (80 to 2400 mg L−1; fixed pH) for an additional 52 to 138 days using site-specific anoxic AMD as influent. Fe(II) oxidation kinetics in bioreactors were remarkably similar from two sites that displayed significantly different field rates. Fe(II) oxidation rates were faster at high flow rate, low pH and high Fe(II) concentrations, consistent with field results. A three-parameter dual-Monod rate law was developed to describe Fe(II) oxidation kinetics solely based on pH and Fe(II) concentration, and agreed well with some other bioreactor and field studies. Importantly, these bioreactors also effectively removed total Fe at rates 7 to 20 times better than passive treatment settling ponds and TIFs sites, at optimal pH between 2.9 to 3.3. All of these results point to the promise of bioreactors enriched by natural-occurring acidophilic Fe(II)-oxidizing microbes for AMD treatment.
1. Introduction
Coal mine drainage (CMD) is a severe threat to the local environment in the Appalachian region of the eastern United States.1,2 Acidic Fe(II)-rich sources of CMD, referred to as acid mine drainage (AMD), occur when physical and chemical weathering of sulfides in mine ores facilitate proton releasing reactions.2–4 Treatment options for mine drainage depend on the water chemistry of the discharge. A decision tree for treatment options has been developed based primarily on acidity, concentration of metals (Fe, Al, Mn in Appalachian CMD), and dissolved oxygen (DO).5 Based on this decision tree, mine drainage with high-acidity, high-metals and low-oxygen is essentially classified as un-treatable. However, biologically-mediated low-pH Fe(II) oxidation can promote the oxidative precipitation of Fe(III) minerals (e.g., schwertmannite and goethite) and remove considerable amounts of total Fe.6–10 This process can take a high-acidity, high-metals discharge and effectively change it into a moderate-acidity (still low pH), low-metals discharge. These chemical transformations effectively produce mine water that can be re-classified as treatable by conventional technologies. This reclassification can be critical for watershed groups when applying for state or federal funds for reclamation of abandoned mine lands.We have measured rates of low-pH Fe(II) oxidation at several field sites in the Appalachian Bituminous Coal Basin and in the Iberian Pyrite Belt.8 Rates were measured across both natural terraced iron formations (TIFs) and ‘engineered’ TIFs. An engineered TIF is often just a lined channel that allows for shallow sheet-flow conditions. The fastest rates of Fe(II) oxidation were measured at the sites with lowest pH values. Field rates ranged from 16.0 × 10⁻⁷ to 97.0 × 10⁻⁷ mol Fe(II) L−1 s−1. Significant removal of total Fe occurred across these TIFs even though the pH values tended to decrease.
Rates of low-pH Fe(II) oxidation have also been measured in engineered bioreactors. Both suspended-growth and fixed-film bioreactor configurations have been used. Fixed-film configurations tend to maintain higher biomass concentrations compared to suspended-growth systems. Hedrich and Johnson10 designed an AMD remediation system that integrated low-pH Fe(II) oxidation and Fe removal in a multi-reactor system. The fastest rates of Fe(II) oxidation occurred in a suspended-growth bioreactor enriched with a pure culture of the Fe(II)-oxidizer Ferrovum myxofaciens. Heinzel et al.,11,12 Janneck et al.13 and Tischler et al.14 all measured Fe(II) oxidation rates in a pilot-scale bioreactor equipped with porous fixed-film media that developed a natural mixed community of Fe(II)-oxidizers, ultimately dominated by ‘Ferrovum-like’ species. Rates from these particular bioreactors ranged from 0.35 × 10⁻⁷ to 6.5 × 10⁻⁷ mol Fe(II) L−1 s−1.
Rates of low-pH Fe(II) oxidation measured in flow-through bioreactors have been exceptionally variable.10–18 Reported rates have ranged over three orders of magnitude, from 0.35 × 10⁻⁷ to 560 × 10−7 mol Fe(II) L−1 s−1. Much of this variation is caused by different operational conditions. For example, influent pH values have ranged from 1.25 to 5.80, influent Fe(II) concentrations have ranged from 56 to 25![[thin space (1/6-em)]](https://www.rsc.org/images/entities/char_2009.gif) 000 mg L−1, reactor temperatures have ranged from 13 to 33 °C, hydraulic residence times have ranged from 0.5 to 10 hours, microbial inoculum has varied from pure cultures to natural mixed communities, and biomass concentrations have ranged over four orders of magnitude (5.1 × 10⁴ to 7 × 10⁸ cell per mL).
000 mg L−1, reactor temperatures have ranged from 13 to 33 °C, hydraulic residence times have ranged from 0.5 to 10 hours, microbial inoculum has varied from pure cultures to natural mixed communities, and biomass concentrations have ranged over four orders of magnitude (5.1 × 10⁴ to 7 × 10⁸ cell per mL).
The objectives of this research were to develop generalized rate laws for biological low-pH Fe(II) oxidation, and optimize the hydrogeochemical conditions for both Fe(II) oxidation and total Fe removal in active treatment bioreactors. Based on previous field research, we selected two sites in the Appalachian Bituminous Coal Basin that displayed the fastest (Scalp Level) and regional-average (Brubaker Run) rates of Fe(II) oxidation. We enriched Fe(II)-oxidizing microbes from both sites and then used chemostatic bioreactors to measure Fe(II) oxidation and total Fe removal kinetics as a function of pH and influent Fe(II) concentration.
2. Methods and materials
2.1 Site description and sampling
Scalp Level is a small AMD spring (<0.5 L s−1) emanating from an abandoned underground coal mine (Mine #29 in Scalp Level, PA). The AMD flows quickly down a narrow scoured channel on a steep hillside adjacent to a large area of un-reclaimed mine spoils. In addition to fast rates of Fe(II) oxidation, Scalp Level is unique because the pH of the water increases as it travels across the site. The rates of Fe(II) oxidation measured at Brubaker Run were very close to the average for the whole Appalachian region. Brubaker Run is a large discharge (∼9.5 L s−1) emanating from an abandoned underground clay mine (Dean Clay Mine near Dean, PA). Surface coal mines located above the Dean Clay Mine breached the roof of the clay mine such that it now serves as the discharge location of acidic coal mine drainage. The AMD flows downhill in a highly uncontrolled multi-directional manner forming a large TIF (6000 m2). Site information (Table 1) and photographs (Fig. S1) are provided in the ESI.†| Parameter | Scalp Level | Brubaker Run |
|---|---|---|
| a Values represent mean ± one standard deviation for n sampling events. | ||
| Latitude/longitude | 40°14′43.72′′N | 40°37′1.42′′N |
| 78°51′33.18′′W | 78°28′35.76′′W | |
| Temp (°C) | 13.3 ± 0.67 | 11.0 ± 0.26 |
| DO (mg L−1) | 0.06 ± 0.05 | 0.06 ± 0.05 |
| ORP (mV) | 386 ± 39 | 348 ± 37 |
| Conductivity (μS cm−1) | 2010 ± 24 | 1690 ± 236 |
| pH | 2.89 ± 0.08 | 3.37 ± 0.15 |
| Dissolved total Fe (mg L−1) | 97.4 ± 9.43 | 118 ± 27.9 |
| Dissolved Fe(II) (mg L−1) | 92.3 ± 11.9 | 114 ± 28.4 |
| SO42− (mg S L−1) | 429 ± 34 | 381 ± 89 |
| Mean acidity (mg L−1 as CaCO3) | 357 | 360 |
| k1st,field (min−1) | 0.465 ± 0.029 | 0.070 ± 0.032 |
| RZero,field (mol L−1 s−1) × 10−7 | 97.0 ± 28.3 | 16.0 ± 6.10 |
| n | 3 | 5 |
Sediment samples were collected from each site as sources for Fe(II)-oxidizing microbes. Sediments were collected from the bottom of pools along the AMD flow paths. Sediments were collected downstream of the artesian discharges where the AMD had become well aerated. Sediments were collected by carefully cutting and prying out intact pieces from the top 2 cm of the stream bed. Sediments were transported to the lab and stored at 4 °C for no longer than one week before use.
Water was collected from each site for microbial enrichments and as influent to the bioreactors. Water was collected from the anoxic artesian springs in 12 to 50 L plastic containers. Containers were filled with little or no headspace. A total of 400 to 500 L of water were collected per collection trip (every 10 to 15 d) – enough water to operate the bioreactors for two weeks. Immediately upon arrival to the lab, all water was filtered (0.2 μm sterile bottle-top filters) into plastic containers, sparged with N2, wrapped in Al foil, and stored at 4 °C. Water was stored for no longer than one week before use.
2.2 Enrichment of Fe(II)-oxidizing microbes
Mixed cultures of naturally-occurring microbes were enriched from the sediments from each site before any flow-through experiments were conducted. To develop enrichment cultures, 100 g of moist sediment was mixed with 1 L of 0.1% (m/v) sodium pyrophosphate (adjusted to pH 3.5 with sulfuric acid). This suspension was stirred at 400 rpm for 30 min to separate cells from the sediment.19 After 30 min, the suspension was allowed to settle and then 900 mL of the cell-containing supernatant was poured into a sterile 3 L chemostat reactor vessel (Eppendorf BioFlo®/Celligen® 115 Fermentor). The volume of the liquid in the chemostat was increased to 2.0 L by adding filtered site water. During this time the pH set-point of the chemostats were pH 2.7 for the Scalp Level chemostat or pH 2.9 for the Brubaker Run chemostats, the stirring rate was 50 rpm, and the temperature was 20 °C. The headspace of the reactor was open to the ambient atmosphere and air was continuously sparged into the water. Ferrous sulfate (FeSO4·7H2O) was discontinuously added to the reactor as the primary substrate to enrich for Fe(II)-oxidizing microbes whenever the dissolved Fe(II) concentration decreased below 30 mg L−1.After a common fed-batch enrichment period (80 d for Scalp Level; 30 d for Brubaker Run), each enrichment culture was divided for the pH-series and the Fe(II)-series experiments. The pH-series reactor was operated in fed-batch mode for an additional 17 d (97 d total) in Scalp Level and 44 d (74 d total) in Brubaker Run, and the Fe(II)-series reactors was operated in fed-batch mode for an additional 48 d (128 d total) in Scalp Level and 83 d (113 d total) in Brubaker Run. Automated control components of the bioreactors maintained a constant pH, temperature and mixing speed, and continuously recorded DO. Feedback controls between the pH meter in the reactor and two peristaltic pumps delivering either 0.2 N H2SO4 or 0.2 N NaOH were used to maintain any desired pH set-point. The reactor control system also recorded the rate and volume of titrant (H2SO4, NaOH) addition. A one-pass, tap water-fed, cooling coil within the reactor and a thermal jacket around the reactor were used to maintain the reactor temperature.
2.3 Fe(II) oxidation in flow-through bioreactors
During all flow-through experiments, the influent water tank was wrapped in Al foil and continuously purged with 100% N2(g), and FeSO4 was added to yield the desired influent dissolved Fe(II) concentration. A peristaltic pump conveyed the influent through the reactor and maintained the desired hydraulic residence time (HRT). All reactor control components were initially unchanged from the fed-batch mode. For each operational set-point, the bioreactor was operated until it achieved a pseudo-steady state condition with respect to maintaining a near-constant ratio of effluent to influent dissolved Fe(II) concentrations (within ±5% of the final sampling event for each geochemical-series). The operational set-point was then incrementally and sequentially changed and the system was allowed to establish a new steady-state condition.Preliminary experiments were conducted to evaluate the effect of HRT on bioreactor performance. Experiments began at the longest HRT (24 h) to better provide for the adaptation from fed-batch to flow-through conditions (e.g., to minimize cell washout). The HRTs were sequentially decreased from 24 to 12, 6, 3, 1, 0.75 and 0.5 h. The operating time for each HRT set-point ranged from 5 to 10 pore volumes. For some system variables (e.g., HRT with the Brubaker Run bioreactor) we chose to sequentially “reverse” the set-points of the bioreactor to evaluate how reactor performance would recover and whether the steady state conditions would be repeatable. All subsequent flow-through experiments were conducted at an HRT of 6 h.
The pH-series experiments began at the pH of enrichment (pH 2.7 for the Scalp Level bioreactor; pH 2.9 for the Brubaker Run bioreactor). For the Scalp Level bioreactor, the pH set-points varied sequentially from pH 2.7 to 2.4, 2.1, 2.4, 2.7, 3.0, 3.3, 3.6, 3.9 and 4.2. For the Brubaker Run bioreactor, the pH set-points varied sequentially from pH 2.9 to 2.6, 2.3, 2.6, 2.9, 3.2, 3.5, 3.8, 4.1, 3.8 and 3.5. The influent Fe(II) concentrations averaged 293 ± 28.1 mg L−1 in the Scalp Level bioreactor and 309 ± 14.0 mg L−1 in the Brubaker Run bioreactor.
The influent Fe(II)-series experiments began at the influent Fe(II) concentration of enrichment (∼300 mg L−1 for both bioreactors). For the Scalp Level bioreactor, the influent Fe(II) concentrations varied sequentially from ∼300 to 60, 300, 600, 1200, 2400 and 1200 mg L−1 while the pH was maintained at pH 2.7. For the Brubaker Run bioreactor, the influent Fe(II) concentrations varied sequentially from ∼300 to 80, 300, 600, 1200, 2400, 1200 and 600 mg L−1 while the pH was maintained at pH 2.9.
The operating time for each pH and influent Fe(II)-series set-point ranged from 20 to 50 pore volumes for the Brubaker Run bioreactor (a total of 440 pore volumes for pH-series and 280 pore volumes for influent Fe(II)-series), while was fixed at ∼50 pore volumes for the Scalp Level bioreactor (a total of 540 pore volumes for pH-series and 375 pore volumes for influent Fe(II)-series). Abiotic control experiments were conducted for both sites using sterile, un-inoculated reactors operated at every operational set-point.
Biomass in both suspended and attached growth biofilm were collected before switched to the next geochemical conditions. Sludge samples in the bottom of the bioreactors were collected at selected geochemical conditions for mineralogical analysis.
2.4 Kinetic modeling of Fe(II) oxidation and Fe(T) removal
Assuming that the chemostat operated as a completely-mixed flow-through reactor at steady state, the rate of Fe(II) oxidation (RFe(II); mol Fe(II) L−1 s−1) was calculated as:
 | (1) |
 | (2) |
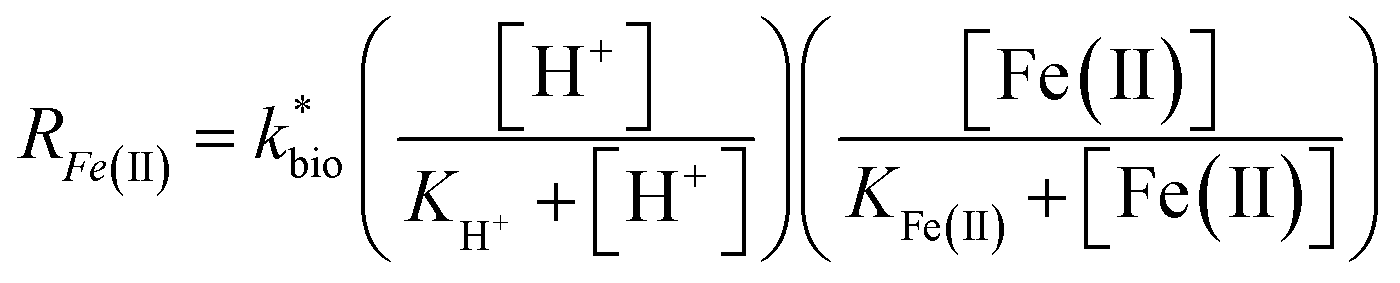 | (3) |
 is the lumped rate constant (mol Fe(II) L−1 s−1), KH+ is the half-saturation coefficient with respect to H+ (mol H+ L−1), and KFe(II) is the half-saturation coefficient with respect to dissolved Fe(II) (mol Fe(II) L−1). KH+ was determined from the pH-series experiments, KFe(II) was determined from the Fe(II)-series experiments, and
  was determined from all of the bioreactor experiments [using the pre-determined values of KH+ and KFe(II)]. Because geochemical gradients across natural TIFs are similar to one another,7–9,23,24 this rate law was also used to predict rates obtained from field sites.
Using a common metric for the performance of AMD passive treatment systems,25 the removal rate of total Fe was calculated as:
| GDM = ([Fe(T)in] − [Fe(T)out]) × Q/A | (4) |
2.5 Analytical methods
During all experiments, data-logging software was used to record all of the operating conditions (time, pH, temperature, mixer speed, and volume of titrant addition) at a user-specified time interval of 1 min. Fe was measured as total and dissolved based on 0.20 μm filtration. Dissolved Fe(II) was measured using the ferrozine assay.26 Total Fe(T) was measured using the ferrozine assay after reduction by 0.5 M hydroxylamine in 0.5 M hydrochloric acid.27 Rates of Fe(II) oxidation were based on dissolved Fe(II) concentrations. Rates of Fe(T) removal were based on total (i.e., unfiltered) Fe(T) concentrations. Biomass samples were collected from the reactor wall and from the suspension at the end of the fed-batch enrichment mode and at the end of each steady state condition. Biomass concentrations were determined based on protein (Bio-Rad protein assay kit that uses Coomassie® Brilliant Blue G-250 dye). An area of at least 1 cm2 of biofilm was scraped from the wall of the reactor or 135 mL of reactor liquid was collected. Sludge samples were air-dried and sieved (<2 mm) prior to analysis of mineralogical characterization. Geochemical modelling were carried out in Geochemist's Workbench Essentials software.3. Results and discussion
The enrichment of Fe(II)-oxidizing microbes from surface sediments collected from each site displayed similar characteristics. During the fed-batch enrichment cycle it took 10 to 20 d for the system to begin to rapidly and completely oxidize the Fe(II) spiked into the reactor (ESI Fig. S2†). After 74 to 128 d of flow-through operation, the rates of Fe(II) oxidation consistently reached 0.41 × 10⁻⁷ to 1.78 × 10⁻⁷ mol Fe(II) L−1 s−1, and the rates of total Fe(T) removal consistently reached 0.35 × 10⁻⁷ to 1.37 × 10⁻⁷ mol Fe(T) L−1 s−1 (equivalent to 13.7 to 53.7 g Fe(T) d−1 m−2 using eqn (4)) in the Scalp Level and Brubaker Run bioreactors.3.1 Fe(II) oxidation in flow-through bioreactors
The HRT in the bioreactor affected the extent of Fe(II) oxidation (Fig. 1). The final sampling event for each HRT set-point was assumed to represent steady state for that condition. The enlarged symbols in Fig. 1A and B denote those measurements within ±5% of the steady state concentration (the ratio of effluent and influent Fe(II) concentration, Cout/Cin). Average rates were then calculated at each denoted point within this operationally defined range of ±5% in Fig. 1C and D. As the HRT was incrementally decreased, both the effluent Fe(II) and total Fe concentrations increased in both bioreactors. While rates of Fe(II) oxidation were fastest at low HRT values, the extent of Fe(II) oxidation was greatest at higher HRT values (Fig. 1C). Over 90% of the Fe(II) was oxidized for both Scalp Level and Brubaker Run bioreactors when HRT was below 6 h. Based on these preliminary experiments, all further experiments were conducted at an HRT of 6 h.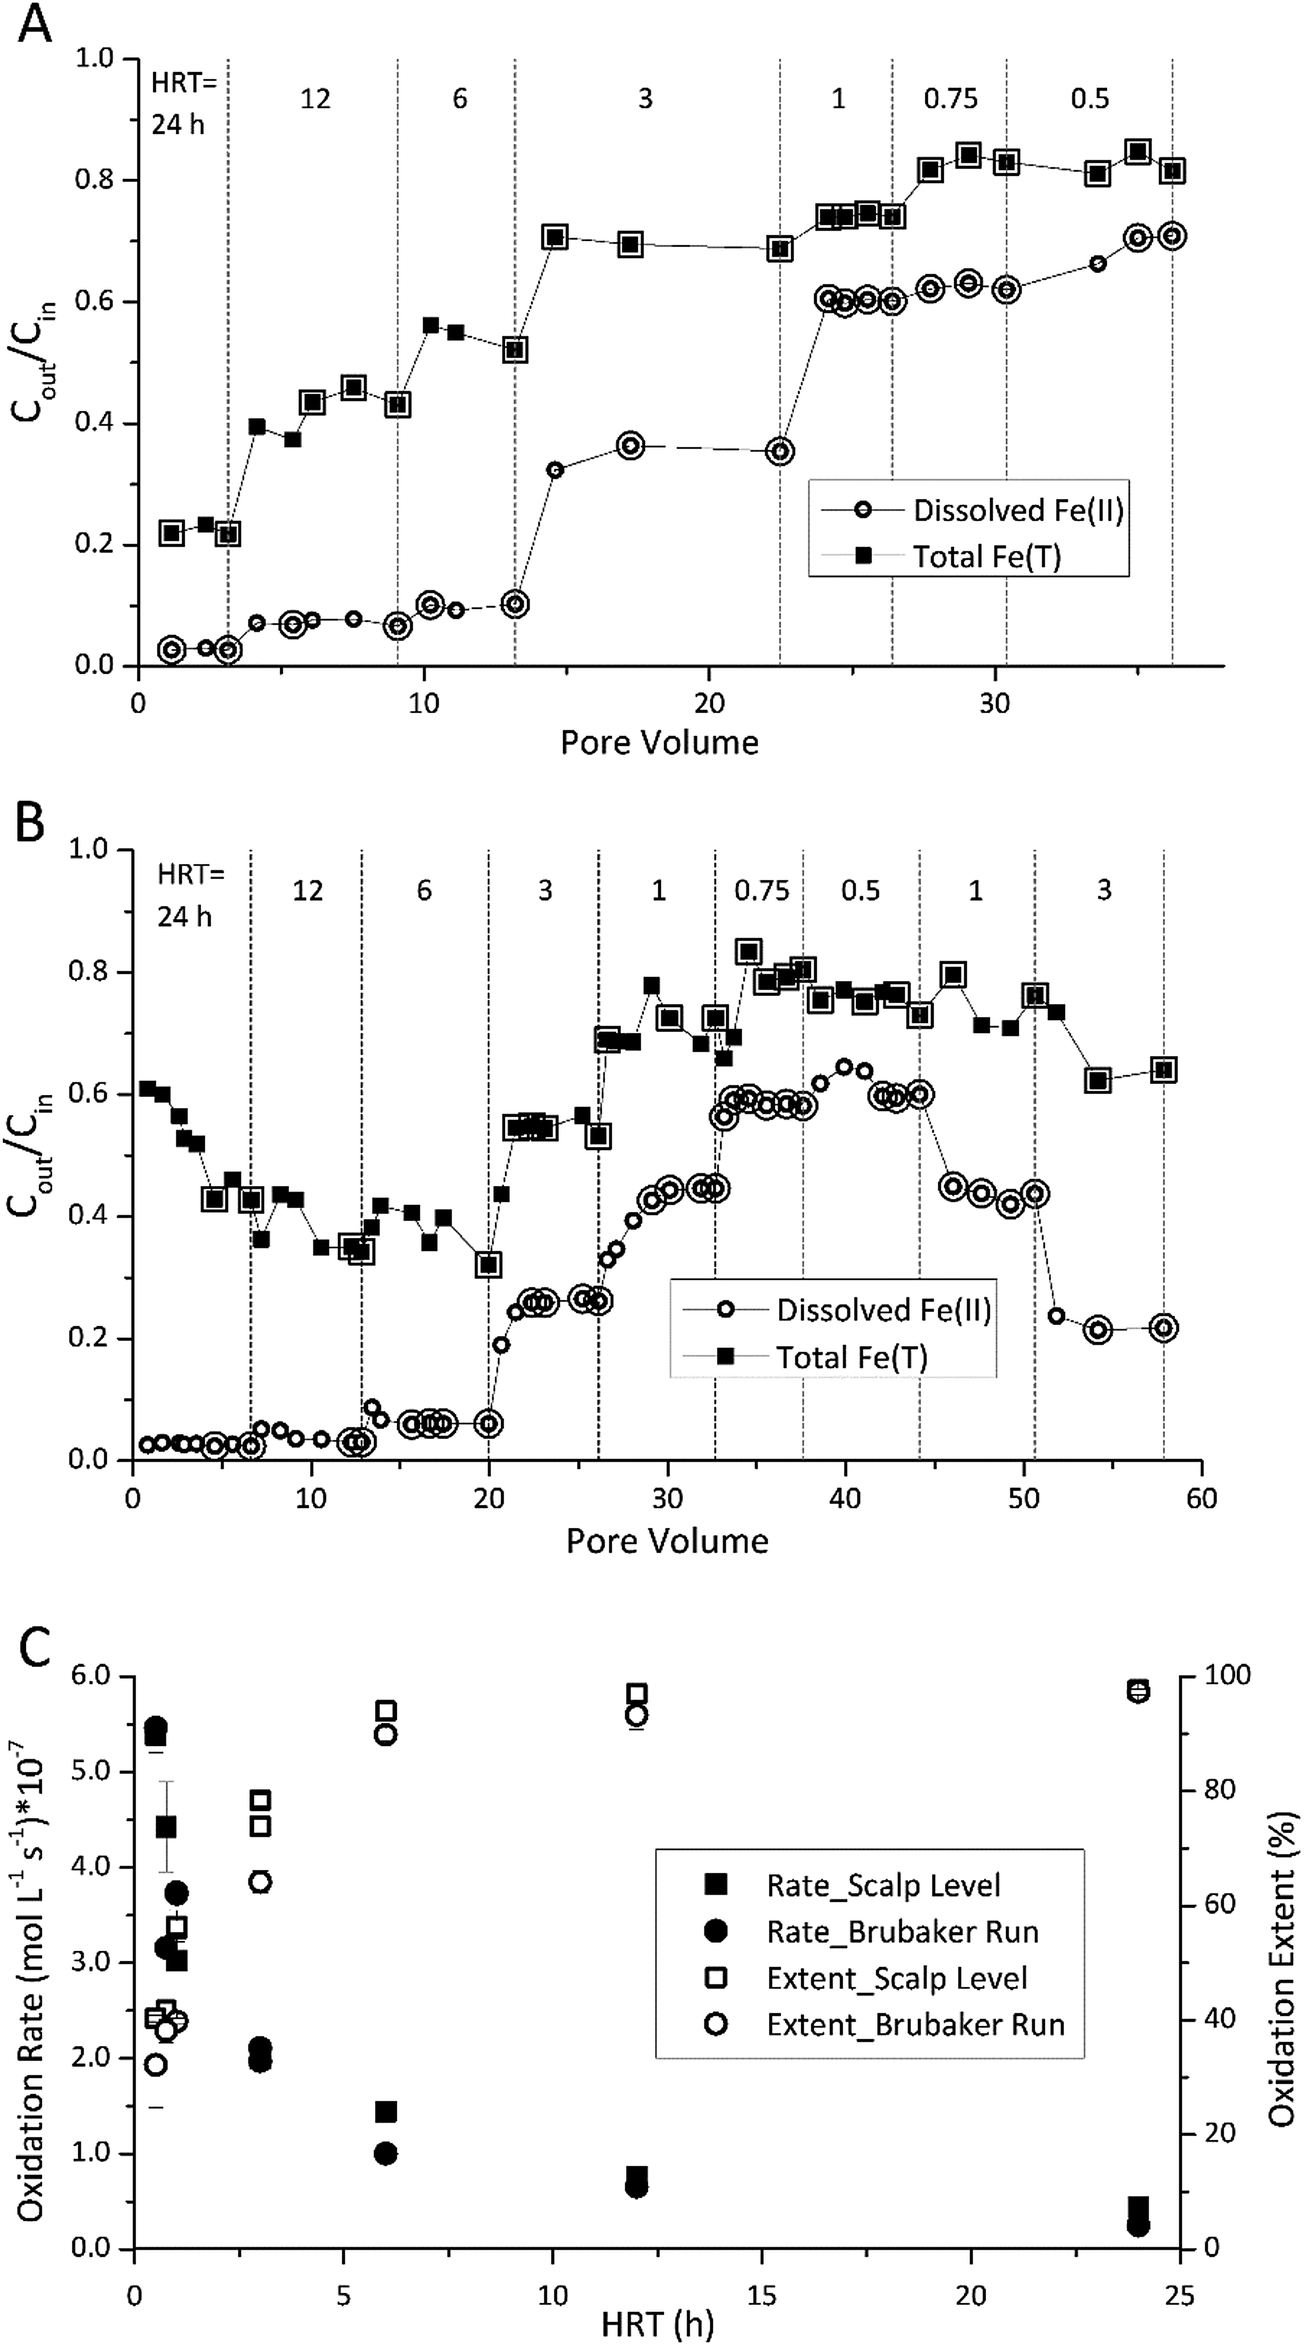 | ||
| Fig. 1 Influence of hydraulic residence time (HRT) on Fe(II) oxidation and Fe(T) removal. Different HRT set-points are denoted by vertical dashed lines. (A) Results obtained for the Scalp Level bioreactor – pH set-point = 2.7 and [Fe(II)]in = 150 mg L−1. (B) Results obtained for the Brubaker Run bioreactor – pH set-point = 2.9 and [Fe(II)]in = 200 mg L−1. Enlarged symbols in A and B denote points used to calculate rate and extent of Fe(II) oxidation shown in (C). | ||
Fe(II) oxidation in the reactors was completely due to microbial activity. At pH values of 2.1 to 4.2, reported rates of abiotic homogeneous oxidation of Fe(II) by DO are negligible.28 While heterogeneous Fe(II) oxidation by DO could have been promoted by the accumulation of Fe(III) solids in the bioreactors, kinetic model calculations29 confirmed that the rate of this reaction was two to six orders of magnitude slower than the rates of Fe(II) measured in the bioreactors (ESI Fig. S3†). Abiotic control reactors confirmed that little Fe(II) was oxidized, where effluent Fe(II) concentrations averaged >97% of influent Fe(II).
Rates of Fe(II) oxidation were fastest at the lowest pH set-points and decreased as the pH of the system increased (Fig. 2). Over 90% of dissolved Fe(II) can be oxidized when pH <2.4 in Scalp Level bioreactor and when pH <2.6 in Brubaker Run Bioreactor. Slower rates of Fe(II) oxidation at higher pH values were consistent with previous field measurements.8 Slower rates of Fe(II) oxidation at higher pH values were consistent with thermodynamic calculations that show the Gibbs free energy of Fe(II) oxidation becomes less negative as pH increases.30 Slower rates of Fe(II) oxidation at higher pH values was consistent with microbial community analysis that the relative abundance of acidophilic Fe(II)-oxidizing bacteria (e.g., Ferrovum, Leptospirillum, Acidithiobacillus) decreased as pH increased.31,32 Slower rates of Fe(II) oxidation at higher pH values were also consistent with previous studies using suspended-growth and fixed-film bioreactors containing pure cultures of acidophilic Fe(II)-oxidizing bacteria.10,16
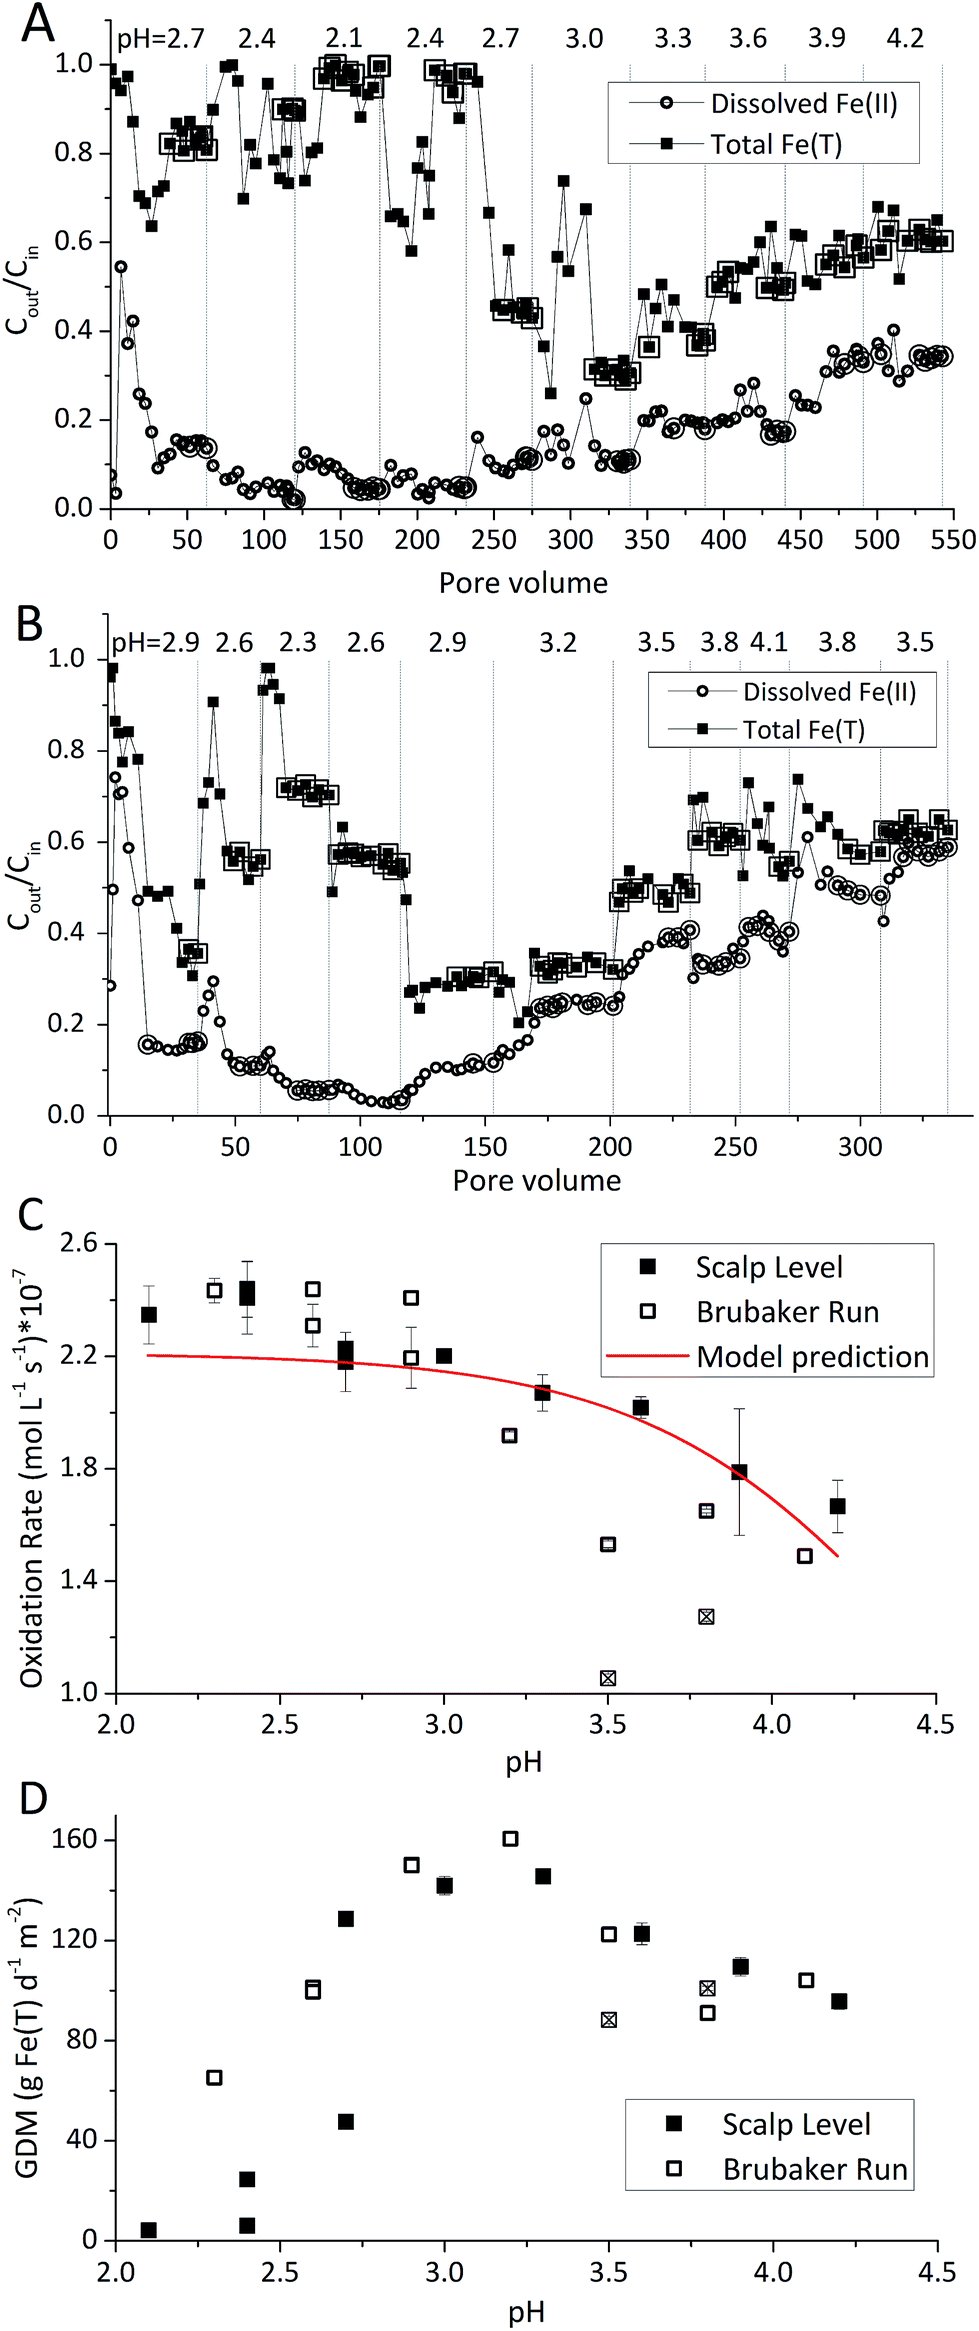 | ||
| Fig. 2 Influence of pH set-point on Fe(II) oxidation and Fe(T) removal obtained for the Scalp Level and Brubaker Run chemostats – hydraulic residence time of 6 h and [Fe(II)]in of 300 mg L−1. Different pH set-points are denoted by vertical dashed lines. (A) Results obtained for the Scalp Level bioreactor as a function of pore volume. (B) Results obtained for the Brubaker Run bioreactor as a function of pore volume. Enlarged symbols in (A and B) denote steady-state points used to calculate rate of Fe(II) oxidation shown in (C) and rate of total Fe(T) removal in (D). Two operational conditions with the Brubaker Run chemostat (denoted with ⊠) were excluded from model parameterization. | ||
Rates of Fe(II) oxidation in these laboratory systems were slower compared to rates measured at the corresponding field sites (Table 1). For example, the field-based Fe(II) oxidation rate measured at Scalp Level was 97.0 ± 28.3 × 10⁻⁷ mol Fe(II) L−1 s−1 (n = 3) while the laboratory-based Fe(II) oxidation rates measured with the Scalp Level bioreactors ranged from 0.44 × 10⁻⁷ to 7.7 × 10⁻⁷ mol Fe(II) L−1 s−1. Similarly, the field-based Fe(II) oxidation rate measured at Brubaker Run was 16.0 ± 6.1 × 10⁻⁷ mol Fe(II) L−1 s−1 (n = 5) while the laboratory-based Fe(II) oxidation rates measured with the Brubaker Run bioreactors ranged from 0.62 × 10⁻⁷ to 5.8 × 10⁻⁷ mol Fe(II) L−1 s−1. Large area of TIFs containing abundance of Fe(II)-oxidizing bacterial community in certain AMD sites were taken to be a natural passive treatment systems as AMD flows downgradient.7–9
Laboratory-based rates of Fe(II) oxidation were more similar for these sites as compared to their corresponding field-based rates. The Fe(II) oxidation rate at Scalp Level was six times faster than the rate measured at Brubaker Run but likely caused by differences in the pH of the systems. The pH at Scalp Level was 2.89 ± 0.08 while the pH at Brubaker Run was 3.37 ± 0.15. When operated under similar hydrogeochemical conditions (i.e., same HRT and [Fe(II)]in, and similar pH), the Fe(II) oxidation rates measured in the Scalp Level and Brubaker Run bioreactors were essentially the same. Encouragingly, the similarity in laboratory-based rates of Fe(II) oxidation from distinctly different sites should improve our ability to predict the kinetics of this process in upscaled active treatment systems.
The type of titrant (H2SO4 or NaOH) required to maintain the pH-set points revealed conditions that favored the production of soluble versus insoluble Fe(III). Microbially-catalyzed Fe(II) oxidation can produce either soluble Fe(III) (eqn (5)) or insoluble Fe(III) (eqn (6)) according to:
 | (5) |
 | (6) |
The Fe(III) precipitates should be essentially free of trace metal and metalloid contaminants.24 Geochemical modeling confirmed that schwertmannite was the predominant Fe(III) mineral formed in these bioreactor systems (ESI Fig. S4†), consistent with our field studies.7,24,34 Na-jarosite could have formed at the lowest pH-set points. Model predictions accounted for variable concentrations of sulfate (12.5–56 mM from FeSO4 substrate and H2SO4 titrant) and Na (0.5–24 mM from NaOH titrant) in the bioreactors. In eqn (5), acidity is consumed such that acid would have to be added to a chemostat to maintain the pH-set point. In eqn (6), acidity is produced such that base would have to be added to maintain the pH-set point. In our experiments, H2SO4 was required to maintain all pH set-points <2.9 (ESI Tables S1 and S2†). The production of soluble Fe(III), therefore, was favored at pH <2.9. NaOH was required to maintain all pH set-points >2.9, thus the production of insoluble Fe(III) was favored at pH >2.9.
3.2 Fe(T) removal in flow-through bioreactors
The pH set-point of the bioreactor had a strong influence on the removal of total Fe (Fig. 2D). Due to the relatively high solubility of Fe(III) minerals (schwertmannite and jarosite) at low pH, substantial removal of total Fe did not occur until the pH exceeded 2.7. The rates of total Fe removal were calculated using eqn (4) and the pseudo-steady state Fe(T) concentrations. The maximum removal of total Fe occurred between pH 2.90 to 3.30. Up to 70% of total Fe can be removed from the solution (Fig. 2A and B). Below pH 2.90 the removal of Fe(T) was limited by the solubility of Fe(III) minerals precipitated in the bioreactor. Above pH 3.30 the removal of Fe(T) was limited by the oxidation rate of Fe(II) (Fig. 2C). Total Fe removal in the Scalp Level bioreactor was lower than in the Brubaker Run bioreactor when pH ≤2.9. Lower Fe removal measured in the Scalp Level bioreactor was consistent with field studies.Under most operating conditions, these bioreactors far exceeded the performance of passive treatment operations for the removal of total Fe. For example, an aerobic pond built to capture Fe solids in a passive treatment system typically removes 15 to 20 grams of Fe per day per square meter of plan area (GDM).35,36 Aerobic wetlands typically remove 5 to 10 GDM of Fe. Natural and engineered terraced iron formations for low-pH Fe(II) oxidation have been found to remove 0.1 to 8.7 GDM of iron.7–9 The bioreactors used in this study removed up to 150 GDM of Fe in the pH-series experiments (Fig. 2D) and up to 400 GDM of Fe in the Fe(II)-series experiments (Fig. 3D).
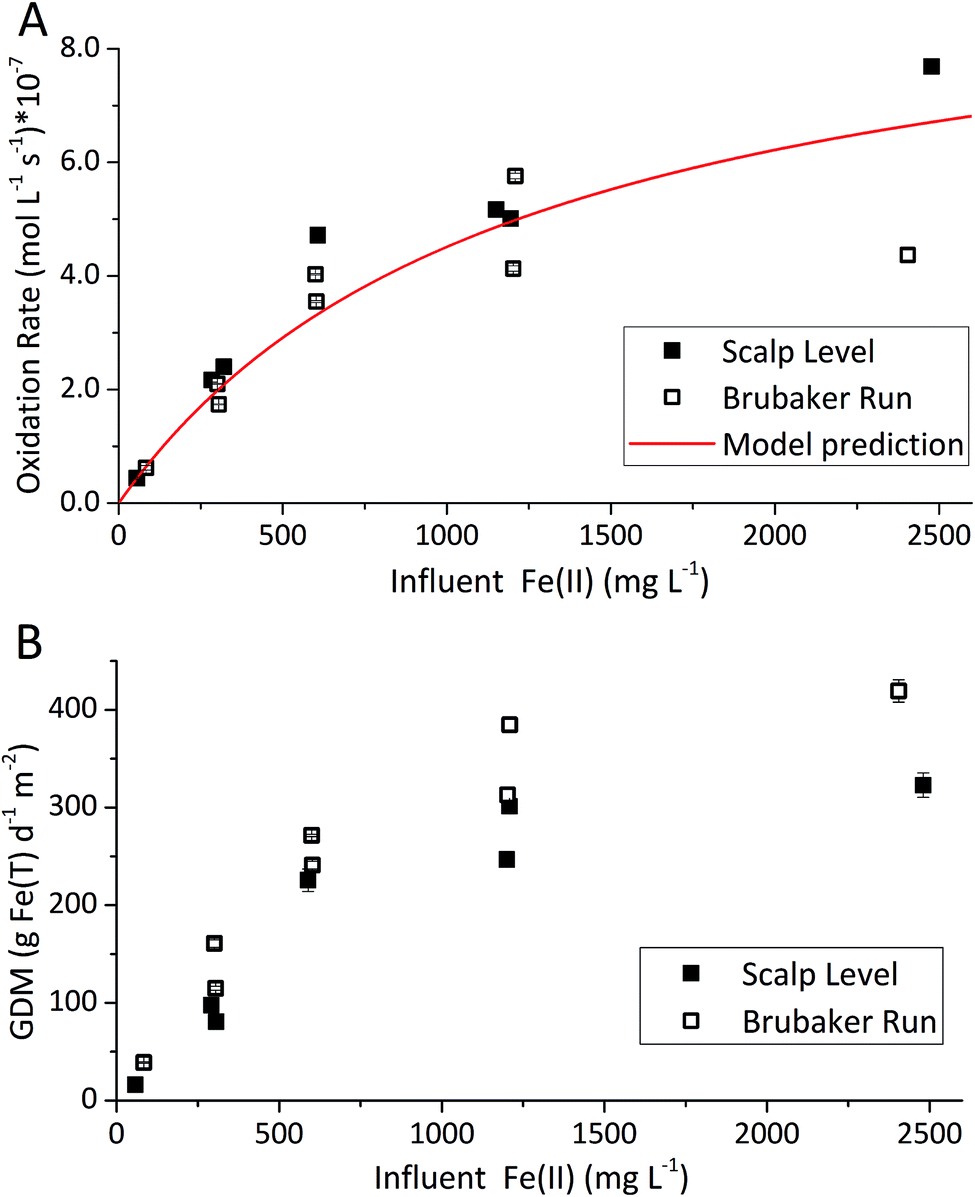 | ||
| Fig. 3 Influence of influent Fe(II) set-point on Fe(II) oxidation and Fe(T) removal obtained for the Scalp Level and Brubaker Run bioreactors – hydraulic residence time of 6 h, pH of 2.7 with Scalp Level, and pH 2.9 with Brubaker Run. Steady-state points of each [Fe(II)]in series set-point were used to calculate rate of Fe(II) oxidation shown in (A) and rate of total Fe(T) removal in (B). | ||
The influent Fe(II) concentration had a direct effect on the rates of Fe(II) oxidation and Fe(T) removal (Fig. 3). Both of these rates increased as the influent Fe(II) concentration increased. At constant pH values (as controlled in these experiments), the rate of Fe(T) removal was directly proportional to the rates of Fe(II) oxidation and Fe(III) generation. As noted above, removal of 20 GDM of Fe is considered an adequate performance metric for passive treatment systems. This criteria was always exceeded when the pH-set point was greater than 2.5 and when the influent Fe(II) concentration was greater than 50 mg L−1 (Fig. 2 and 3). However, the design, construction, and operation of a bioreactor are more costly than passive treatment unit operations. Therefore, a bioreactor for low-pH Fe(II) oxidation and Fe(T) removal would likely only become cost-effective for AMD discharges with relatively high Fe(II) concentrations (e.g., >200 mg L−1). Encouragingly, one such bioreactor would become even more effective with higher influent Fe(II) concentrations, waters that are otherwise quite challenging to treat by conventional passive or active treatment operations.
3.3 Kinetic modeling of biological low-pH Fe(II) oxidation
A dual-Monod rate formulation was used to model Fe(II) oxidation kinetics in these bioreactors (eqn (3)). This approach only considered the effect of pH (i.e., [H+]) and dissolved Fe(II) concentration. All other possible effects, e.g., biomass concentration, microbial community structure, concentrations of DO and Fe(III), and temperature, were not directly considered. Rate dependency on these other parameters was excluded because biogeochemical condition was reasonably controlled in a chemostatic system and no significant correlations were found between rates and these parameters.37 For example, rates showed no dependence on DO likely because it was never rate-limiting (>3 mg L−1) (ESI Tables S1 and S2†) and DO should not be limiting in an aerated reactor. Biomass concentrations likely developed to similar levels as observed in the current study where total biomass concentrations (attached growth and suspended growth) ranged from 0.24 × 10⁷ to 4.84 × 10⁷ cell per mL in both bioreactor series with >95% in the attached growth biofilm. Acidophilic Fe(II) oxidizing bacterial communities evolved in similar ways (primarily controlled by pH and Fe concentrations),31 and structured differently from the neutral condition enriched Fe(II) oxidizing bacterial communities.38 The aggregate effect of all other parameters was effectively lumped into the overall rate constant in eqn (3).
For the constrained range of pH set-points used in this study (pH 2.1–4.2), the proton concentration exerted a distinct saturation-like effect on the Fe(II) oxidation rate (Fig. 4A). Because protons are not a microbial substrate, a Monod rate formulation is an unconventional formulation. Regardless, for the pH-series experiments (where the influent Fe(II) concentration was fixed at 300 mg L−1), rate parameters were determined using:
 | (7) |
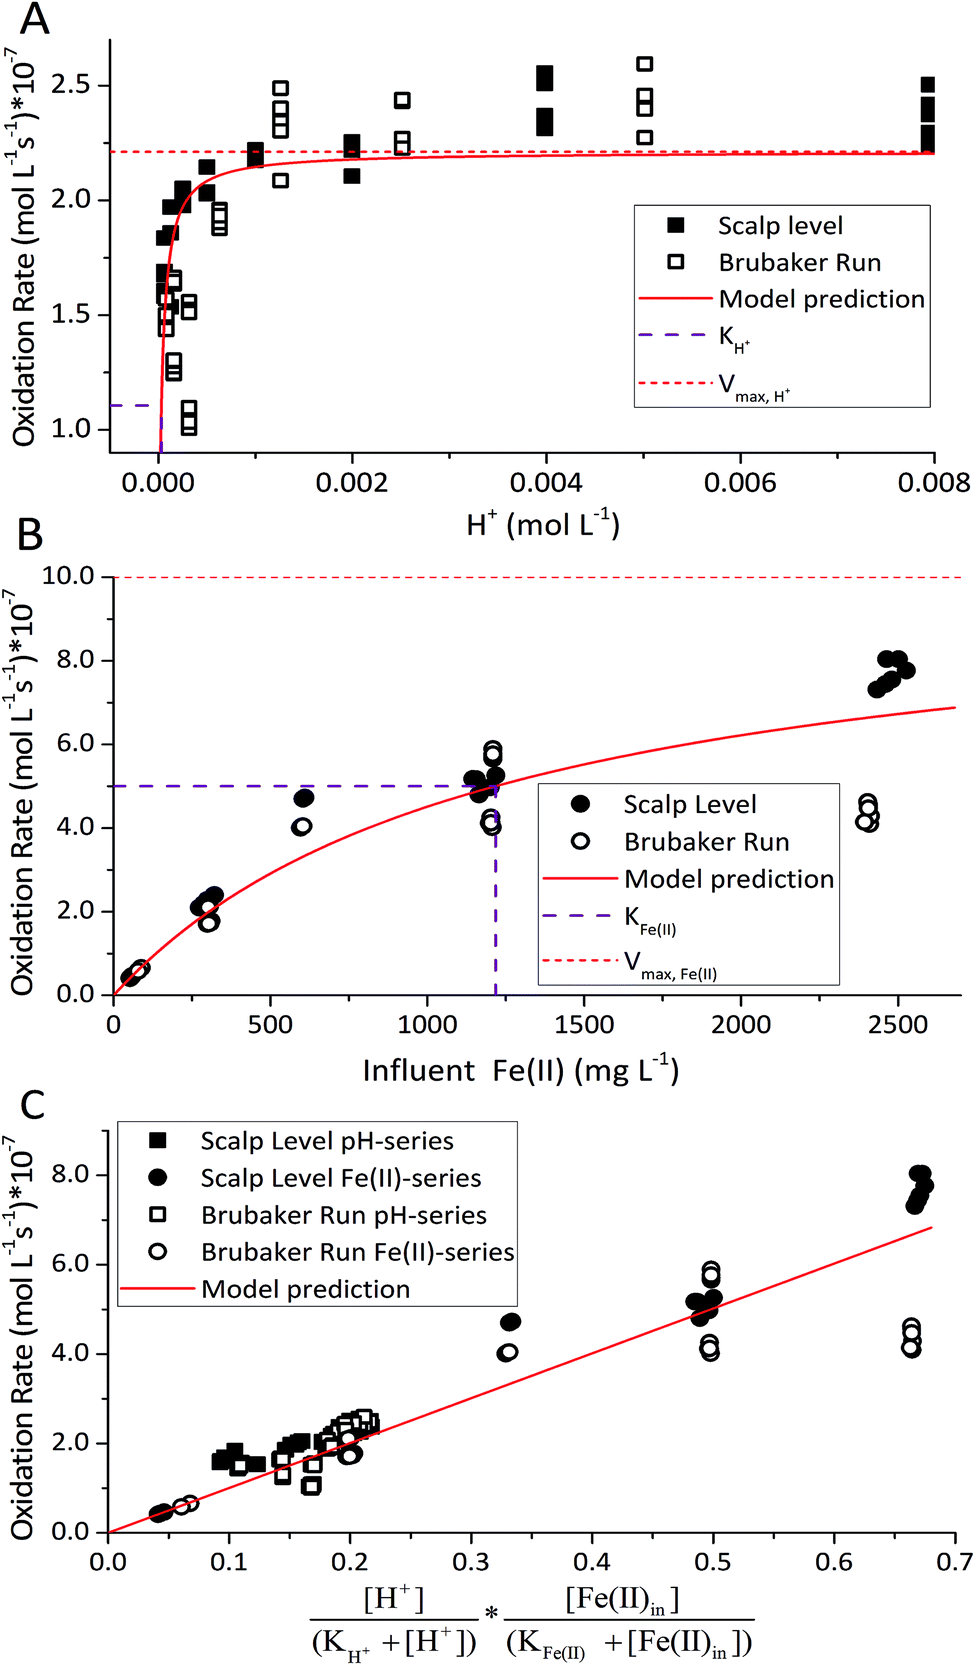 | ||
| Fig. 4 Parameter estimation for dual-Monod rate law for biological low-pH Fe(II) oxidation. (A) Fe(II) oxidation rate versus [H+] with [Fe(II)]in = 300 mg L−1. (B) Fe(II) oxidation rate versus [Fe(II)]in with pH = 2.7 for Scalp Level or pH = 2.9 for Brubaker Run. (C) Fe(II) oxidation rate versus dual-Monod terms using fixed values for KH+ = 10−4.51 M and KFe(II) = 1220 mg L−1. | ||
| Date set | Point no. | KH+ (mol H+ L−1) × 10−5 | Vmax,H+ (mol L−1 s−1) × 10−7 | KFe(II) (mg Fe(II) L−1) | Vmax,Fe(II) (mol L−1 s−1) × 10−6 |
|
Pearson's r | |tstatistic| | tcritical | RSS (mol L−1 s−1)2 × 10⁻¹² |
|---|---|---|---|---|---|---|---|---|---|---|
a Pearson's r is calculated for  with P values in parentheses. P < 0.01 represents a highly significant correlation.b If the absolute value of tstatistic > tcritical, then the measured and predicted rates are significantly different at a 95% confidence.c Model parameters for ‘reported’ bioreactor rates obtained from Scalp Level and Brubaker Run bioreactor rates, Brown et al.,7 Diz,15 Hedrich and Johnson,10 Heinzel et al.,11,12 Janneck et al.13 and Wood et al.17.d Model parameters for ‘reported’ field rates obtained from Scalp Level and Brubaker Run field rates, Chen and Jiang,39 Kirby and Elder Brady,40 Larson et al.,8 Noike et al.,41 Nordstrom42 and Sánchez-España et al.23 with P values in parentheses. P < 0.01 represents a highly significant correlation.b If the absolute value of tstatistic > tcritical, then the measured and predicted rates are significantly different at a 95% confidence.c Model parameters for ‘reported’ bioreactor rates obtained from Scalp Level and Brubaker Run bioreactor rates, Brown et al.,7 Diz,15 Hedrich and Johnson,10 Heinzel et al.,11,12 Janneck et al.13 and Wood et al.17.d Model parameters for ‘reported’ field rates obtained from Scalp Level and Brubaker Run field rates, Chen and Jiang,39 Kirby and Elder Brady,40 Larson et al.,8 Noike et al.,41 Nordstrom42 and Sánchez-España et al.23 |
||||||||||
| SL bioreactor | 58 | 2.54 | 2.28 | 2080 | 1.70 | 15.31 | 0.97 (<0.01)a | 0.51b | 1.98 | 0.12 |
| BR bioreactor | 68 | 4.39 | 2.20 | 1010 | 0.81 | 8.30 | 0.88 (<0.01) | 0.66 | 1.98 | 0.26 |
| SL + BR bioreactor | 126 | 3.06 | 2.22 | 1220 | 1.00 | 10.00 | 0.92 (<0.01) | 0.46 | 1.97 | 0.55 |
| ‘Reported’ bioreactorc | 137 | 4.48 | 2.26 | 693 | 0.58 | 8.43 | 0.65 (<0.01) | 0.21 | 1.97 | 4.64 |
| ‘Reported’ field sited | 72 | 5.45 | 0.45 | 155 | 0.27 | 46.85 | 0.34 (<0.01) | 0.32 | 1.98 | 546.70 |

The influent dissolved Fe(II) concentration (varied from 60–2400 mg Fe(II) L−1) also exerted a saturation effect on the rate of Fe(II) oxidation (Fig. 4B). For the influent Fe(II)-series experiments (where the pH was fixed at 2.7 for the Scalp Level bioreactor and 2.9 for the Brubaker Run bioreactor), rate parameters were determined using:
 | (8) |
 in eqn (3) was determined after the half-saturation constants for H+ (KH+) and influent Fe(II) (KFe(II)) were independently determined from the pH-series and influent Fe(II)-series of experiments, respectively. The graphical fit to determine
  using the combined data sets are shown in Fig. 4C. The Vmax terms from eqn (7) and (8) are essentially lumped into
  . The objective of our kinetic modeling was to develop a simple approach to predict the rates of low-pH Fe(II) oxidation in an active treatment bioreactor based on measureable characteristics of candidate AMD discharges (i.e., pH and emergent [Fe(II)]). This model would serve to predict how the biogeochemical processes in the field (e.g., across a TIF) would translocate to a more controlled setting. The reactor design (e.g., stir tank with limited surface area for attached growth) and operational conditions (e.g., 20 °C, HRT = 6 h) can affect reactor performance yet their impacts are essentially lumped into the rate parameters, possibly limiting the applicability of our model to other AMD systems.
To address this issue, we extracted rates of low-pH Fe(II) oxidation from a number of field sites8,23,39–42 and bioreactor studies7,10–13,15,17 and used our model to predict corresponding rates39–42 (using eqn (3) with rate parameters in Table 2; literature data summarized in ESI Table S3†). In general, rates of Fe(II) oxidation measured in our bioreactor experiments were lower than those reported in the field (Fig. 5). Consistent with our current study, rates of Fe(II) oxidation displayed a saturation-like dependency on the H+ concentration, with fastest rates measured at lowest pH values (Fig. 5A). Rates of Fe(II) oxidation from these studies also displayed a saturation-like dependency on the Fe(II) concentration (Fig. 5B). The slower rates measured in our laboratory experiments were affected by the HRT of the bioreactor. HRT values for water flowing across the field sites were on the order of minutes (Table 1), far from the 6 hour HRT used in our experiments.
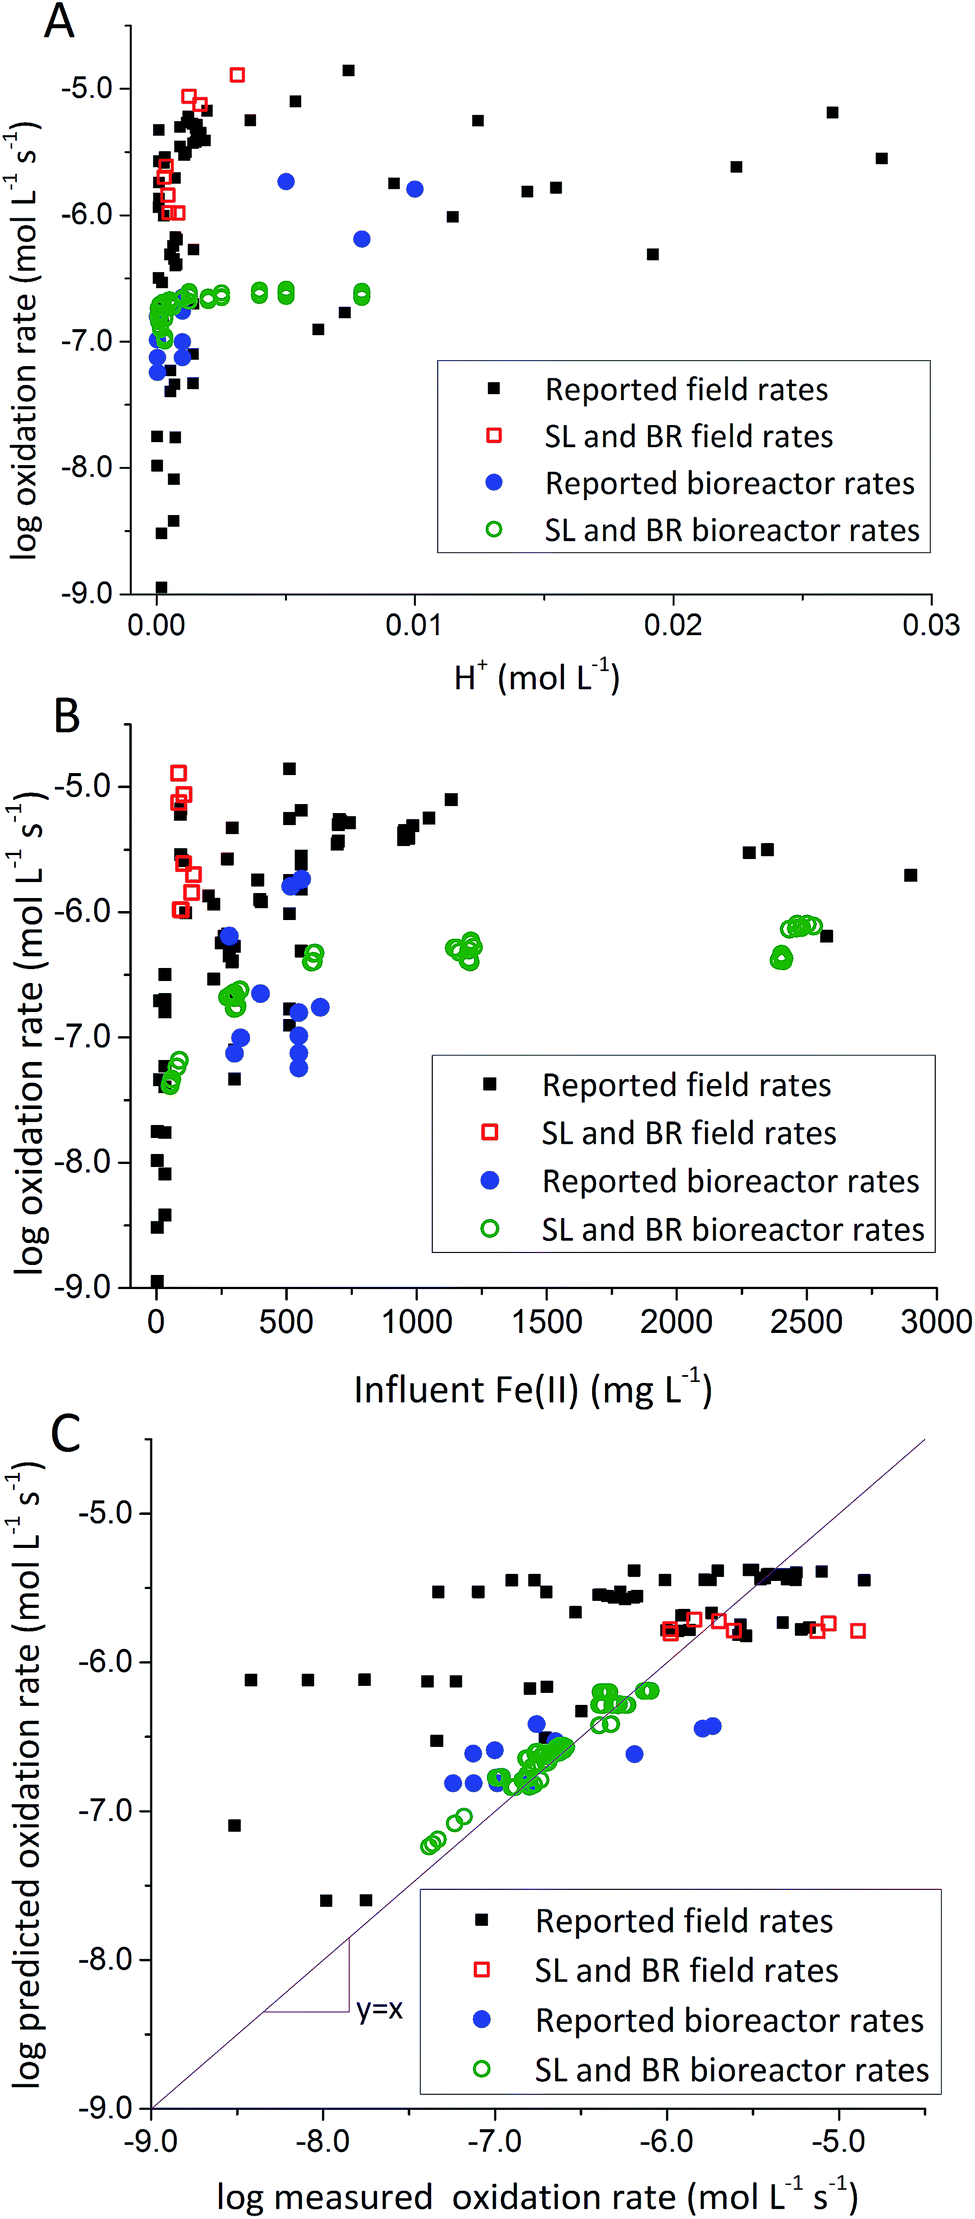 | ||
| Fig. 5 Comparison of rates measured in the current study with other rates from the literature. (A) Fe(II) oxidation rates versus [H+]. (B) Fe(II) oxidation rates versus [Fe(II)]in. (C) Predicted rates versus measured rates. Predicted rates calculated using dual-Monod model and parameters obtained from A and B. Reported field rates from Chen and Jiang,39 Kirby and Elder Brady,40 Larson et al.,8 Noike et al.,41 Nordstrom42 and Sánchez España et al.23 Reported bioreactor rates from Brown et al.,7 Diz,15 Hedrich and Johnson,10 Heinzel et al.,11,12 Janneck et al.13 and Wood et al.17 | ||
Evaluation of biogeochemical kinetics was always challenging because differences in complex hydrogeochemical conditions. To test the applicability of our model to different AMD systems, pH and influent Fe(II) concentration were used for bioreactor rates prediction, while pH and Fe(II) concentration of emergent AMD was used for field rates prediction when rates were measured across both natural and ‘engineered’ TIFs in AMD site.8 Compiled ‘reported’ bioreactor rates including current bioreactors (i.e., Scalp Level and Brubaker Run) and literature bioreactors were used to calculate kinetic parameters only for bioreactor rate prediction in Fig. 5C. Similarly, Scalp Level and Brubaker Run field rates and literature field rates were used to calculate kinetic parameters of ‘reported’ field rates to predict rates measured in different field sites. Dual-Monod kinetic parameters calculated obtained from different series of Fe(II) oxidation rates were summarized in Table 2.
Most of the bioreactor and field rates of Fe(II) oxidation were able to be predicted by our dual-Monod kinetic model using two series of kinetic parameters obtained from currently and previously reported bioreactor or field studies (e.g.,  for bioreactor ratesis;
 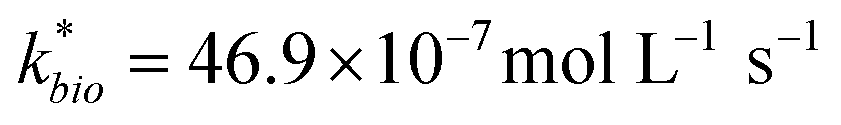 for field rates), while some field rates still tended to be under-predicted (Fig. 5C). In other words, by adjusting kinetic parameters [
 , KH+, KFe(II)], eqn (3) could reasonably predict previously reported results. Statistical analyses were employed to examine the significance of the difference of measured rates versus predicted rates (Table 2). Although t tests demonstrated that pair-wise comparisons between all measured and predicted rates in currently or preciously reported studies were not significantly different at 95% confidence, as compared to the bioreactors, the residual sum of squares (RSS) between measured rates and predicted rates was much larger when using ‘reported’ field rates for kinetic parameter calculation. Because of the complicated hydro-biogeochemical dissimilarities among different reactor systems or natural environments, our model may represent a conservative prediction for rates of low-pH Fe(II) oxidation (e.g., in current bioreactor systems with controlled hydro-biogeochemistry).
4. Conclusions
Reported rates of low-pH Fe(II) oxidation from field and bioreactor studies vary over at least four orders of magnitude (Fig. 5). This wide range of rates is likely caused by differences in geochemical conditions (pH, temperature, [Fe(II)], [Fe(III)], DO), hydrodynamic characteristics (flow rate, turbulence, HRT), microbial community structure, and biomass concentrations. For our well constrained bioreactor systems (T = 20 °C, HRT = 6 h, pH = 2.1 to 4.2, [Fe(II)]in = 80–2400 mg L−1), we were able to develop a three-parameter [ , KH+, KFe(II)] dual-Monod rate law (eqn (3), Table 2). While this model still tended to under-predict some field rates using field sites' pH values and emergent Fe(II) concentrations, this model should prove useful for predicting rates of Fe(II) oxidation in engineered bioreactors for active treatment or engineered TIFs sites for passive treatment. Rates of Fe(II) oxidation (and kinetic parameters) were remarkably similar from two sites that displayed significantly different field rates. Encouragingly, these results could suggest that bioreactor rates will be far less variable than field rates.
Low-pH Fe(II) oxidation and Fe(III) precipitation occur naturally across TIFs at many AMD sites. While natural TIFs can (and, whenever possible, should) be incorporated into passive AMD treatment systems, active treatment bioreactors are also viable options for select chemistries. In particular, AMD with high dissolved Fe(II) concentrations (e.g., >200 mg L−1) would be very amenable to active treatment. The HRT used in these experiments (6 h) was relatively long compared to the HRT across field sites and was at least one reason why Fe(II) oxidation rates in our bioreactors were lower than field sites. However, the relatively long HRT used in these experiments may have enhanced the precipitation and capture of Fe(III) (Fig. 2D and 3D). While stimulating a fast rate of Fe(II) oxidation is important for AMD treatment, removal of Fe(T) is arguably the most important process in the treatment system. Iron removal rates were found to be as high as 150 to 400 GDM in these bioreactors as compared to 20 GDM for aerobic settling ponds. The mineral purity of Fe(III) precipitates could be significance of economic value. All of these results point to the promise of a simple approach of enriching indigenous sediment Fe(II)-oxidizing bacteria in bioreactors for AMD treatment.
Conflict of interest
There are no conflicts of interest to declare.Acknowledgements
This work was partially supported by the US Office of Surface Mining Reclamation and Enforcement under Cooperative Agreement S11AC20005, by the China Scholarship Council and China Postdoctoral Science Foundation funded project (2017M610927) (to Y. S.), and by the Appalachian Research Initiative for Environmental Science (ARIES). ARIES is an industrial affiliates program at Virginia Tech, supported by members that include companies in the energy sector. The opinions and recommendations expressed herein are solely those of the authors and do not imply any endorsement by ARIES. We thank Travis Tasker and Lance N. Larson for field assistance.References
- C. A. Cravotta, Appl. Geochem., 2008, 23, 166 CrossRef CAS.
- C. S. Kirby and C. A. Cravotta, Appl. Geochem., 2005, 20, 1920 CrossRef CAS.
- A. T. Herlihy, P. R. Kaufmann, M. E. Mitch and D. D. Brown, Water, Air, Soil Pollut., 1990, 50, 91 CrossRef CAS.
- D. K. Nordstrom, C. N. Alpers, C. J. Ptacek and D. W. Blowes, Environ. Sci. Technol., 2000, 34, 254 CrossRef CAS.
- Interstate Technology and Regulatory Council, Environmental Council of the States, Washington, DC, http://www.itrcweb.org/miningwaste-guidance/decision_tree.htm, retrieved 16 September 2013.
- D. B. Johnson and K. B. Hallberg, Sci. Total Environ., 2004, 338, 3 CrossRef PubMed.
- J. F. Brown, D. S. Jones, D. B. Mills, J. L. Macalady and W. D. Burgos, Appl. Environ. Microbiol., 2011, 77, 545 CrossRef CAS PubMed.
- L. N. Larson, J. Sánchez-España and W. Burgos, Appl. Geochem., 2014, 47, 85 CrossRef CAS.
- T. DeSa, J. Brown and W. Burgos, Mine Water Environ., 2010, 29, 239 CrossRef CAS.
- S. Hedrich and D. B. Johnson, Bioresour. Technol., 2012, 6, 44 CrossRef PubMed.
- E. Heinzel, S. Hedrich, E. Janneck, F. Glombitza, J. Seifert and M. Schlömann, Appl. Environ. Microbiol., 2009, 75, 858 CrossRef CAS PubMed.
- E. Heinzel, E. Janneck, F. Glombitza, M. Schlömann and J. Seifert, Environ. Sci. Technol., 2009, 43, 6138 CrossRef CAS PubMed.
- E. Janneck, I. Arnold, T. Koch, J. Meyer, D. Burghardt and S. Ehinger, Mine water and innovative thinking, in Proceedings of the international mine water association symposium, ed. C. Wolkersdorfer and A. Freund, ed. Cape Breton University Press, Sydney, NS, Canada, 2010, p. 131 Search PubMed.
- J. S. Tischler, C. Wiacek, E. Janneck and M. Schlömann, Mine Water Environ., 2013, 32, 258 CrossRef CAS.
- H. R. Diz, Ph.D. dissertation, Virginia Polytechnic Institute and State University, 1997.
- S. M. Mousavi, S. Yaghmae and A. Jafari, Fuel, 2007, 86, 993 CrossRef CAS.
- T. A. Wood, K. R. Murray and J. G. Burgess, Appl. Microbiol. Biotechnol., 2001, 56, 560 CrossRef CAS PubMed.
- A. Mazuelos, F. Carranza, I. Palencia and R. Romero, Hydrometallurgy, 2000, 58, 269 CrossRef CAS.
- Y. Sheng, B. Kaley and W. D. Burgos, Bio-Protoc., 2017, 7(3) DOI:10.21769/BioProtoc.2130.
- B. Pesic, D. J. Oliver and P. Wichlacz, Biotechnol. Bioeng., 1989, 33, 428 CrossRef CAS PubMed.
- C. S. Kirby, H. M. Thomas, G. Southam and R. Donald, Appl. Geochem., 1999, 14, 511 CrossRef CAS.
- L. N. Nikolov and D. G. Karamanev, J. Ferment. Bioeng., 1990, 69, 265 CrossRef CAS.
- J. Sánchez España, E. López Pamo and E. Santofimia Pastor, J. Geochem. Explor., 2007, 92, 120 CrossRef.
- W. D. Burgos, T. Borch, L. D. Troyer, F. Luan, L. N. Larson, J. F. Brown, J. Lambson and M. Shimizu, Geochim. Cosmochim. Acta, 2012, 76, 29 CrossRef CAS.
- G. R. Watzlaf, K. T. Schroeder, R. L. P. Kleinmann, C. L. Kairies and R. W. Nairn, American Society of Mining and Reclamation, Lexington, Kentucky, 2002 Search PubMed.
- L. L. Stookey, Anal. Chem., 1970, 42, 779 CrossRef CAS.
- D. R. Lovely and E. J. P. Phillips, Appl. Environ. Microbiol., 1987, 53, 1536–1540 Search PubMed.
- P. C. Singer and W. Stumm, Science, 1970, 167, 1121 CAS.
- W. Sung and J. J. Morgan, Environ. Sci. Technol., 1980, 14, 561 CrossRef CAS.
- L. N. Larson, J. Sánchez-Españac, B. Kaley, Y. Sheng, K. Bibby and W. Burgos, Environ. Sci. Technol., 2014, 48, 9246 CrossRef CAS PubMed.
- Y. Sheng, K. Bibby, C. Grettenberger, B. Kaley, J. L. Macalady, G. Wang and W. D. Burgos, Appl. Environ. Microbiol., 2016, 82, 3611 CrossRef CAS PubMed.
- C. L. Grettenberger, A. R. Pearce, K. J. Bibby, D. S. Jones, W. D. Burgos and J. L. Macalady, Appl. Environ. Microbiol., 2017, 83(7) DOI:10.1128/aem.00015-17.
- S. Regenspurg, A. Brand and S. Peiffer, Geochim. Cosmochim. Acta, 2004, 68, 1185 CrossRef CAS.
- T. Peretyazhko, J. M. Zachara, J.-F. Boily, Y. Xia, P. L. Gassman, B. W. Arey and W. D. Burgos, Chem. Geol., 2009, 262, 169 CrossRef CAS.
- R. S. Hedin and R. W. Nairn, 13th Annual WV Surface Mine Drainage Task Force Symposium, 1992, http://wvmdtaskforce.com/proceedings/1992.cfm Search PubMed.
- G. A. Brodie, Case history of Fabious impoundment I and overview of the Tennessee Valley Authority's program, in Constructed Wetlands for Water Quality Improvement, ed. G. A. Moshiri, Lewis Publishers, Boca Raton, FL, 1993, p. 157 Search PubMed.
- B. Kaley, MS thesis, The Pennsylvania State University, University Park, PA, 2013.
- Y. Liu, C. Feng, N. Chen, Y. Sheng, S. Dong, C. Hao and K. Lei, RSC Adv., 2016, 6, 108375–108383 RSC.
- C. J. Chen and W. T. Jiang, Appl. Geochem., 2012, 27, 1966 CrossRef CAS.
- C. S. Kirby and J. A. E. Brady, Appl. Geochem., 1998, 13, 509 CrossRef CAS.
- T. Noike, K. Nakamura and J. Matsumoto, Water Res., 1983, 17, 21 CrossRef CAS.
- D. K. Nordstrom, Selected Papers in the Hydrologic Sciences, U.S.G.S. Water-Supply Paper, 1985, vol. 2270, p. 113 Search PubMed.
Footnote |
| † Electronic supplementary information (ESI) available. See DOI: 10.1039/c7ra03717a |
| This journal is © The Royal Society of Chemistry 2017 |