 Open Access Article
Structural insight into inhibition of REV7 protein interaction revealed by docking, molecular dynamics and MM/PBSA studies†
Xiaodong Ren ab,
Rui Zeng*b,
Changwei Wangc,
Mingming Zhangd,
Chengyuan Liange,
Zhonghai Tangf and
Jinfeng Reng
aDepartment of Pharmacy, Guizhou Provincial People's Hospital, Guiyang 550002, P. R. China
bCollege of Pharmacy, Southwest University for Nationalities, Chengdu 610041, P. R. China. E-mail: rzeng@swun.edu.cn
cGuangzhou Institute of Biomedicine and Health (GIBH), Chinese Academy of Sciences (CAS), Guangzhou, Guangdong 510530, P. R. China
dSchool of Pharmacy, Fudan University, Shanghai 201203, P. R. China
eDepartment of Pharmacy, Shaanxi University of Science & Technology, Xi'an 710021, P. R. China
fCollege of Bioscience and Biotechnology, Hunan Agriculture University, Changsha 410128, Hunan, P. R. China
gDepartment of Medicine, Stony Brook University, Stony Brook, New York. 11794, USA
First published on 24th May 2017
Abstract
In mammalian cells, DNA polymerase ζ (Pol ζ) catalyzes the TLS step of ICLR. By acting simultaneously with Y-family DNA polymerase, Pol ζ completes replication of damaged DNA without removing the damage by inserting a nucleotide opposite the lesion. It has been demonstrated that Pol ζ represents a promising target for the treatment of chemotherapy-resistant tumors. The first series of small-molecule inhibitors targeting REV7/REV3L interaction have been identified recently, however, their corresponding binding mechanism is not known. Herein, we performed docking, molecular dynamics and MM/PBSA free energy calculations to study the binding mechanism of REV7 and its inhibitors. It was demonstrated that inhibitors bind to the two pockets divided by the ‘safety-belt’ structure of REV7, which was supported by the MD simulation. In addition, 2-methylfuran is an important group with an appropriate size to form the stable complex, and hydrophobic contacts were mainly responsible for stable complex formation as revealed by free energy calculation.
Introduction
DNA interstrand crosslinks (ICLs) are highly toxic DNA lesions that covalently link two bases on the complementary strands of DNA to prevent transcription and replication by inhibiting DNA strand separation.1 Agents that induce ICLs were one of the earliest chemotherapeutic drugs which are still widely used (e.g., Cisplatin). Mammalian cells have extensive mechanisms for ICL repair (ICLR), which include nucleotide excision repair (NER), translesion DNA synthesis (TLS) and homologous recombination (HR).2,3TLS releases the DNA replication blockage by replacing the stalled replicative polymerase with a DNA polymerase specialized for TLS. It is generally considered that TLS includes two steps performed by at least two types of TLS polymerases, namely inserter and extender polymerases.4,5 In the first step, a Y-family DNA polymerase such as Pol η, Pol κ, Pol ι and REV1 functions as inserter polymerase, incorporates a nucleotide opposite the DNA lesion instead of the stalled replicative polymerase at the damage site.6 In the second step, Pol ζ functions as extender polymerase, which extends a few additional nucleotides before a replicative polymerase restarts DNA replication.7
Human Pol ζ is composed of two subunits, REV3L and REV7. REV3L is a large 350 kDa catalytic subunit and is classified as B-family DNA polymerase. REV7 is a small 24 kDa non-catalytic subunit of Pol ζ and interacts with the central region of REV3L, and the interaction is indispensable for the cellular function of REV3L.8 Pol ζ is an important determinant of tumor resistance to chemotherapeutic agents in several types of human cancers.9–13 Pol ζ expression can be used as the predictor for poor prognosis, which might be caused by the potential chemoradiation resistance of the cervical cancer patients.14 Furthermore, downregulation of REV3L expression significantly enhanced the sensitivity of human cancer cells to cisplatin therapy.10,15 Therefore, Pol ζ represents a promising target for the treatment of chemotherapy-resistant tumors.
The large size of human REV3L impedes the development of REV3L inhibitors, as it is difficult to produce REV3L for enzymatic assays, as well as 3D structural elucidation of the full-length REV3L protein. However, crystal structures of the complex of REV7 with the REV3L(1874–1893) fragment have been determined,8,16–18 which enable the development of small molecules targeting the protein–protein interaction. Structurally, the most notable feature of this interaction is that a portion of the REV3L(1874–1893) is inserted into the bridge-like ‘safety-belt’ structure of REV7 (Fig. 1).8,17,18
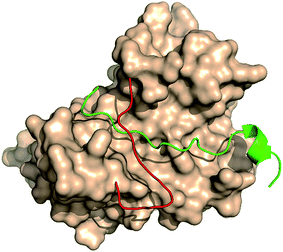 | ||
| Fig. 1 The complex of REV7 and REV3L fragment. REV7 was showed as surface except for ‘safety-belt’ (red). REV3L(1874–1893) fragment was showed as green (PDB ID: 4gk0). | ||
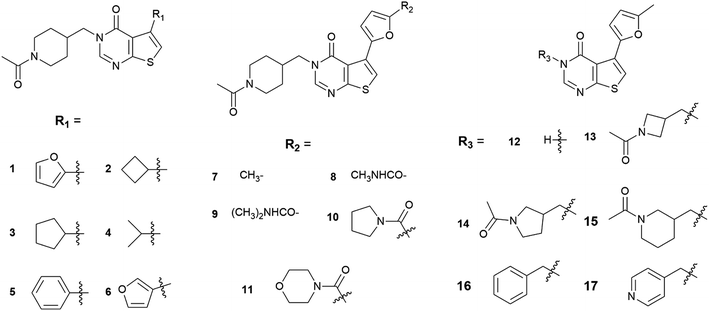
In 2016, Fujii et al. conducted a HTS to screen compounds that can inhibit the REV7/REV3L interaction, which resulted in the discovery of compound 1 (Fig. 2), an inhibitor of the interaction of REV7 with the REV7-binding sequence of REV3L.19 In the thermal shift assay, compound 1 showed a clear shift in the denaturation point of the His-REV7(R124A)/REV3L(1847–1898) complex, suggesting that compound 1 exchanged with REV3L(1847–1898) in the complex but was not nonspecifically bound on the complex. The pull-down assay also indicated that both compound 1 and REV3L(1875–1895) can exchange with the biotin-AviTagREV3L(1846–1898) in the complex, resulting in the release of His-REV7(R124A) from the beads. Both assays confirmed that compound 1 is a true inhibitor of the REV7–REV3L(1875–1895) interaction. However, the IC50 of 1 is more than 100 μM. With 1 as a lead compound, its analogs 2–17 (Fig. 2) were synthesized and evaluated for REV7/REV3L interaction inhibition. Compound 7, 13, 14 and 15 exhibited a better activity than 1. Compound 7, with an IC50 of 78 μM, was selected for further investigation. It was demonstrated that 7 bound directly to REV7 in nuclear magnetic resonance analyses, and inhibited the reactivation of a reporter plasmid containing an ICL in between the promoter and reporter regions. Furthermore, the normalized clonogenic survival of HeLa cells treated with cisplatin and compound 7 was lower than that for cells treated with cisplatin only.
The study indicated that a small-molecule inhibitor of the REV7/REV3L interaction can chemosensitize cells by inhibiting ICLR. However, as the first series of REV7 inhibitor, the binding mechanism of the inhibitor to REV7 is not known. Herein, we performed molecular docking, molecular dynamics, and binding free energy calculation to understand the binding mechanism of the inhibitors to the receptor, which will facilitate further design and development of more potent inhibitor targeting REV7/REV3L interaction.
Materials and methods
Protein and ligand preparation
The complex of REV7/REV3L was obtained from the RCSB Protein Data Bank (http://www.rcsb.org) with entry code 4gk0, and only the chain A was kept for further study.16 Three missing residues (107–109 aa) which are far from the REV7/REV3L binding interface were built by the ‘Model Loops’ module of Chimera 1.11.2,20 which was subjected to 3Drefine21 for structural refinement and the resulting structure was used for docking study. All of the 3D structure of small molecules were built and energy minimized using Avogadro v1.2.0.22Molecular docking
AutoDock 4.2.3 program package was used for molecular docking. AutoDock Tools 1.5.6 (ADT) was used to prepare the PDBQT file format of ligands and protein.23 The docking calculations were performed by locating a 100 × 100 × 66 points grid map and with a 0.375 Å grid point spacing which covers the entire interface of REV3L/REV7. 250 independent docking runs were performed for each docking simulation with 2![[thin space (1/6-em)]](https://www.rsc.org/images/entities/char_2009.gif) 500
500![[thin space (1/6-em)]](https://www.rsc.org/images/entities/char_2009.gif) 000 energy evaluations for each run. Other docking parameters were set to default. In docking calculations, the obtained poses were ranked using an energy-based scoring function. After all outputs were clustered based on the root mean squared deviation (RMSD) values, the top pose of docked ligands with the lowest energy in the biggest cluster were saved. For all docking analyses, only the best-scored pose was taken into account.
000 energy evaluations for each run. Other docking parameters were set to default. In docking calculations, the obtained poses were ranked using an energy-based scoring function. After all outputs were clustered based on the root mean squared deviation (RMSD) values, the top pose of docked ligands with the lowest energy in the biggest cluster were saved. For all docking analyses, only the best-scored pose was taken into account.
Molecular dynamics simulation
MD simulation of the interested complexes were carried out using GROMACS 2016.1 package.24 Autodock generated docking conformation of REV7-ligand complexes with lowest binding energy were taken as the initial conformation for MD simulation. The protein was processed by Gromacs with AMBER99SB force field25 to generate coordinates and topology files. The ligands were parameterized using a general amber force field (GAFF)26 with ACPYPE software,27 and AM1-BCC charge model28,29 was used to assign charges to the ligands (the GAFF parameters for ligands generated by ACPYPE are provided in the ESI†). The complex was immersed in a dodecahedron box of TIP3P water molecules using a solute-box distance of 1.0 nm, and periodic boundary condition was used. Energy minimization was performed using the steepest descent method of 10![[thin space (1/6-em)]](https://www.rsc.org/images/entities/char_2009.gif) 000 steps followed by the conjugate gradient method for 10
000 steps followed by the conjugate gradient method for 10![[thin space (1/6-em)]](https://www.rsc.org/images/entities/char_2009.gif) 000 steps to release conflicting contacts. After applying position restraints on protein and inhibitors, NVT equilibration was done at 300 K and 100 ps of run followed by NPT equilibration of 100 ps with Parrinello–Rahman barostat at reference pressure of 1 bar. After equilibration, production MD run was performed for 20 ns for each complex. Particle-mesh Ewald algorithm was used for long-range electrostatic interactions, and short-range electrostatics and van der Waals cutoffs were set at 1.4 nm. The atomic coordinates were recorded every 10 ps during the MD simulation. Representative structures were chosen by RMSD-based conformational clustering with the gromos algorithm. All the structural images were generated using Pymol 1.8.30
000 steps to release conflicting contacts. After applying position restraints on protein and inhibitors, NVT equilibration was done at 300 K and 100 ps of run followed by NPT equilibration of 100 ps with Parrinello–Rahman barostat at reference pressure of 1 bar. After equilibration, production MD run was performed for 20 ns for each complex. Particle-mesh Ewald algorithm was used for long-range electrostatic interactions, and short-range electrostatics and van der Waals cutoffs were set at 1.4 nm. The atomic coordinates were recorded every 10 ps during the MD simulation. Representative structures were chosen by RMSD-based conformational clustering with the gromos algorithm. All the structural images were generated using Pymol 1.8.30
Binding free energy calculation
The Molecular Mechanics/Poisson–Boltzmann Surface Area (MM/PBSA) method31 is the widely used method for binding free energy calculations from the snapshots of MD trajectory. The binding free energies of the complexes between ligands and REV7 were analyzed during equilibrium phase by taking 200 snapshots at an interval of 50 ps from 10 to 20 ns MD simulations using the g_mmpbsa tool.32Results and discussions
Molecular docking
In the present study, we applied the molecular docking to gain structural insight into the binding modes of REV7 and its inhibitors. There are 16 analogs (2–17) of compound 1 which were synthesized and evaluated for REV7/REV3L interaction inhibition. The activity results were classified as active, ‘modest’ and inactive according to the literature (Table 1). For comparison, all of the compounds were docked into the REV7 at the REV3L-binding domain. As there is a chiral center in 14 and 15, both the R and S configurations were investigated in the following studies. The binding energy for each compound was calculated by Autodock and summarized in Table 1. It was demonstrated from the table that the active compounds (7, 13, 14R/S, 15R/S) have an overall lower binding energy. ‘Modest’ and inactive compounds 1, 2, 4, 6, 8, 9, 12, 16 and 17 have a higher binding energy than all of the active compounds, while only 3, 5, 10 and 11 have a comparable or lower binding energy than the active compounds.| Compounds | Activitya | Binding energy (kcal mol−1) |
|---|---|---|
| a IC50 values were not provided in the literature except for 7 (IC50 = 78 μM). According to the inhibition results in different concentration, the activity was classified as ‘active’: compounds inhibit REV7 at 100 μM; ‘modest’: compounds inhibit REV7 at 300 μM; ‘inactive’: compounds didn't inhibit REV7 at 300 μM. | ||
| 1 | Modest | −8.98 |
| 2 | Inactive | −9.35 |
| 3 | Inactive | −9.71 |
| 4 | Inactive | −8.73 |
| 5 | Inactive | −9.60 |
| 6 | Inactive | −8.96 |
| 7 | Active | −9.68 |
| 8 | Modest | −9.27 |
| 9 | Modest | −9.27 |
| 10 | Inactive | −9.98 |
| 11 | Modest | −10.57 |
| 12 | Modest | −6.81 |
| 13 | Active | −9.72 |
| 14R | Active | −9.42 |
| 14S | −10.03 | |
| 15R | Active | −9.92 |
| 15S | −9.83 | |
| 16 | Inactive | −9.25 |
| 17 | Modest | −8.86 |
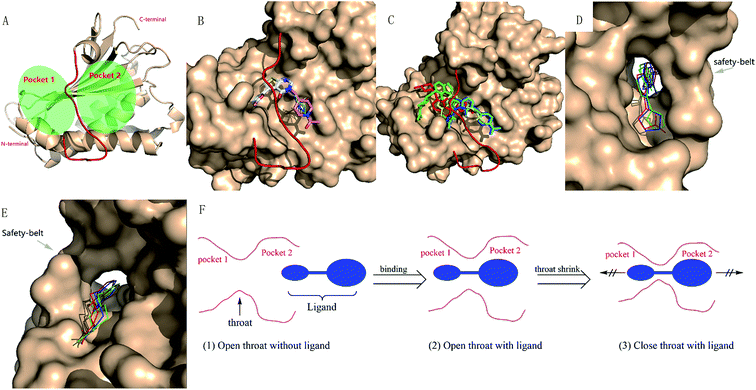
To better analyze the binding pose, we designated the REV7/REV3L interface as two pockets (Fig. 3A). By positioning the C-terminal to the top and N-terminal to the bottom, with the ‘safety-belt’ faced with the viewer, the entire groove was divided by the ‘safety-belt’ (red) as two pockets. The left pocket was named as pocket 1, while the right one as pocket 2. As shown in Fig. 3B, the active compounds 13, 14R/S, 15R/S share similar binding pose, while 7 overlapped with them by 2-methylfuran moiety, with its N-acetylpiperidine group projected to another direction. Another important feature is that all of the active compounds occupied both the pocket 1 and pocket 2. Inactive compounds 3, 5 and 10 or ‘modest’ compound 11 have comparable or lower binding energy than the active compounds, but 5, 10, 11 have different binding poses with the active compounds, only compound 3 has a good overlap with 7 (Fig. 3C). The other “modest” or inactive compound 1, 2, 4, 6, 8, 9, 12, 16 and 17 have a higher binding energy, which is consistent with its experimental activity.
By further analyzing the binding mode of compound 1, 3 and 7, we would like to explain the binding process as follow. As shown in Fig. 3D–F, there is a narrow hole (hereafter termed as ‘throat’) between pocket 1 and pocket 2. The uncomplexed ‘safety-belt’ is a highly flexible region which is the major reason that uncomplexed REV7 has not been solved until now. An effective inhibitor must pass through the ‘throat’ when the ‘throat’ is in an open state. After passing through the ‘throat’, pocket 1 and pocket 2 are both occupied by the ligand, then the receptor–ligand forms a stable complex, with the ‘throat’ shrinking to a close state to avoid the dissociation of ligand from the receptor. All of the active compounds have a 2-methylfuran group, and the methyl group is vital to the activity. Comparison of compounds 1, 3 and 7 indicated that 1, 3 and 7 can pass through the ‘throat’ from pocket 2 to pocket 1, compound 7 can form stable complex while 1 and 3 with less steric hindrance can more easily retreat back from the ‘throat’ to pocket 2. ‘Modest’ compound 8 and 9, with a larger group on furan, are probably less likely to even pass through the ‘throat’. When REV3L fragment binds to REV7 and forms a stable complex, it should also undergo such ‘insertion-shrink’ process. But the REV3L fragment is linear and flexible, its binding to REV7 can be reversible by retreating from the ‘throat’, as demonstrated by previous results that inhibitor and REV3L(1875–1895) can exchange with the biotin-AviTagREV3L(1846–1898) in the complex.
Although the 3D structure of REV7 complexed with REV3L is relatively a closed state compared with un-complexed REV7. It is reasonable to use the REV3L-binding REV7 in a closed state for docking, as the complex of REV7 with an effective small-molecule ligand should also undergo a conformation change to form a stable complex. The obtained binding pose and the activity result for each compound can be reasonably explained by the proposed binding process, which will be further investigated by MD simulation.
Molecular dynamics simulation
In our study, 200 snapshots were extracted at every 50 ps of stable intervals from 10–20 ns MD trajectory. The binding free energy and its corresponding components obtained from the MM/PBSA calculation of the REV7-inhibitor complexes are listed in Table 2. As shown in the table, all of the active compounds with comparative activity have close binding free energies and the difference of binding energies between R and S configuration for 14 and 15 are not obvious. It was found that according to free energy calculations, hydrophobic contacts (vdW energy) are a key to REV7 inhibition by this series of inhibitors.
| Compounds | van der Waal (kJ mol−1) | Electrostatic (kJ mol−1) | Polar solvation (kJ mol−1) | Non-polar solvation (kJ mol−1) | Binding energy (kJ mol−1) |
|---|---|---|---|---|---|
| 7 | −192.724 ± 12.842 | −39.998 ± 11.821 | 126.344 ± 10.639 | −17.949 ± 0.884 | −124.328 ± 11.819 |
| 13 | −194.931 ± 16.333 | −48.466 ± 8.457 | 126.833 ± 14.485 | −17.549 ± 0.709 | −134.113 ± 12.426 |
| 14R | −202.300 ± 12.772 | −51.260 ± 14.434 | 145.103 ± 9.811 | −18.726 ± 0.623 | −127.182 ± 12.563 |
| 14S | −184.414 ± 11.939 | −31.278 ± 6.912 | 115.095 ± 8.224 | −17.850 ± 0.804 | −118.448 ± 11.749 |
| 15R | −220.153 ± 11.894 | −34.456 ± 8.297 | 131.485 ± 9.963 | −19.162 ± 0.750 | −142.286 ± 11.059 |
| 15S | −216.508 ± 15.172 | −50.826 ± 12.109 | 144.168 ± 11.172 | −19.550 ± 0.801 | −142.716 ± 14.869 |
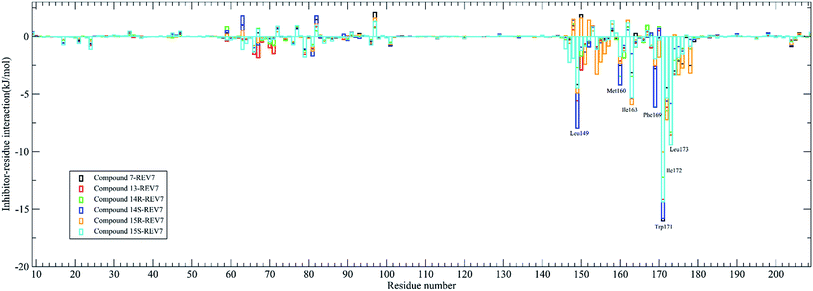
The contribution of residues to the binding energy are also calculated by the g_mmpbsa tool and was shown in Fig. 5. It was demonstrated that residues Leu149, Met160, Ile163, Phe169, Trp171, Ile172, and Leu173 are the key residues for most of the active compounds binding to REV7. It has been demonstrated that Trp171 in REV7 are crucial for the physical interaction with REV3L by previous in vitro binding assays using alanine mutants of REV7,8 which is consistent with our result that Trp171 contributes the most binding energy for all of the active compounds.
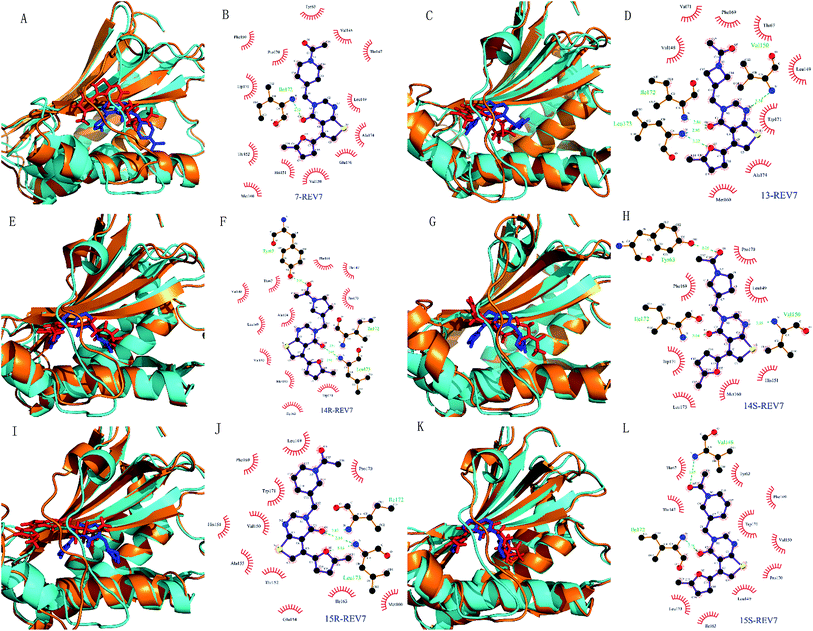 | ||
| Fig. 6 Conformation change of the simulated complexes and interaction mode for representative complex. (A, C, E, G, I and K) are complexes of REV7 with compounds 7, 13, 14R, 14S, 15R, and 15S. For each comparison diagram, representative MD simulated REV7 (orange) and ligands (red) were aligned to the initial REV7 structure (cyan) and ligands (blue). (B, D, F, H, J and L) are 2D schematic diagrams for MD simulated representative complexes of REV7 with 7, 13, 14R, 14S, 15R and 15S generated by Ligplot v.4.5.3.34 In the 2D schematic diagrams, hydrogen bonds are indicated by dashed lines between the atoms involved, while hydrophobic contacts are represented by an arc with spokes radiating towards the ligand atoms they contact. The contacted atoms are shown with spokes radiating back. | ||
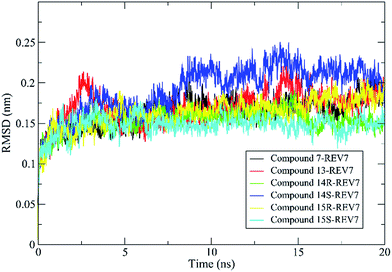
Molecular dynamics simulations of pharmaceutically relevant protein targets in complex with (putative) ligands have provided useful information in drug design, and several examples using MD simulations for the drug design have been reviewed.35 In this study, molecular dynamics was used for validation of predicted binding mode. All of the complexes of REV7 and active compounds reached equilibrium after 10 ns of the simulation phase revealed by RMSD, which showed that the trajectories of the MD simulations for all of the complexes after equilibrium are reliable for further analyses. All of the representative complexes showed that although the ‘safety-belt’ have a big fluctuation, the 2-methylfuran moiety stay in the pocket 1, without skidding out to pocket 2 through the ‘throat’, which support our hypothesis of binding mode shown in Fig. 3F.
Conclusion
In the present study, the binding pattern of REV7/REV3L protein interaction and its first series of inhibitors were investigated by using molecular docking, molecular dynamics as well as MM/PBSA free energy calculation. Molecular docking revealed that all active compounds (7, 13, 14R/S, 15R/S) bind to the two pockets divided by ‘safety-belt’ structure of REV7 and the bindings were found to be stable throughout MD simulation. The hydrophobic contacts were mainly responsible for stable complex formation as revealed by the vdW energy and Ligplot analysis. 2-Methylfuran is an appropriate group to both passing through the ‘throat’ and form a stable complex with REV7 in the ‘safety-belt’ region.The recently identified inhibitors for REV7/REV3L protein interaction provided hope for developing small-molecule inhibitors targeting Pol ζ for the treatment of chemotherapy-resistant tumors. Limited activity data, as well as lacking of 3D structure of uncomplexed REV7 make it difficult to investigate the binding mechanism. However, the present study still provides important structural insight into the binding mechanism of REV7 and its inhibitors which will facilitate further anticancer drug design and development that targeting inhibition of REV7 protein interaction.
Acknowledgements
This work was funded by the Program of Study Abroad for Young Scholars sponsored by China Scholarship Council (CSC201500850007), Sichuan Province Department of Basic Research Project (2015jy0009), Key Technologies R & D Program of Sichuan (2014SZ0131), the National Natural Science Foundation of China (Grant No. 81602967) and the China Postdoctoral Science Foundation (Grant No. 2016M592898XB).References
- A. J. Deans and S. C. West, Nat. Rev. Cancer, 2011, 11, 467–480 CrossRef CAS PubMed.
- C. Clauson, O. D. Scharer and L. Niedernhofer, Cold Spring Harbor Perspect. Biol., 2013, 5, a012732 Search PubMed.
- A. J. Deans and S. C. West, Nat. Rev. Cancer, 2011, 11, 467–480 CrossRef CAS PubMed.
- G.-L. Moldovan, B. Pfander and S. Jentsch, Cell, 2007, 129, 665–679 CrossRef CAS PubMed.
- E. C. Friedberg, A. R. Lehmann and R. P. P. Fuchs, Mol. Cell, 2005, 18, 499–505 CrossRef CAS PubMed.
- H. Ohmori, E. C. Friedberg, R. P. P. Fuchs, M. F. Goodman, F. Hanaoka, D. Hinkle, T. A. Kunkel, C. W. Lawrence, Z. Livneh, T. Nohmi, L. Prakash, S. Prakash, T. Todo, G. C. Walker, Z. Wang and R. Woodgate, Mol. Cell, 2001, 8, 7–8 CrossRef CAS PubMed.
- A. V. Makarova and P. M. Burgers, DNA Repair, 2015, 29, 47–55 CrossRef CAS PubMed.
- K. Hara, H. Hashimoto, Y. Murakumo, S. Kobayashi, T. Kogame, S. Unzai, S. Akashi, S. Takeda, T. Shimizu and M. Sato, J. Biol. Chem., 2010, 285, 12299–12307 CrossRef CAS PubMed.
- S. Sharma, N. A. Shah, A. M. Joiner, K. H. Roberts and C. E. Canman, Mol. Pharmacol., 2012, 81, 778–787 CrossRef CAS PubMed.
- H. Wang, S.-Y. Zhang, S. Wang, J. Lu, W. Wu, L. Weng, D. Chen, Y. Zhang, Z. Lu, J. Yang, Y. Chen, X. Zhang, X. Chen, C. Xi, D. Lu and S. Zhao, Neuro-Oncology, 2009, 11, 790–802 CrossRef CAS PubMed.
- W. P. Roos, A. Tsaalbi-Shtylik, R. Tsaryk, F. Güvercin, N. de Wind and B. Kaina, Mol. Pharmacol., 2009, 76, 927 CrossRef CAS PubMed.
- X. Lin, J. Trang, T. Okuda and S. B. Howell, Clin. Cancer Res., 2006, 12, 563 CrossRef CAS PubMed.
- F. Wu, X. Lin, T. Okuda and S. B. Howell, Cancer Res., 2004, 64, 8029 CrossRef CAS PubMed.
- T.-Y. Shi, L. Yang, G. Yang, X.-Y. Tu, X. Wu, X. Cheng and Q. Wei, Med. Oncol., 2013, 30, 500 CrossRef PubMed.
- M. Adachi, K. Ijichi, Y. Hasegawa, T. Ogawa, H. Nakamura, Y. Yasui, M. Fukushima and K. Ishizaki, Mol. Med. Rep., 2008, 1, 695–698 CAS.
- W. Xie, X. Yang, M. Xu and T. Jiang, Protein Cell, 2012, 3, 864–874 CrossRef CAS PubMed.
- J. Wojtaszek, C.-J. Lee, S. D'Souza, B. Minesinger, H. Kim, A. D. D'Andrea, G. C. Walker and P. Zhou, J. Biol. Chem., 2012, 287, 33836–33846 CrossRef CAS PubMed.
- S. Kikuchi, K. Hara, T. Shimizu, M. Sato and H. Hashimoto, J. Biol. Chem., 2012, 287, 33847–33852 CrossRef CAS PubMed.
- M. L. Actis, N. D. Ambaye, B. J. Evison, Y. Shao, M. Vanarotti, A. Inoue, E. T. McDonald, S. Kikuchi, R. Heath, K. Hara, H. Hashimoto and N. Fujii, Bioorg. Med. Chem., 2016, 24, 4339–4346 CrossRef CAS PubMed.
- E. F. Pettersen, T. D. Goddard, C. C. Huang, G. S. Couch, D. M. Greenblatt, E. C. Meng and T. E. Ferrin, J. Comput. Chem., 2004, 25, 1605–1612 CrossRef CAS PubMed.
- D. Bhattacharya, J. Nowotny, R. Cao and J. Cheng, Nucleic Acids Res., 2016, 44, W406–W409 CrossRef PubMed.
- M. D. Hanwell, D. E. Curtis, D. C. Lonie, T. Vandermeersch, E. Zurek and G. R. Hutchison, J. Cheminf., 2012, 4, 17 CAS.
- G. M. Morris, R. Huey, W. Lindstrom, M. F. Sanner, R. K. Belew, D. S. Goodsell and A. J. Olson, J. Comput. Chem., 2009, 30, 2785–2791 CrossRef CAS PubMed.
- M. J. Abraham, T. Murtola, R. Schulz, S. Páll, J. C. Smith, B. Hess and E. Lindahl, SoftwareX, 2015, 1–2, 19–25 CrossRef.
- V. Hornak, R. Abel, A. Okur, B. Strockbine, A. Roitberg and C. Simmerling, Proteins: Struct., Funct., Bioinf., 2006, 65, 712–725 CrossRef CAS PubMed.
- J. Wang, R. M. Wolf, J. W. Caldwell, P. A. Kollman and D. A. Case, J. Comput. Chem., 2004, 25, 1157–1174 CrossRef CAS PubMed.
- A. W. Sousa da Silva and W. F. Vranken, BMC Res. Notes, 2012, 5, 367 CrossRef PubMed.
- A. Jakalian, D. B. Jack and C. I. Bayly, J. Comput. Chem., 2002, 23, 1623–1641 CrossRef CAS PubMed.
- A. Jakalian, B. L. Bush, D. B. Jack and C. I. Bayly, J. Comput. Chem., 2000, 21, 132–146 CrossRef CAS.
- The PyMOL Molecular Graphics System, Version 1.8, Schrödinger, LLC Search PubMed.
- P. A. Kollman, I. Massova, C. Reyes, B. Kuhn, S. Huo, L. Chong, M. Lee, T. Lee, Y. Duan, W. Wang, O. Donini, P. Cieplak, J. Srinivasan, D. A. Case and T. E. Cheatham, Acc. Chem. Res., 2000, 33, 889–897 CrossRef CAS PubMed.
- R. Kumari, R. Kumar and A. Lynn, J. Chem. Inf. Model., 2014, 54, 1951–1962 CrossRef CAS PubMed.
- N. Homeyer and H. Gohlke, Mol. Inf., 2012, 31, 114–122 CrossRef CAS PubMed.
- A. C. Wallace, R. A. Laskowski and J. M. Thornton, Protein Eng., Des. Sel., 1995, 8, 127–134 CrossRef CAS.
- H. Zhao and A. Caflisch, Eur. J. Med. Chem., 2015, 91, 4–14 CrossRef CAS PubMed.
Footnote |
| † Electronic supplementary information (ESI) available. See DOI: 10.1039/c7ra03716c |
| This journal is © The Royal Society of Chemistry 2017 |

