 Open Access Article
Creative Commons Attribution 3.0 Unported Licence
Oxygen-vacancy-induced photoelectrochemical water oxidation by platelike tungsten oxide photoanodes prepared under acid-mediated hydrothermal treatment conditions†
Mohammad Hassan Mirfasiha,
Changli Liab,
Ahmad Tayyebic,
Qi Caoa,
Jun Yua and
Jean-Jacques Delaunay *a
*a
aSchool of Engineering, The University of Tokyo, 7-3-1 Hongo, Bunkyo-ku, Tokyo 113-8656, Japan. E-mail: jean@mech.t.u-tokyo.ac.jp
bSchool of Materials Science and Engineering, Tsinghua University, Beijing 100084, P.R. China
cDepartment of Civil and Environmental Engineering, University of Ulsan, Nam-gu, Daehak-ro 93, Ulsan 680-749, Republic of Korea
First published on 22nd May 2017
Abstract
Introduction of oxygen vacancies in tungsten oxide photoanodes has been reported as an effective route towards enhancing the solar-driven water oxidation photocurrent. Therefore, it is reasonable to seek facile methods for controlling the number of oxygen vacancies in these photoanodes. Herein, a simple acid-mediated hydrothermal treatment method followed by calcination is utilized to fabricate tungsten oxide photoanodes. It is found that the variation of acid treatment temperature prior to calcination could influence the concentration of oxygen vacancies in the prepared platelike tungsten oxide photoanodes. These defects act as electron donors thus, they result in enhanced photoelectrochemical performance. Using XRD and Raman analyses, an insight is gained into the structure of the samples treated by acid-mediated hydrothermal method. Based on that, a correlation is made between the number of the intercalated water molecules in WO3·nH2O (n = 1 or 2) with the formation of oxygen vacancies during the calcination step. This finding is confirmed by XPS and Mott–Schottky analyses. At the optimum acid-mediated hydrothermal treatment temperature (75 °C), a photocurrent of 1.06 mA cm−2 at 1.23 V vs. RHE is obtained. This is six times larger than the photocurrent produced by the sample fabricated at a higher temperature of 175 °C. An IPCE of 36.2% is acquired for this sample under irradiation with 350 nm light and at an applied potential of 1.8 V vs. RHE. The IPCE of the optimum sample is three times higher than that of the sample treated at 175 °C. This indicates that the mild acid-mediated hydrothermal treatment enhances photocurrent and photoelectrochemical water oxidation performance due to the increased formation of beneficial oxygen vacancy defects.
Introduction
Solar energy usage can be a reliable resolution for the issue of overconsumption of fossil fuel resources and the consequent contribution to global warming. Although highly efficient photovoltaic systems have been developed during the past decades, relying on this power source in industries makes them operable only during sunny days. To address this issue, photoelectrochemical (PEC) water splitting has been introduced as a potentially viable alternative in order to produce solar fuels. As they can be stored and continuously utilized, production of this class of clean energies is significantly advantageous.1–3 Among the wide range of n-type semiconductor materials used, WO3 has been of interest for being earth abundant and having appropriate electron transport properties (having a much higher electron mobility of ∼12 cm2 V−1 S−1 compared to TiO2 with an electron mobility of about 0.3 cm2 V−1 S−1). Additionally, it has been of interest due to its moderate 150 nm hole diffusion length (more favorable compared to hematite with a 2–4 nm hole diffusion length) and its solar spectrum absorption (12% for an energy band gap of Eg = 2.5–2.8 eV). Using tungsten oxide, as a photoanode coupled with a counter electrode such as a Pt wire can ideally lead to a 4.8% solar to hydrogen efficiency (STH) and a photocurrent density of 3.9 mA cm−2 under simulated solar irradiation (100 mW cm−2 AM 1.5 G). It should be noted that contrary to most metal oxides, tungsten oxide is thermodynamically stable in acidic solutions (pH = 4).4,5 However, high rate of electron–hole recombination prevents tungsten oxide from reaching its ideal photoelectrochemical performance.6 Several strategies have been studied both theoretically and experimentally to overcome these limitations such as nanostructure engineering,7–12 crystal structure tailoring,13,14 transition metal element doping with elements like Cu,15 Fe,16 Co,16 Ni,16 Zn,16 Ti,17 V,18 Ta,19 Mo,20 doping by incorporation of alkali metal elements for instance Li, Na, K, Cs and Rb21 and non-metal element doping by intercalating elements like N,22–24 S25 and I25 into WO3. Moreover, another strategy is heterostructuring via the coupling of WO3 with proper n-type and p-type semiconductor materials to maintain band alignment and meanwhile benefiting from the advantages of both materials simultaneously.13Besides the above-mentioned strategies, introducing oxygen vacancies and manipulating their density has been recently investigated as a viable solution in order to improve the photoactivity and photoelectrochemical performance of photoanodes.26 Wang et al. reported that calcination of rutile titanium dioxide nanowires at elevated temperatures under ultrahigh purity hydrogen atmosphere could lead to a ten-fold increase in the photocurrent at −0.6 V vs. Ag/AgCl compared to untreated samples (1 M NaOH electrolyte and under irradiation of 100 mW cm−2 AM 1.5G). The reason behind this enhancement was correlated to an increase by three orders of magnitude in the density of oxygen vacancies that act as electron donors.27 Zhu et al. used air plasma treatment as a route to incorporate oxygen vacancies in hematite nanoflake photoanodes and reported about eight times enhancement in photocurrent at 1.23 V vs. RHE under illumination with a 500 W Xe lamp (285 mW cm−2).28 Manipulation of oxygen deficiency in WO3 has also been studied as a promising method to boost up its photoelectrochemical performance. Wang et al. showed that, similar to TiO2, hydrogen treatment of WO3 photoanodes at a temperature as high as 350 °C leads to an order of magnitude increase in photocurrent and also made the material more stable against photocorrosion.29 Li et al. used air-treatment as a method to tune the density of oxygen vacancies in hydrothermally grown hierarchical-structured WO3 samples and concluded that the photocatalytic performance would enhance provided that an optimized amount of oxygen vacancies be introduced.6 Furthermore, Mohamed et al. altered the calcination atmosphere in order to engineer defects and consequently categorized the resultant defects into detrimental and favorable ones. These kinds of defects create shallow and deep inter-band gap defect states, respectively. It was reported that although hydrogen treatment results in a remarkably high density of oxygen vacancies, it induces both shallow and deep defects states.26
Considering the above-mentioned strategies to tune density of oxygen vacancies, the processes seem to be complex and energy-consuming. Here, a facile low-temperature acid-mediated hydrothermal treatment method has been used to tune oxygen vacancies concentration in WO3 photoanodes. The photoanodes were prepared by treatment of tungsten foil pieces in nitric acid at different temperatures. The effect of nitric acid treatment temperature on the photoelectrochemical performance of the calcinated photoanodes is studied. It is seen that low-temperature acid treatment favors enhanced photoelectrochemical performance by incorporating oxygen vacancies acting as electron donors.
Experimental
Preparation of platelike tungsten oxide
In order to prepare platelike tungsten oxide photoanodes, high purity (99.99%) tungsten foils having 0.1 mm thickness were purchased from Nilaco Corporation. The foils were cut into 10 × 10 mm2 pieces before using them for the acid-mediated hydrothermal treatment process. The pieces were then degreased and cleaned ultrasonically in acetone, ethanol and deionized water respectively, each for 10 minutes and subsequently dried under blown air. The rinsed tungsten foil pieces were immersed inside a Teflon-lined stainless steel autoclave (Taiatsu Techno 100 cc) containing 50 cc nitric acid (1.5 M in deionized water), and the autoclave was inserted into a program-controlled oven (DOV-300P). The oven temperature was controlled to be constant for three hours at the different temperatures of room temperature (RT), 50 °C, 75 °C, 100 °C, 125 °C, 150 °C, and 175 °C (the ramp heating rate was 2 °C min−1). The samples are labeled as W-RT, W-50, W-75, W-100, W-125, W-150 and W-175 and have a yellowish green color. Subsequently, the samples were calcinated and turned into a grayish blue color. The calcinated samples were labeled as c-W-RT, c-W-50, c-W-75, c-W-100, c-W-125, c-W-150, and c-W-175. Prior to the calcination, the hydrothermally treated samples in nitric acid were rinsed three times with deionized water to remove residual nitric acid on their surface and dried using by blowing air. Thereafter the samples were put in the center of an alumina crucible and transferred to a muffle furnace (Yamato, FO100) in order to carry out the calcination process. The calcination process consisted of heating the acid-mediated hydrothermally treated samples at 450 °C for one hour with a heating rate of 10 °C per minute to remove water content and obtaining tungsten oxide substrates. Finally, these samples were used to fabricate the photoanodes.Structural characterization
To study the morphology of the samples, a field emission scanning electron microscope (Hitachi S4700) was used. X-ray diffraction (XRD) measurements were carried out using a SmartLab Rigaku Co. Ltd, Japan with Cu Kα radiation. The measurements were performed in the range between 10 and 40° with a scan step of 0.02° and a scan rate of 1° per minute. A Renishaw inVia Raman microscope system with 488 nm excitation light (0.82 mW) was utilized to acquire Raman spectra. The UV-vis diffuse reflectance technique was used to record the optical properties utilizing a spectrophotometer equipped with an integrating sphere (V-560 and DRS, JASCO). X-ray photoelectron spectroscopy (XPS) spectra were recorded using a JEOL JPS-9200 XPS system with an Al Kα X-ray source (1486.3 eV).Photoelectrochemical measurements
Photoelectrochemical water splitting process was carried out in a three-electrode cell using the fabricated tungsten oxide photoanodes as the working electrodes, Pt wire as the counter electrode and Ag/AgCl electrode as the reference electrode. The electrodes utilized in the cell were connected to a potentiostat (VersaSTAT 4, Princeton Applied Research) to control the potential of the working electrode and the samples were scanned with a 10 mV s−1 rate by sweeping potentials from negative to positive. Using the Nernst equation , potentials vs. RHE was acquired where EAg/AgCl is the measured potential of the working electrode compared to the Ag/AgCl reference electrode and
  is equal to 0.1976 V at room temperature. The electrolyte used in the three-electrode cell was 0.5 M Na2SO4 (pH 5.9) and was stirred and degassed by circulating N2 before and during the experiment. The light source was a 500 W xenon lamp irradiating 285 mW cm−2 on the samples. Using bandpass filters (full widths at half maximum of ±38 nm) with centered wavelengths at 350, 400, 450, 500 and 550 nm, the incident photon conversion efficiencies (IPCE) were determined for the applied potentials of 1.23 and 1.8 V vs. RHE. The equation used to calculate IPCE was IPCE = [(1240/λ) × (Jlight − Jdark)/Plight] × 100, where Jlight is the steady-state photocurrent density at λ (wavelength of incident light), Jdark is the dark current density and Plight represents light power at the specific wavelengths. The Mott–Schottky measurements were conducted under dark conditions with the three-electrode cell at a frequency of 1000 Hz and a scan rate of 10 mV s−1 using the same electrolyte that was used for the photoelectrochemical performance measurements.
Results and discussion
As can be seen in Fig. 1, acid-mediated hydrothermal treatment of tungsten foils in nitric acid solution results in plate-like structures, and the plate-like morphology is maintained after calcination in air at 450 °C for one hour. The samples also exhibit slight growth in their plate size upon calcination, as clearly seen by comparing Fig. 1(e) and (f). By comparing Fig. 1(a), (c) and (e), it should be concluded that the plates grow thicker as the temperature of the acid-mediated hydrothermal treatment process is increased from room temperature to 125 °C. Considering the hole diffusion length in tungsten trioxide (150 nm), the growth of the plates may cause detrimental effects on the acquired photocurrent as structures smaller than the minority carrier diffusion length should help to decrease electron–hole pair recombination rates.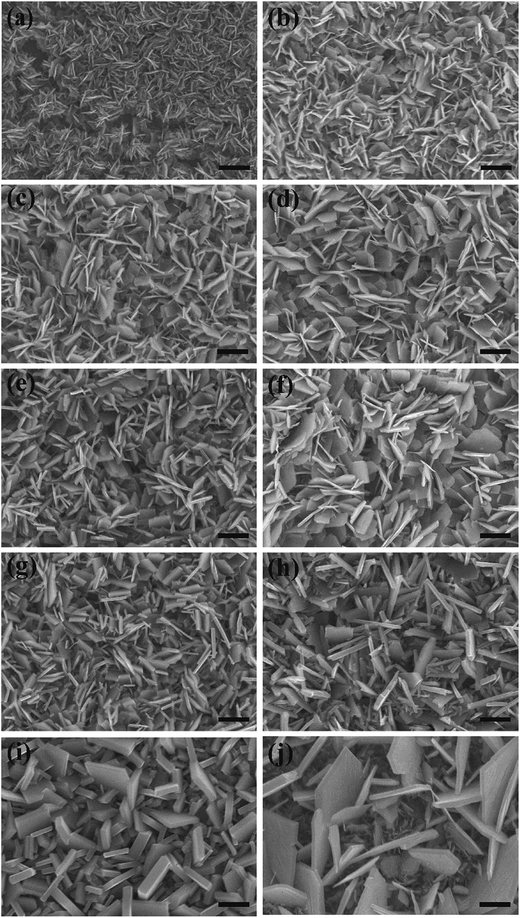 | ||
| Fig. 1 Top view FESEM images of samples (a) W-RT, (b) c-W-RT, (c) W-50, (d) c-W-50, (e) W-75, (f) c-W-75, (g) W-100, (h) c-W-100, (i) W-125, and (j) c-W-125. The scale bar is equal to 1 μm. | ||
XRD measurement results for the acid-mediated hydrothermal treated samples and the calcinated samples are reported in Fig. 2(a) and (b), respectively. Before calcination (Fig. 2(a)), the samples prepared by acid-mediated hydrothermal treatment in different temperatures contain the orthorhombic tungsten oxide monohydrate (WO3·H2O) phase (JCPDS no. 43-0679) and/or the monoclinic tungsten oxide dihydrate (WO3·2H2O) phase (JCPDS no.16-0166). The XRD pattern of the sample W-50 corresponds well with the standard XRD pattern of the monoclinic tungsten oxide dihydrate. Meanwhile, the XRD pattern of the sample W-125 was indexed precisely to the standard pattern of orthorhombic tungsten oxide monohydrate except for the weak peak at 2θ = 24.2° corresponding to (200) planes of monoclinic WO3·2H2O. The patterns for the samples W-75 and W-100 comprised mixed phases of tungsten oxide monohydrate and dihydrate. By increasing the acid-mediated hydrothermal treatment temperature from 50 °C to 75 °C, peaks related to (020) planes of the monoclinic tungsten oxide monohydrate appeared and this peak intensity increased in the patterns of samples W-100 and W-125. Through the process of increasing acid-mediated hydrothermal treatment temperature from 50 °C to 125 °C, the characteristic peak of (020) related to tungsten oxide dihydrate is shifted about 0.93° towards smaller values of 2θ to form an intense and sharp characteristic peak at 2θ = 25.50° corresponding to (111) planes of the orthorhombic monohydrate phase. It is clear that the samples W-75 and W-100 are intermediate states in this transition and therefore exhibit a peak position between the two mentioned peaks related to W-50 and W-125. It seems that the sample W-RT comparatively exhibited lower crystalline quality. Fig. 2(b) shows the XRD pattern of the samples after calcination. In Fig. 2(b), all XRD peaks were indexed to the monoclinic WO3 phase indicating a complete transformation of tungsten oxide monohydrate and dihydrate into tungsten oxide via the calcination process.
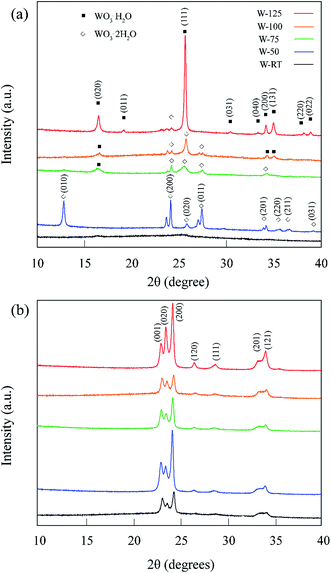 | ||
| Fig. 2 XRD pattern for the samples prepared by acid-mediated hydrothermal treatment (a) before and (b) after calcination. | ||
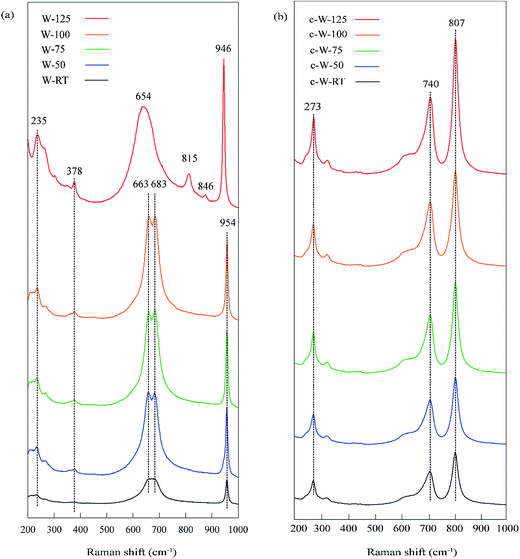
Raman spectroscopy was used to investigate the changes in chemical bonding of the samples before and after calcination and the results can be seen in Fig. 3. The bridging O–W–O vibration results in Raman features around 235 cm−1 and also between 650 and 700 cm−1 related to bending and stretching modes, respectively. The latter mode is significantly influenced by hydration level of tungsten oxide and can be used to distinguish between tungsten oxide monohydrate and dihydrate phases. As seen in Fig. 3(a), a broad asymmetric peak around 654 cm−1 representing a characteristic Raman feature of tungsten monohydrate was detected for the sample W-125. However, the characteristic double peaks of tungsten dihydrate around 663 cm−1 and 683 cm−1 appeared for other samples. This result also confirms the XRD analysis outcome about the existence of monohydrate and dihydrate phases in samples before calcination. The peak around 378 cm−1 is related to stretching modes of W–OH2 and the peak around 954 cm−1 indicates stretching modes related to the double bond of tungsten atom with terminal oxygen atoms (W![[double bond, length as m-dash]](https://www.rsc.org/images/entities/char_e001.gif) O). The peak at 954 cm−1 is slightly shifted towards smaller Raman shift values for the sample W-125, thus confirming the presence of tungsten oxide monohydrate phase at this temperature. After calcination, the broad peak around 654 cm−1 is replaced by two sharp bands around 710 and 805 cm−1 for all samples indicating that the samples are transformed into monoclinic WO3 upon calcination.30–33 Thus, the Raman spectra results are in agreement with XRD results regarding the presence of different phases before calcination.
O). The peak at 954 cm−1 is slightly shifted towards smaller Raman shift values for the sample W-125, thus confirming the presence of tungsten oxide monohydrate phase at this temperature. After calcination, the broad peak around 654 cm−1 is replaced by two sharp bands around 710 and 805 cm−1 for all samples indicating that the samples are transformed into monoclinic WO3 upon calcination.30–33 Thus, the Raman spectra results are in agreement with XRD results regarding the presence of different phases before calcination.
X-ray photoelectron spectroscopy analysis was conducted to check for possible contamination and to characterize the presence of oxygen vacancies. As can be seen in Fig. S1,† the wide scan of XPS spectra only reveals the presence of W and O elements along with a minor amount of carbon. This negligible amount of carbon is very likely related to absorbed contamination from the environment. To further elucidate the effect of the acid-mediated hydrothermal treatment conditions on the chemical states of tungsten oxide and how the chemical states interplay with the photoelectrochemical performance, high-resolution X-ray photoelectron spectroscopy was performed. As shown in the normalized high-resolution W 4f spectra (Fig. 4(a)–(f)), all spectra possess two broad peaks, corresponding to the characteristic peaks of W 4f5/2 and W 4f7/2 for tungsten oxide. The peaks can be deconvoluted into two pairs of peaks, corresponding to the typical binding energies of two sorts of W oxidation states, namely W6+ (centered at 37.5 and 35.4 eV) and W5+ (centered at 37.0 and 34.9 eV). Using the area surrounded by these deconvoluted peaks, the percentage ratio of W5+ to the whole surface area under W(4f) peak was calculated for samples at different temperatures and represented as a function of the acid-mediated hydrothermal treatment temperature in Fig. 4(h). The percentage of W5+ reaches its maximum at T = 75 °C indicating a high concentration of oxygen vacancies. It can be assumed that only the beneficial shallow defects states exist in the band gap of the samples as W4+ is not gained as a result of W 4f peak deconvolution. W4+ and other lower oxidation states mainly contribute to detrimental deep defect states and in the case of their presence, the shape of W 4f double peaks are not well separated. The presence of these detrimental deep defect states was reported to be made by treatment in pure hydrogen. As a consequence of this treatment, X-ray diffraction peaks of monoclinic WO3 was diminished and a highly amorphous material was yielded that boosted up electron–hole pair recombination rate.26,29 As we could see in Fig. 2, probable presence of only shallow defect states was the reason to conserve the crystallinity of the samples.
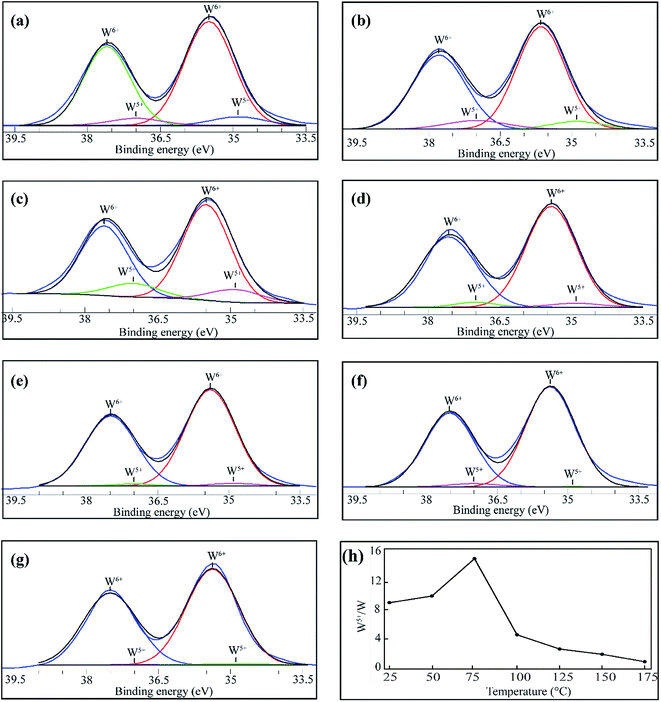 | ||
| Fig. 4 (a) to (g) XPS W 4f spectra survey of samples and (h) the effect of acid-mediated hydrothermal treatment process temperature on the relative percentage of W5+. | ||
UV-vis diffuse reflectance spectra of the samples prepared in different acid-mediated hydrothermal treatment temperatures are shown in Fig. 5(a). The absorption edge for all the samples is around 450 nm, a value corresponding well to the reported value for the typical absorption edge of WO3.6 In order to evaluate the band energy of the samples, the Kubelka–Munk function was calculated and plotted versus energy (eV) in Fig. 5(b):
 | (1) |
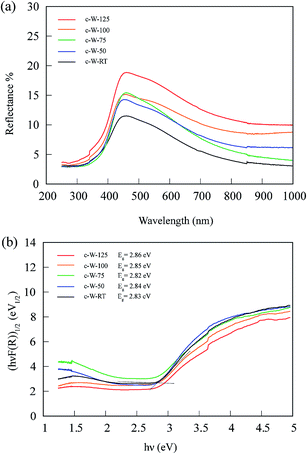 | ||
| Fig. 5 (a) Diffuse reflectance spectra of samples prepared in different temperatures of acid-mediated hydrothermal treatment. (b) Calculation of band gap energy of samples using Kubelka–Munk curves. | ||
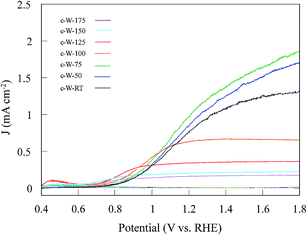
The photoelectrochemical performance of the prepared samples is evaluated using CV curves taken in 0.5 M Na2SO4 (pH 5.9) with a scan rate of 10 mV s−1 under illumination of a Xe lamp, as shown in Fig. 6. The yielded photocurrents varied with the temperature of the acid-mediated hydrothermal treatment and a maximum photocurrent of 1.06 mA cm−2 at 1.23 V vs. RHE was obtained for the sample c-W-75. For further study, additional samples were fabricated by acid-mediated hydrothermal treatment at the temperatures of 150 °C and 175 °C. It was found that the sample c-W-75 exhibited six times higher photocurrent than that of the sample c-W-175. According to XPS results, the sample c-W-75 contains the highest amount of W5+ oxidation states indicating that the concentration of oxygen vacancies in this sample reaches a plateau. These oxygen vacancies introduce shallow defect states near the conduction band of tungsten oxide that can act as electron donors and therefore result in the enhancement in the photocurrent of sample c-W-75. Incident photon-to-electron efficiency (IPCE) was also measured for the samples c-W-50, c-W-75 and c-W-125 and the results are shown in Fig. S2.† It is found that the sample c-W-75 exhibits more than three times increase in the IPCE at 1.8 V vs. RHE under 350 nm illumination. Photostability was also tested by steady-state photocurrent measurement for the samples c-W-75 and c-W-125, and the results (Fig. S3†) confirm the samples photostability in 0.5 Na2SO4 electrolyte.
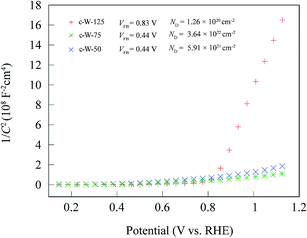
To compare the density of existing charge carriers, the Mott–Schottky analysis was performed on the samples c-W-50, c-W-75, and c-W-125. As shown in Fig. 7, all the samples exhibit a positive slope that confirms their n-type nature. Using Mott–Schottky equation, the density of donors is estimated:
 | (2) |
 versus potential, the slope of the linear part of the resultant graphs provides the donor density:
 | (3) |
It is found that the donor density of the sample c-W-75 is increased by two orders of magnitude compared to that of the sample c-W-125. These donors can facilitate charge transport by the formation of states near the conduction band. Also, it is found that the flatband potential of the sample c-W-75 shifts negatively from 0.8 to 0.4 V when the sample c-W-125 is taken as a reference. This is likely due to a significant increase in the donor density that shifts the Fermi level towards conduction band.29,35
To clarify the reason behind the higher concentration of defects in the sample c-W-75, the crystal structures of tungsten oxide monohydrate and dihydrate phases are discussed. Particularly, the effect of the dehydration process on the crystal phases is thought to be the primary cause for the formation of defects. In monoclinic tungsten oxide, each W atom is connected to six O atoms to form an octahedron. Four of the six O atoms are shared with adjacent octahedra that form a sheet or layer of the corner-shared [WO6] octahedra. These O atoms are referred to as bridging O atoms. The other two remaining O atoms connect two sheets of [WO6] octahedra and are referred to as terminal O atoms. In tungsten oxide monohydrate, a terminal O atom is replaced by a water molecule (“structural” water molecule) forming [WO5(H2O)] octahedra and the resulting sheets composed of them are connected via a network of hydrogen bonds to create an orthorhombic crystal structure. In monoclinic tungsten oxide dihydrate, the space between the sheets of [WO5(H2O)] octahedra is further increased and “interlayer” water molecules are intercalated between them. The dehydration process of tungsten oxide dihydrate comprises two steps. First, interlayer water molecules are evaporated at a temperature below 100 °C. Then the structural water molecules are removed from [WO5(H2O)] octahedra to form [WO6] as the building block for monoclinic WO3. During this process, an intermediate state of [WO5] containing a dangling bond or oxygen vacancy can be created. If the dangling bond is not healed, an oxygen vacancy would remain in the structure and serves as an electron donor site. These donors are beneficial for enhanced charge transport and photocurrent. In order to explain the higher photocurrent of the sample c-W-75 in comparison with samples containing only WO3·H2O (such as c-W-125), it can be said that having more WO3·2H2O rather than WO3·H2O prior to calcination should produce more defects upon the formation of WO3 by calcination. This is likely due to the presence of interlayer water molecules and the crystal distortion during the dehydration process. These defects import shallow states near the conduction band of tungsten oxide acting as electron donors. Therefore charge transport would be facilitated and likely lower electron–hole pair recombination rates would be acquired.26 Thus it can be concluded that the presence of these defects is favorable for obtaining improved photocurrents. Using the proposed facile method presented in this study, it is possible to form a high density of shallow defect states by calcination of the sample containing more tungsten oxide dihydrate phase rather than tungsten oxide monohydrate. Finally, the photoelectrochemical performance of the optimized sample is comparable to those of the reported oxygen-deficient WO3 photoanodes. (see Table S1 in ESI†).
Conclusion
Platelike tungsten oxide photoanodes were fabricated and the effect of temperature of the acid-mediated hydrothermal treatment of tungsten foil pieces on the concentration of oxygen vacancies and the photoelectrochemical performance was investigated. XPS analysis confirmed the variation of oxygen vacancy density in the prepared samples with the temperature used to treat the tungsten foils with nitric acid prior to the calcination step. Mott–Schottky data also confirmed the significant enhancement in the charge carrier density. This enhancement is correlated with the increase in the density of oxygen vacancies. These defects generate shallow donor states near the conduction band. The sample prepared under the optimum acid-mediated hydrothermal treatment temperature (sample c-W-75) resulted in a photocurrent as high as 1.06 mA cm−2 at 1.23 V vs. RHE that is about six times higher than that of sample W-175. It is concluded that increasing tungsten oxide dihydrate phase before calcination led to the formation of beneficial shallow defect states that should facilitate charge transport and enhance the photocurrent.Acknowledgements
The XRD analysis and SEM were performed in the Research Hub for Advanced Nano Characterization, the University of Tokyo, supported by the Ministry of Education, Culture, Sports, Science and Technology (MEXT), Japan. Part of this work was supported by the JSPS Core-to-Core program (Advanced Research Networks type A), Japan (JSPS)-Korea (NRF) Bilateral program and Grants-in-Aids for Specially Promoted Research.References
- B. M. Klahr, S. Gimenez, F. Fabregat-Santiago, J. Bisquert and T. W. Hamann, Energy Environ. Sci., 2012, 5, 7626 CAS.
- M. Grätzel, Nature, 2001, 414, 338 CrossRef PubMed.
- B. D. Alexander, P. J. Kulesza, I. Rutkowska, J. Augustynski and B. D. Alexander, J. Mater. Chem., 2008, 18, 2298 RSC.
- J. M. Spurgeon, J. M. Velazquez and M. T. McDowell, Phys. Chem. Chem. Phys., 2014, 16, 3623 RSC.
- W. Li, P. Da, Y. Zhang, Y. Wang, X. Lin, X. Gong and G. Zheng, ACS Nano, 2014, 8, 11770 CrossRef CAS PubMed.
- Y. Li, Z. Tang, J. Zhang and Z. Zhang, J. Phys. Chem. C, 2016, 120(18), 9750 CAS.
- S. S. Kalanur, Y. J. Hwang, S. Y. Chae and O. S. Joo, J. Mater. Chem. A., 2013, 1, 3479 CAS.
- S. Shin, H. S. Han, J. S. Kim, I. J. Park, M. H. Lee, K. S. Hong and I. S. Cho, J. Mater. Chem. A, 2015, 3, 12920 CAS.
- Y. Hou, F. Zuo, A. P. Dagg, J. Liu and P. Feng, Adv. Mater., 2014, 26(29), 5043 CrossRef CAS PubMed.
- D.-D. Qin, C. L. Tao, S. A. Friesen, T.-H. Wang, O. K. Varghese, N. Z. Bao, Z.-Y. Yang, T. E. Mallouk and C. A. Grimes, Chem. Commun., 2012, 48, 729 RSC.
- M. Altomare, O. Pfoch, A. Tighineanu, R. Kirchgeorg, K. Lee, E. Selli and P. Schmuki, J. Am. Chem. Soc., 2015, 137(17), 5646 CrossRef CAS PubMed.
- J. Yan, T. Wang, G. Wu, W. Dai, N. Guan, L. Li and J. Gong, Adv. Mater., 2015, 27, 1580 CrossRef CAS PubMed.
- J. Y. Zheng, Z. Haider, T. K. Van, A. U. Pawar, M. J. Kang, C. W. Kim and Y. S. Kang, CrystEngComm, 2015, 17, 6070 RSC.
- Y. P. Xie, G. Liu, L. Yin and H.-M. Cheng, J. Mater. Chem., 2012, 22, 6746 RSC.
- P. Maruthamuthu, M. Ashokkumar and K. Gurunathan, Int. J. Hydrogen Energy, 1989, 14, 525 CrossRef CAS.
- A. Hameed, M. A. Gondal and Z. H. Yamani, Catal. Commun., 2004, 5, 715 CrossRef CAS.
- G. Cai, X. Wang, D. Zhou, J. Zhang, Q. Xiong, C. Gu and J. Tu, RSC Adv., 2013, 3, 6896 RSC.
- K. Muthu Karuppasamy and A. Subrahmanyam, J. Phys. D: Appl. Phys., 2008, 41, 35302 CrossRef.
- A. Enesca, A. Duta and J. Schoonman, Phys. Status Solidi A, 2008, 205, 2038 CrossRef CAS.
- L. Zhou, J. Zhu, M. Yu, X. Huang, Z. Li, Y. Wang and C. Yu, J. Phys. Chem. C, 2010, 114, 20947 CAS.
- S. Tosoni, C. Di Valentin and G. Pacchioni, Effect of Alkali Metals Interstitial Doping on Structural and Electronic Properties of WO 3, J. Phys. Chem. C, 2014, 118(6), 3000 CAS.
- Y.-C. Nah, I. Paramasivam, R. Hahn, N. K. Shrestha and P. Schmuki, Nanotechnology, 2010, 21, 105704 CrossRef PubMed.
- Q. Mi, Y. Ping, Y. Li, B. Cao, B. S. Brunschwig, P. G. Khalifah, G. A. Galli, H. B. Gray and N. S. Lewis, J. Am. Chem. Soc., 2012, 134, 18318 CrossRef CAS PubMed.
- B. Cole, B. Marsen, E. Miller, Y. Yan, B. To, K. Jones and M. Al-Jassim, J. Phys. Chem. C, 2008, 112, 5213 CAS.
- A. J. E. Rettie, K. C. Klavetter, J. F. Lin, A. Dolocan, H. Celio, A. Ishiekwene, H. L. Bolton, K. N. Pearson, N. T. Hahn and C. B. Mullins, Chem. Mater., 2014, 26, 1670 CrossRef CAS.
- A. M. Mohamed, A. W. Amer, S. Y. AlQaradawi and N. K. Allam, Phys. Chem. Chem. Phys., 2016, 18, 22217 RSC.
- G. Wang, H. Wang, Y. Ling, Y. Tang, X. Yang, R. C. Fitzmorris, C. Wang, J. Z. Zhang and Y. L. Wang, Nano Lett., 2011, 11, 3026 CrossRef CAS PubMed.
- C. Zhu, C. Li, M. Zheng and J. J. Delaunay, ACS Appl. Mater. Interfaces, 2015, 7(40), 22355 CAS.
- G. Wang, Y. Ling, H. Wang, X. Yang, C. Wang, J. Z. Zhang and Y. Li, Energy Environ. Sci., 2012, 5, 6180 CAS.
- A. Z. Sadek, H. Zheng, M. Breedon, V. Bansal, S. K. Bhargava, K. Latham, J. Zhu, L. Yu, Z. Hu, P. G. Spizzirri, W. Wlodarski and K. Kalantar-Zadeh, Langmuir, 2009, 25, 9545 CrossRef CAS PubMed.
- M. F. Daniel, B. Desbat, J. C. Lassegues, B. Gerand and M. Figlarz, J. Solid State Chem., 1987, 67, 235 CrossRef CAS.
- N. Wang, J. Zhu, X. Zheng, F. Xiong, B. Huang, J. Shi and C. Li, Faraday Discuss., 2014, 176, 185 RSC.
- T. Zhu, M. N. Chong and E. S. Chan, ChemSusChem, 2014, 7, 2974 CrossRef CAS PubMed.
- F. Zhan, Y. Yang, W. Li, J. Li, W. Liu, Y. Li and Q. Chen, RSC Adv., 2016, 6, 10393 RSC.
- A. Mettenbörger, T. Singh, A. P. Singh, T. T. Järvi, M. Moseler, M. Valldor and S. Mathur, Int. J. Hydrogen Energy, 2014, 39, 4828 CrossRef.
Footnote |
| † Electronic supplementary information (ESI) available: Table of comparison of photoelectrochemical performances of WO3 photoanodes with oxygen vacancies, wide scan X-ray photoelectron spectroscopy of the samples, IPCE measurement and photostability test results of the prepared photoanodes are accessible. See DOI: 10.1039/c7ra03691d. |
| This journal is © The Royal Society of Chemistry 2017 |

