 Open Access Article
A novel Ir/CeO2–C nanoparticle electrocatalyst for the hydrogen oxidation reaction of alkaline anion exchange membrane fuel cells
Bowen Qinab,
Hongmei Yu *a,
Jun Chiab,
Jia Jiaab,
Xueqiang Gaoab,
Dewei Yaoab,
Baolian Yia and
Zhigang Shao
 a
a
aFuel Cell System and Engineering Group, Dalian Institute of Chemical Physics, Chinese Academy of Sciences, Zhongshan Road 457, Dalian 116023, China. E-mail: hmyu@dicp.ac.cn; Fax: +86-411-84379185; Tel: +86-411-84379051
bUniversity of Chinese Academy of Sciences, 19A Yuquan Road, Beijing 100039, PR China
First published on 20th June 2017
Abstract
Alkaline anion exchange membrane fuel cells have faster kinetics for the oxygen reduction reaction (ORR) than proton exchange membrane fuel cells; however, the hydrogen oxidation reaction (HOR) at anodes with precious metals is more sluggish under alkaline conditions than that under acidic conditions, which hinders the further development of fuel cells. Herein, a novel catalyst, iridium nanoparticle-supported ceria–carbon black (10% Ir/CeO2–C), was developed for use in the hydrogen oxidation reaction (HOR) under basic conditions. Cyclic voltammetry reveals that the electrochemical surface area of 10% Ir/CeO2–C is 1.5 times that of 10% Ir/C. The RDE measurement suggests that the exchange current density of 10% Ir/CeO2–C is 2.4 times that of 10% Ir/C, and the mass activity and specific activity of 10% Ir/CeO2–C for HOR are greater than those of 10% Ir/C by 2.8 fold and 1.8 fold, respectively. The effective prevention of the agglomeration of the highly dispersed Ir nanoparticles could be ascribed to the strong metal–support interaction between Ir and CeO2, and the promoted electrocatalytic activity would benefit from the oxophilic effect due to the higher oxygen storage-release capacity of ceria. Thus, 10% Ir/CeO2–C would be a good candidate for use at the anode of alkaline anion exchange membrane fuel cells.
1. Introduction
Fuel cells have shown significant promise as an alternative electricity generation technology in both automotive and stationary applications.1 However, the high cost due to the platinum (Pt) electrocatalyst hinders the process of their commercialization. Therefore, complete replacement of Pt with less expensive and more naturally abundant metals is crucial for making this technology an affordable solution for automotive as well as other large scale applications.2 Alkaline anion exchange membrane fuel cells (AAEMFCs) have faster kinetics in the oxygen reduction reaction (ORR) as compared to proton exchange membrane fuel cells (PEMFCs); this suggests that non-Pt catalysts can be used in the cathode to reduce the cost of the fuel cell. However, the hydrogen oxidation reaction (HOR) under alkaline conditions on platinum (Pt) is two orders of magnitude slower than that under acidic conditions.3 Consequently, AAEMFC anodes would require 10–100 fold increase in the amount of Pt catalyst to achieve the same current density as compared to the PEMFC counterpart. This lower intrinsic activity under alkaline conditions has barricaded the use of remarkably low concentrations of Pt catalyst in anodes; this increases the cost and cancels out the merit that cathode requires non-noble metal catalysts such as Fe/N/C4 and Co/N/C5. Fortunately, many non-platinum catalysts such as Pd, Ir, and Ru and alloys6–8 or non-noble metals such as RANEY® Ni9, Ni/N-CNT,10 and NiCoMo11 are stable under alkaline conditions, which enlarge the scope of HOR catalysts and provide the tactics to solve this issue. There is no doubt that platinum group metals react approximately two orders of magnitude slower under basic conditions than under acidic conditions,3 but the reason why this happens and a solution to make platinum group metals active are under debate.Moreover, some researchers have studied the Pt and Pt-M alloy catalysts to promote the intrinsic activity in a base based on lowering the hydrogen binding energy. Megan E. Scofield12 et al. synthesized a number of crystalline ultrathin PtM (M = Fe, Co, Ru, Cu, and Au) alloy nanowires (NWs) to replace a portion of the costly Pt metal. They found that the Pt7Ru3 NW system achieved an exchange current density of 0.493 mA cm−2, which was higher than the corresponding data for the Pt NWs alone, and ascribed this to the synergistic ligand and strain effects. Coincidentally, Zhuang13 et al. used PtRu/C as the HOR catalyst for the AAEMFC and made the peak power density of single cell increase to 1.0 W cm−2 as compared to 0.6 W cm−2 when Pt/C was used as the anode catalyst. They explained that the incorporation of Ru had an electronic effect on weakening the Pt–Had interaction rather than an oxophilic effect, which contributed to the removal of the Had intermediate through the reaction with OHad.
On the other hand, some studies have been conducted to develop non-platinum catalysts for the hydrogen oxidation reaction (HOR) in a base via promotion of the oxophilic effect. There are some reports of many great achievements in the non-platinum (Pt) metal, such as Ru, Pd, and Ir, and even non-noble metal catalysts, such as Ni or alloy. Junya Ohyama14 et al. prepared Ru/C with 3 nm diameter via liquid phase reduction of RuCl3 by NaBH4, which exhibited a better cell performance with a peak power density of over 250 mW cm−2. Alesker15 et al. synthesized a highly active Pd/Ni hydrogen oxidation reaction (HOR) electrocatalyst for membrane electrode assemblies (MEAs) of alkaline anion exchange membrane fuel cells (AAEMFCs), which showed a maximum peak power of 400 mW cm−2. They deduced that addition of an oxophilic metal, such as Ni, facilitates the removal of the Had intermediate. Surprisingly, Miller2 et al. employed a mixed carbon–CeO2-supported palladium (Pd) anode catalyst that exhibited enhanced kinetics for the HOR, and the entirely Pt-free AAEMFC produced a peak power density of over 500 mW cm−2. They concluded that CeO2 not only weakens the Pd–Had but also assists in supplying OHad from oxophilic CeO2 to the active site.
Unlike the extensive research effort on Pt and Pd, studies on the HOR under alkaline conditions over Ir and Ir-based alloys as anode catalysts in the alkaline anion exchange membrane fuel cell are limited, and only a few studies have been reported in the literature. Wei16 et al. used the solvent-vaporization plus hydrogen reduction method-prepared IrFe, IrNi, and IrCo alloy catalysts with the nanoparticle size of <5 nm. Based on the half-cell measurements, IrNi showed the best performance than others because of the oxophilic effect of the catalytic metal surfaces in an alkaline medium; this affects OHad adsorption and desorption properties and surface Had coverage.
In brief, the introduction of transition metals (Ru, Fe, Co, Ni, and Cu) into noble metals (Pt, Pd, and Ir) is a useful way to promote the intrinsic activity through synergistic ligands, strain effects, electronic effects or oxophilic effects; moreover, the introduction of transition metal oxide materials (CeO22) and transition metal carbides17 (VC, WC) as supports and co-catalysts enhances the intrinsic activity via a bifunctional effect and improves the dispersion through strong metal–support interaction (SIMI). Encouraging results were achieved, which inspired us to explore the Ir-based catalysts; thus, we used CeO2 as a co-catalyst and support for HOR in an alkaline medium.
CeO2, one of the transition metal oxide materials, exhibits a structure-sensitive formation of oxygen vacancy that helps ceria gain remarkable capabilities for the adsorption of oxygenated species; it assists the elementary reaction step of Volmer reaction for hydrogen oxidation in an alkaline medium; moreover,2 it has attracted significant attention because of its low-cost and outstanding chemical stability under alkaline conditions. However, the conductivity of CeO2 is relatively low, which has restricted its usage in the electrocatalytic field. As is well-known, carbon nanomaterials such as carbon black (Vulcan XC-72) and carbon nanotubes (CNTs) are efficient support material for nanometal catalysts because of their better conductivity and high surface area. In addition, Ir is less expensive than Pt, but the activity of Ir is inferior to that of Pt. Through adding CeO2 to enhance the activity of Ir via bifunctional effects18 and improving Ir nanoparticle dispersion through strong metal–support interaction19 (SIMI) may be a good idea for designing a better catalyst for HOR in a base.
Herein, we applied the ethylene glycol (EG) method to prepare 10% Ir/CeO2–C catalysts because the EG method has been commonly used by other researchers20 to synthesize iridium-based nanoparticle catalysts. Electrochemical testing suggested that 10% Ir/CeO2–C showed better activity than 10% Ir/C, which was used for comparison, and the HOR exchange current densities of 10% Ir/CeO2–C were more than twice those of 10% Ir/C in the half-cell testing.
2. Experimental
2.1 Catalyst preparation
The CeO2–C hybrid support was prepared as follows: 1.3275 g Ce(NO3)3·6H2O was dissolved in 65 mL of distilled water. Then, 1.0 g Vulcan XC-72 carbon was ultrasonically dispersed in the abovementioned solution for 0.5 h, and 2 M NaOH solution was added into the mixture until pH = 12 to form precipitates. Subsequently, the suspension was stirred for 2 h and filtered and dried overnight in a vacuum drier. Finally, the solid was transferred to a tubular oven at 250 °C for 3 h under air to obtain about 20 wt% CeO2–C support.After this, 10% Ir/CeO2–C nanoparticle catalyst was prepared via the ethylene glycol (EG) method. The details of the preparation procedure have been previously reported.21 Briefly, 90 mg CeO2–C and 5.31 mL H2IrCl6 solution (9.8 mM) were added to 30 mL ethylene glycol to form a slurry via stirring and ultrasonication for 30 minutes. Then, 2 M NaOH solution was slowly added to the slurry to achieve pH 12. The resulting slurry was stirred and refluxed under 120 °C for 3 h. Finally, the pH of the slurry was adjusted to three by the HCl solution before the slurry was cooled down to room temperature. After stirring, 10% Ir/CeO2–C was precipitated and centrifuged. Subsequently, the electrocatalyst was washed several times with deionized water and alcohol to remove residual Cl− and dried using the vacuum-drying process. In addition, 10% Ir/C catalyst with the same Ir content was also prepared through the same process for comparison.
2.2 Electrode preparation
Glassy carbon disk electrode of 4 mm diameter, polished to a mirror-finish before each experiment (0.05 mm alumina), was used as the substrate. For the electrode preparation, 5 mg catalyst was dispersed in a mixture of 2.5 mL of 2-propanol and 20 μL of Nafion solution (5 wt%, Aldrich) under ultrasonic stirring to form a homogeneous catalyst ink; then, 10 μL of an ultrasonically dispersed catalyst suspension was transferred onto the substrate using a microsyringe and dried in air at room temperature to form a thin film of the catalyst. Working electrodes were coated with 10 μL of ink, resulting in 10% Ir/CeO2–C or 10% Ir/C nanoparticle loadings of 11.6 μgIr cmdisk−2 or 13.5 μgIr cmdisk−2, respectively, necessary to reach proper diffusion limited currents in the HOR experiments.22,232.3 Physical characterization
Scanning electron microscopy (SEM) images were obtained at 20 kV via a JSM-IT300 microscope. Catalyst compositions were determined by energy dispersive X-ray spectroscopy (EDS) experiments during SEM. Inductively coupled plasma-atomic emission spectroscopy (ICP-AES) and inductively coupled plasma-atomic mass spectroscopy (ICP-MS) were conducted using a Perkin-Elmer Optima 7300 DV. Transmission electron microscopy (TEM) images were obtained at 120 kV using a JEM-2000EX electron microscope. X-ray diffraction (XRD) patterns were obtained via a powder X-ray diffractometer (PANalytical X'Pert PRO) using Cu Kα radiation. The tube current was 40 mA and the tube voltage was 40 kV. The 2θ angular regions between 10 and 80° were explored at a scan rate of 5° min−1. X-ray photoelectron spectra (XPS) were obtained via an ESCALAB MK II X-ray photoelectron spectrometer with Mg Kα as the excitation source. The binding energies achieved in the XPS spectral analysis were corrected for specimen charging by referencing C 1s to 284.8 eV.2.4 Electrochemical characterization
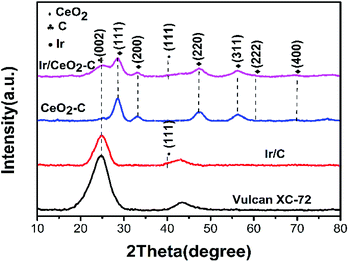
Electrochemical measurements were conducted in a RDE half-cell containing a 0.1 M potassium hydroxide (KOH) electrolyte. The RDE half-cell utilized a glassy carbon working electrode, Pt wire counter electrode, and mercury–mercury oxide reference electrode (0.1 M KOH TianJin AIDA Co., Ltd.). The rotation of the working electrode was controlled by a modulated speed controller (Pine Instruments), and data were obtained using an electrochemical workstation (Gamry Interface 1000E). All potential values in this study were referenced to a reversible Fig. 1 XRD pattern of the prepared Vulcan XC-72, 10% Ir/C, 20% CeO2–C, and 10% Ir/CeO2–C hydrogen electrode (RHE). The current was normalized to the geometric surface area of the glassy carbon electrode (0.1256 cm2).Repeated cyclic voltammograms were completed at 50 mV s−1 in an argon saturated 0.1 M KOH electrolyte in the scan range of 0–0.9 V vs. reversible hydrogen electrode (RHE). The electrochemical surface areas (ECSA) of the 10% Ir/CeO2–C and 10% Ir/C samples were determined by H desorption in the cyclic voltammograms (CVs) based on a charge density of 218 μC cm−2Ir, using the following equation:22
 | (1) |
HOR activity was measured under rotation at 1600 rpm at 10 mV s−1 in a hydrogen saturated 0.1 M KOH electrolyte in the scan range of −0.05–0.5 V vs. reversible hydrogen electrode (RHE). RDE studies are used to separate the current into its kinetic and diffusion-based constituents, as shown by the Koutecky–Levich equation:
 | (2) |
The stability of the catalysts was tested via cyclic voltammetry. The potential was swept at 100 mV s−1 between 0 and 0.9 V vs. reversible hydrogen electrode (RHE) for 2000 cycles in an argon saturated 0.1 M KOH without rotation. The morphology of the 10% Ir/CeO2–C and 10% Ir/C after 2000 potential cycles was characterized via transmission electron microscopy (TEM) to monitor the differences in the morphology and sizes of the nanoparticles; moreover, through inductively coupled plasma-atomic mass spectroscopy (ICP-MS), we measured the amount of elemental Ir in 0.1 M KOH that detached from the catalyst support.
3. Results and discussion
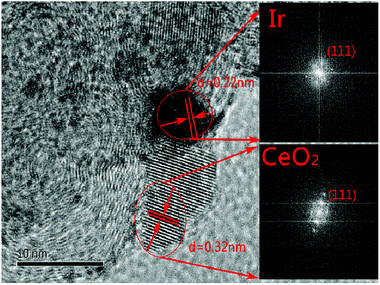
The characterization of X-ray power diffraction is shown in Fig. 1. The diffraction peaks at approximately 24.8° observed in the XRD patterns are attributed to the graphitic (002) planes of Vulcan XC-72 (JCPDS 01-074-2329). The XRD pattern for the sample peak corresponds to the (111), (200), (220), (311), (222), and (400) planes located at 2θ = 28.5°, 32.1°, 47.5°, 56.6°, 59.2°, and 69.5°, respectively, which could be assigned to the planes of the fluorite-structured cubic ceria (JCPDS 03-065-5923). All the catalysts containing iridium displayed a small peak at 2θ = 40.0° (JCPDS 01-088-2342), which corresponded to the cubic iridium (111), indicating that the content of the iridium catalysts and size are much smaller than those of the support.As shown in Fig. 2(a–f), the morphology and particle size distribution of the as-prepared 20% CeO2–C, 10% Ir/CeO2–C, and 10% Ir/C catalysts were characterized by TEM. The average particle sizes, calculated from the randomly selected 100 nanoparticles, are 4.9 nm, 1.1 nm, and 1.5 nm for 20% CeO2–C, 10% Ir/CeO2–C, and 10% Ir/C, respectively. The average particle size of 10% Ir/CeO2–C is slightly smaller than that of 10% Ir/C. In the HRTEM image, it can be observed that some Ir nanoparticles are located nearby CeO2, and others are attached to the XC-72 in the 10% Ir/CeO2–C, as shown in Fig. 3. The lattice fringes of the ceria (111) planes with a spacing value of 0.32 nm were also observed. Moreover, nearby ceria, the lattice fringes of Ir (111), additional lattice fringes with a spacing value of 0.22 nm, were observed.
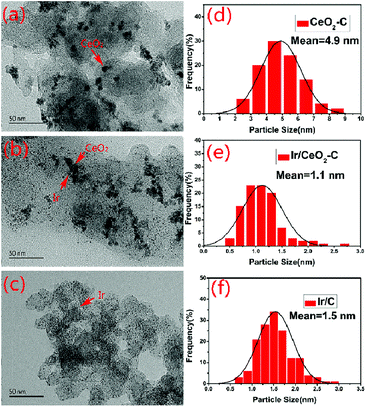 | ||
| Fig. 2 TEM images and corresponding particle size distribution histograms of 20% CeO2–C (a and d), 10% Ir/CeO2–C (b and e), and 10% Ir/C (c and f) catalysts. | ||
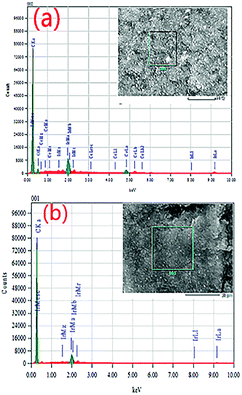
The compositions of the 10% Ir/CeO2–C and 10% Ir/C catalysts were further characterized by EDS, and the spectra are shown in Fig. 4.
The relative weight percentages of Ir, Ce, C, and O in the 10% Ir/CeO2–C catalyst are 8.08%, 13.06%, 73.16%, and 5.71%, respectively, and the relative weight percentages of Ir and C in the 10% Ir/C catalyst are 8.41% and 91.86%, which were further measured by ICP-AES, as shown in Table 1, indicating that the results are reliable.
| Method | Catalyst | Ir (wt%) | Ce (wt%) | C (wt%) | O (wt%) |
|---|---|---|---|---|---|
| EDS | Ir/C | 8.41 | — | 91.86 | — |
| Ir/CeO2–C | 8.08 | 13.06 | 73.16 | 5.71 | |
| ICP-AES | Ir/C | 8.48 | — | — | — |
| Ir/CeO2–C | 7.27 | 12.71 | — | — |
XPS was employed to investigate the nature of the surface species for the 10% Ir/CeO2–C and 10% Ir/C catalysts; the full XPS spectra of 10% Ir/CeO2–C and 10% Ir/C are shown in Fig. 5(a), and the Ir 4f spectra of 10% Ir/C and 10% Ir/CeO2–C catalysts are shown in Fig. 5(b) and (c), respectively. Since the Ir metal is easily oxidized to the form of Ir oxide (IV) under ambient conditions, the XPS spectra of Ir 4f can be fitted by two pairs of curves according to the presence of the oxidized forms of Ir(IV) and metallic Ir. For the 10% Ir/C catalyst, the peaks at 62.1 and 65.1 eV are ascribed to the metallic Ir, and the peaks at 63.0 and 67.1 eV are ascribed to the oxidized forms of Ir(IV). Similarly, for the 10% Ir/CeO2–C catalyst, the peaks at 61.9 and 65.0 eV are ascribed to the metallic Ir, and the peaks at 63.4 and 66.3 eV are ascribed to the oxidized forms of Ir(IV). It is evident that the peak position of the metallic Ir 4f of the Ir/CeO2–C catalyst is slightly shifted to the negative direction as compared to that of the Ir/C catalyst, indicating that there is a strong interaction between the Ir nanoparticles and the CeO2 support; this is also confirmed by the Ce 3d spectra where the peaks at 917.6 eV, 907.8 eV, 901.8 eV, 899.0 eV, 888.7 eV, and 882.8 eV of Ir/CeO2–C are shifted to the positive direction as compared to those of CeO2.18
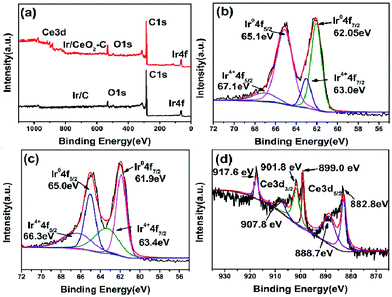 | ||
| Fig. 5 XPS analysis of (a) 10% Ir/CeO2–C and 10% Ir/C full XPS spectrum; (b) Ir 4f spectrum of 10% Ir/C, (c) Ir 4f spectrum of 10% Ir/CeO2–C, and (d) Ce 3d spectrum of 10% Ir/CeO2–C. | ||
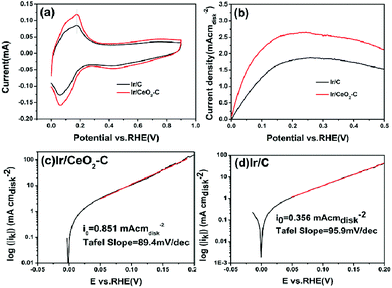
Cyclic voltammetry was employed to investigate the electrochemical surface areas for the 10% Ir/CeO2–C and 10% Ir/C catalysts, and the results are shown in Fig. 6(a). The electrochemical surface areas (ECSA) of the 10% Ir/CeO2–C and 10% Ir/C samples were determined by H desorption from the cyclic voltammograms based on a charge density of 218 μC cm−2Ir using the eqn (1) and were found to be 80.1 m2 g−1 and 52.0 m2 g−1, respectively. The enhanced ECSA of 10% Ir/CeO2–C could be attributed to the CeO2 nanoparticles. Particularly, the CeO2 particles are covered with negative charges when the pH value is larger than 12 in the process of catalyst preparation, which makes CeO2 easily deposit onto the Vulcan XC-72 support with positive charges through electrostatic attraction. With more oxygen species provided by CeO2, the surface of carbon black could be functionalized with hydroxyl and carbonyl groups, which acted as the anchoring sites for the Ir nanoparticles and prevented agglomeration;24 therefore, 10% Ir/CeO2–C had a higher ECSA value than 10% Ir/C catalyst. This is supported by the fact that the average particle size of 10% Ir/CeO2–C is slightly smaller than that of 10% Ir/C. Note that the peak potential of the HUPD desorption is used as a descriptor for HOR in evaluating the hydrogen binding energy (HBE).25 As Fig. 6(a) shows, the peak potential of the HUPD desorption from 10% Ir/CeO2–C has no explicitly negative shift as compared to that of 10% Ir/C, indicating that the strong metal–support interaction (SMSI) between Ir and CeO2 cannot obviously lower the hydrogen binding energy of 10% Ir/CeO2–C. Thus, the enhanced activity of 10% Ir/CeO2–C could not be ascribed to the electronic effect of hydrogen binding energy lowering; thus, it may benefit from the oxophilic effect of CeO. A similar conclusion was confirmed by the in situ ATR-FTIR spectroscopy previously reported by Koichi Eguchi et al.26 However, the oxophilic effect of CeO2 supports that the activity Ir/CeO2–C is limited under basic conditions.
Rotating disk electrochemistry was employed to investigate the electrocatalytic activity of the 10% Ir/CeO2–C and 10% Ir/C catalysts, as shown in Fig. 6(b). At low polarizations, the reaction is under kinetic control because the diffusion rate is sufficient to supply enough reactant for the reaction. As the overpotential is increased, the reaction becomes faster and needs more reactant to generate the kinetically desired current. Eventually, the limited diffusion rate is not high enough to supply enough reactant and the reaction becomes diffusion-controlled; thus, the current reaches up to the maximum point where the reaction becomes completely diffusion-controlled. The diffusion limiting current was higher for 10% Ir/CeO2–C than for 10% Ir/C, and this was determined by the factors such as catalyst layer thickness and structure, as well as loading or surface area or particle shape and size. Therefore, the catalyst activity is the kinetic component of the current and indicated in the gradient of the curve at the potentials before the diffusion limited value is reached. Fig. 6(b) shows a slightly steeper gradient for the 10% Ir/CeO2–C catalyst than that for the 10% Ir/C catalyst.
Furthermore, Tafel analysis was carried out for the quantitative evaluation of the RDE data by eqn (2) to calculate kinetic current density, as shown in Fig. 6(c) and (d). The exchange current density (i0) of HOR was obtained via linear fitting of the kinetic current density into the Tafel equation as follows:1
 ,
,  , α is the charge transfer coefficient and
  . Thus,
Via fitting the linear region of a plot of log![[thin space (1/6-em)]](https://www.rsc.org/images/entities/char_2009.gif) ik vs. η, a gradient and an intercept could be obtained, and then, the exchange current density i0 and the Tafel slope b could be calculated as shown in Table 2.
ik vs. η, a gradient and an intercept could be obtained, and then, the exchange current density i0 and the Tafel slope b could be calculated as shown in Table 2.
| Catalyst | Intercept (log![[thin space (1/6-em)]](https://www.rsc.org/images/entities/char_2009.gif) i0) i0) |
Slope (1/b) | i0 (mA cmdisk−2) | Tafel Slope b (mV dec−1) |
|---|---|---|---|---|
| Ir/C | −0.4480 | 10.426 | 0.356 | 95.9 |
| Ir/CeO2–C | −0.0702 | 11.185 | 0.851 | 89.4 |
The exchange current densities of 0.851 mA cmdisk−2 and 0.356 mA cmdisk−2 for the 10% Ir/CeO2–C catalyst and 10% Ir/C catalyst, respectively, were obtained. The 10% Ir/CeO2–C catalyst exhibits an increase of over 200% in the exchange current density as compared to the 10% Ir/C catalyst. When normalized to the mass, the exchange current densities are 73.5 Ag−1Ir for 10% Ir/CeO2–C and 26.4 Ag−1Ir for 10% Ir/C. When normalized to the ECSA, the exchange current densities are 0.092 mA cm−2Ir for 10% Ir/CeO2–C and 0.051 mA cm−2Ir for 10% Ir/C. The mass activity of 10% Ir/CeO2–C is 2.8 fold that of 10% Ir/C, and the specific activity of 10% Ir/CeO2–C is about 1.8 fold that of 10% Ir/C; this suggests that 10% Ir/CeO2–C is more active for the HOR under alkaline conditions than 10% Ir/C and a promising candidate for anode catalysts of alkaline anion exchange membrane fuel cells. Moreover, we compared the as-prepared Ir/CeO2–C with the state-of-the-art catalysts, as shown16,22,27 in Table 3.
| Catalyst | MA (A gIr−1) | SA (mA cmIr−2) | Temperature | Electrolysis | Ref. |
|---|---|---|---|---|---|
| IrFe/C | 57.4 | — | Room temperature | 0.1 M NaOH | 16 |
| IrNi/C | 71.4 | — | Room temperature | 0.1 M NaOH | 16 |
| IrCo/C | 51.1 | — | Room temperature | 0.1 M NaOH | 16 |
| Ir/C | 128.6 ± 18.8 | 0.21 ± 0.02 | 20 °C | 0.1 M KOH | 22 |
| Ir/C–300C | 110.3 ± 13.1 | 0.22 ± 0.07 | 20 °C | 0.1 M KOH | 22 |
| Ir/C–500C | 118.4 ± 20.0 | 0.30 ± 0.06 | 20 °C | 0.1 M KOH | 22 |
| Ir/C–600C | 97.8 ± 7.6 | 0.31 ± 0.05 | 20 °C | 0.1 M KOH | 22 |
| Ir/C–800C | 73.0 ± 9.0 | 0.53 ± 0.01 | 20 °C | 0.1 M KOH | 22 |
| Ir/C | — | 0.20 | 20 °C | 0.1 M KOH | 27 |
| Ir/CeO2–C | 73.5 | 0.092 | Room temperature | 0.1 M KOH | This work |
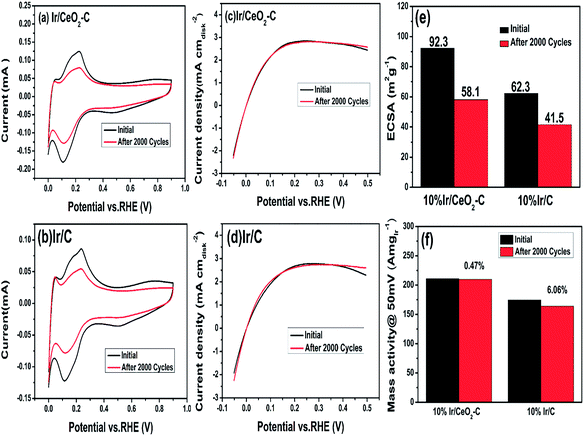
Moreover, the stability of the catalysts was measured by repeated cyclic voltammetry, as shown in Fig. 7. We compared the ECSA and performance of 10% Ir/CeO2–C before and after 2000 potential cycles to study the stability of 10% Ir/CeO2–C. The results are shown in Fig. 7(e) and (f). These suggests that the ECSA of 10% Ir/CeO2–C is reduced by about 37.1% and the ECSA of 10% Ir/C is reduced by about 33.4%; however, the mass activity at 50 mV of 10% Ir/CeO2–C is only reduced by 0.47%, whereas that of 10% Ir/C is reduced by 6.06%. Thus, there is no doubt that 10% Ir/CeO2–C shows better stability than 10% Ir/C, which may be ascribed to the strong metal–support interaction between Ir and CeO2 that has been proven by the XPS results.
To gain a better understanding of the prevention of the agglomeration of the Ir nanoparticles by the metal–support interaction between Ir and CeO2, the morphology and size distribution histograms of 10% Ir/CeO2–C and 10% Ir/C before and after 2000 potential cycles were obtained, as shown in Fig. 8. The agglomeration of the Ir nanoparticles of both 10% Ir/CeO2–C and 10% Ir/C are obvious after 2000 potential cycles, but the average particle size of 10% Ir/CeO2–C is 3.4 nm, which is smaller than that (4.4 nm) of 10% Ir/C. This is consistent with the decrease of the ECSA after 2000 potential cycles and indicates that the rate of agglomeration for the Ir nanoparticles in Ir/CeO2–C is slower than that in 10% Ir/C. This may be due to the metal–support interaction between Ir and CeO2 which restrains Ir nanoparticle migration and agglomeration in Ir/CeO2–C.
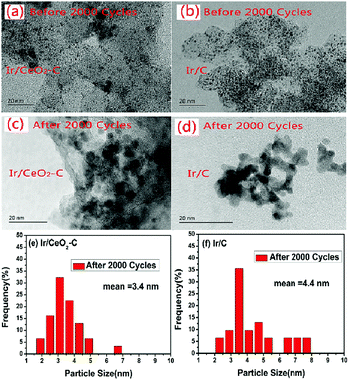 | ||
| Fig. 8 TEM images and particle size distribution histograms of 10% Ir/CeO2–C (a, c, and e) and 10% Ir/C (b, d, and f) catalysts before and after 2000 potential cycles. | ||
Moreover, the amount of the metal Ir that detached from the catalyst support to 0.1 M KOH after the durability test was measured by ICP-MS. The result of ICP-MS suggests that the average concentration of Ir that detached from 10% Ir/C in 0.1 M KOH was 0.095 ppb, which was 1.7 fold that (0.055 ppb) of 10% Ir/CeO2–C. This proves that there is a strong metal–support interaction between Ir and CeO2 that inhibits Ir nanoparticle detachment from the CeO2–C hybrid support during the potential cycles.
Unlike Pt and Pd, the peak potential of the HUPD desorption from Ir/CeO2–C had no explicitly negative shift, indicating that ceria could not weaken the Ir–Had. Thus, the promoted electrocatalytic activity would benefit from the oxophilic effect due to the higher oxygen storage-release capacity of ceria.
In detail, the mechanism of HOR follows the Tafel–Volmer or Heyrovsky–Volmer mechanism, as follows:11
| H2 + 2* = 2Had Tafel |
| H2 + OH− + * = Had + H2O + e− Heyrovsky |
| Had + OH− = H2O + e− + * Volmer |
Abel C. Chialvo28 et al. evaluated the kinetic parameters of the hydrogen oxidation reaction on nanostructured iridium electrodes in an alkaline solution. They claimed that Tafel–Volmer is the prevailing route and the slower kinetics of HOR in the alkaline solution can be ascribed to the fact that it is more difficult for OH− than for H+ to achieve the appropriate spatial configuration to enable the electron transfer in the constrains of the surface water network according to Grotthuss type mechanism; this increased the activation energies of the Heyrovsky and Volmer steps and resulted in a decrease in the corresponding equilibrium reaction rates. In light of this, ceria (CeO2) exhibits a structure-sensitive formation of oxygen vacancy on its surface. The O-vacancy helps ceria gain remarkable capabilities for the adsorption of oxygenated species such as OH− or OHad, which assists the elementary reaction step of Volmer reaction for H2 oxidation in an alkaline medium.2,29
In addition, the lower value of the electrocatalytic activity of the HOR in the alkaline solution with respect to that in the acidic solution has been interpreted in terms of the electroadsorption of hydroxyl ions as follows.30,31
| OH− + * = OHad + e− |
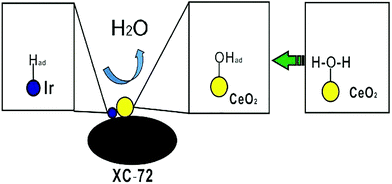
Ceria (CeO2) could act as a co-catalyst for the electroadsorption of hydroxyl ions and help the metal Ir catalyst release more active sites for hydrogen adsorption, as shown in Fig. 9.
4. Conclusions
We report a facile method to prepare the 10% Ir/CeO2–C nanoparticle. Ultrafine Ir particles are closely adhered to the interfaces of the CeO2–C support. 10% Ir/CeO2–C shows enhanced catalytic HOR activity in alkaline media as compared to the 10% Ir/C catalyst. The superior catalytic performance of the 10% Ir/CeO2–C catalyst is attributed to the presence of abundant Ir, CeO2, and C heterointerfaces,32 as shown in Fig. 9, which greatly facilitates the synergistic effects, electronic effect, and oxophilic effect33 between Ir and CeO2. Particularly, the Vulcan XC-72 carbon black provides a highway for electron transport and high surface area to disperse the Ir and CeO2 nanoparticles. The ceria nanoparticles not only supply a number of active sites for anchoring and stabilizing the Ir nanoparticles, but also promote hydrogen oxidation in a base through bifunctional effects, wherein the oxygen vacancy adsorbs hydroxyl species as well as enhances the electrochemical surface areas (ECSA) via the strong metal–support interaction (SMSI) between Ir and CeO2. This study provides a facile strategy for designing advanced ternary heterointerface electrocatalysts; these electrocatalysts showed enhanced HOR catalytic performance in a base. Moreover, 10% Ir/CeO2–C would be a good candidate for use at the anode of alkaline anion exchange membrane fuel cells.Acknowledgements
The work was supported by the National Natural Science Foundations of China (No. U1664259) and CAS-DOE Cooperation Project (Program No. 121421KYSB20160009).Notes and references
- R. Jervis, N. Mansor, C. Gibbs, C. A. Murray, C. C. Tang, P. R. Shearing and D. J. L. Brett, J. Electrochem. Soc., 2014, 161, F458–F463 CrossRef CAS
.
- H. A. Miller, A. Lavacchi, F. Vizza, M. Marelli, F. Di Benedetto, F. D. I. Acapito, Y. Paska, M. Page and D. R. Dekel, Angew. Chem., Int. Ed., 2016, 55, 6004–6007 CrossRef CAS PubMed
.
- J. Durst, A. Siebel, C. Simon, F. Hasché, J. Herranz and H. A. Gasteiger, Energy Environ. Sci., 2014, 7, 2255 CAS
.
- C. Dominguez, F. J. Perez-Alonso, J. L. G. de la Fuente, S. A. Al-Thabaiti, S. N. Basahel, A. O. Alyoubi, A. A. Alshehri, M. A. Pena and S. Rojas, J. Power Sources, 2014, 271, 87–96 CrossRef CAS
.
- I. Kruusenberg, D. Ramani, S. Ratso, U. Joost, R. Saar, P. Rauwel, A. M. Kannan and K. Tammeveski, Chemelectrochem, 2016, 3, 1455–1465 CrossRef CAS
.
- S. St John, R. W. Atkinson, R. R. Unocic, T. A. Zawodzinski and A. B. Papandrew, J. Phys. Chem. C, 2015, 119, 13481–13487 CAS
.
- S. Henning, J. Herranz and H. A. Gasteiger, J. Electrochem. Soc., 2015, 162, F178–F189 CrossRef CAS
.
- S. M. Alia and Y. Yan, J. Electrochem. Soc., 2015, 162, F849–F853 CrossRef CAS
.
- J. Shim and H. K. Lee, Mater. Chem. Phys., 2001, 69, 72–76 CrossRef CAS
.
- Z. B. Zhuang, S. A. Giles, J. Zheng, G. R. Jenness, S. Caratzoulas, D. G. Vlachos and Y. S. Yan, Nat. Commun., 2016, 7, 8 Search PubMed
.
- W. Sheng, A. P. Bivens, M. Myint, Z. Zhuang, R. V. Forest, Q. Fang, J. G. Chen and Y. Yan, Energy Environ. Sci., 2014, 7, 1719–1724 CAS
.
- M. E. Scofield, Y. Zhou, S. Yue, L. Wang, D. Su, X. Tong, M. B. Vukmirovic, R. R. Adzic and S. S. Wong, ACS Catal., 2016, 6, 3895–3908 CrossRef CAS
.
- Y. Wang, G. Wang, G. Li, B. Huang, J. Pan, Q. Liu, J. Han, L. Xiao, J. Lu and L. Zhuang, Energy Environ. Sci., 2015, 8, 177–181 CAS
.
- J. Ohyama, T. Sato and A. Satsuma, J. Power Sources, 2013, 225, 311–315 CrossRef CAS
.
- M. Alesker, M. Page, M. Shviro, Y. Paska, G. Gershinsky, D. R. Dekel and D. Zitoun, J. Power Sources, 2016, 304, 332–339 CrossRef CAS
.
- J. H. Liao, W. Ding, S. C. Tao, Y. Nie, W. Li, G. P. Wu, S. G. Chen, L. Li and Z. D. Wei, Chin. J. Catal., 2016, 37, 1142–1148 CrossRef CAS
.
- L. Wang, E. G. Mahoney, S. Zhao, B. Yang and J. G. Chen, Chem. Commun., 2016, 52, 3697–3700 RSC
.
- L. Zhang and Y. Shen, Chemelectrochem, 2015, 2, 887–895 CrossRef CAS
.
- L. Feng, J. Yang, Y. Hu, J. Zhu, C. Liu and W. Xing, Int. J. Hydrogen Energy, 2012, 37, 4812–4818 CrossRef CAS
.
- B. Li, D. C. Higgins, D. Yang, H. Lv, Z. Yu and J. Ma, Int. J. Hydrogen Energy, 2013, 38, 5813–5822 CrossRef CAS
.
- D. Yang, B. Li, H. Zhang and J. Ma, Fuel Cells, 2013, 13, 309–313 CrossRef CAS
.
- J. Zheng, Z. Zhuang, B. Xu and Y. Yan, ACS Catal., 2015, 5, 4449–4455 CrossRef CAS
.
- S. M. Alia, B. S. Pivovar and Y. S. Yan, J. Am. Chem. Soc., 2013, 135, 13473–13478 CrossRef CAS PubMed
.
- S. Song, K. Wang, L. Yan, A. Brouzgou, Y. Zhang, Y. Wang and P. Tsiakaras, Appl. Catal., B, 2015, 176, 233–239 CrossRef
.
- W. Sheng, Z. Zhuang, M. Gao, J. Zheng, J. G. Chen and Y. Yan, Nat. Commun., 2015, 6, 1–6 Search PubMed
.
- Y. Katayama, T. Okanishi, H. Muroyama, T. Matsui and K. Eguchi, ACS Catal., 2016, 6, 2026–2034 CrossRef CAS
.
- J. Zheng, W. Sheng, Z. Zhuang, B. Xu and Y. Yan, Sci. Adv., 2016, 2, 1501602 Search PubMed
.
- M. A. Montero, M. R. G. de Chialvo and A. C. Chialvo, J. Electroanal. Chem., 2016, 767, 153–159 CrossRef CAS
.
- Z. K. Ghouri, N. A. M. Barakat, M. Obaid, J. H. Lee and H. Y. Kim, Ceram. Int., 2015, 41, 2271–2278 CrossRef CAS
.
- T. J. Schmidt, P. N. Ross and N. M. Markovic, J. Electroanal. Chem., 2002, 524, 252–260 CrossRef
.
- M. A. Montero, M. R. Gennero de Chialvo and A. C. Chialvo, J. Power Sources, 2015, 283, 181–186 CrossRef CAS
.
- M. Takahashi, T. Mori, F. Ye, A. Vinu, H. Kobayashi and J. Drennan, J. Am. Ceram. Soc., 2007, 90, 1291–1294 CrossRef CAS
.
- D. Strmcnik, M. Uchimura, C. Wang, R. Subbaraman, N. Danilovic, D. van der Vliet, A. P. Paulikas, V. R. Stamenkovic and N. M. Markovic, Nat. Chem., 2013, 5, 300–306 CrossRef CAS PubMed
.
| This journal is © The Royal Society of Chemistry 2017 |

