
 Open Access Article
 This Open Access Article is licensed under a Creative Commons Attribution-Non Commercial 3.0 Unported Licence
Sex-related chemical differences in keratin from fingernail plates: a solid-state carbon-13 NMR study†
Paulina Brzózka * and
Waclaw Kolodziejski
* and
Waclaw Kolodziejski
Department of Inorganic and Analytical Chemistry, Faculty of Pharmacy with the Laboratory Medicine Division, Medical University of Warsaw, Warsaw, Poland. E-mail: pnykiel@wum.edu.pl
First published on 1st June 2017
Abstract
Alpha-keratin of nails is formed of fibrillar keratins and globular keratin associated proteins. The diagnosis of systemic diseases and forensic argumentation from fingernails primarily requires a comprehensive examination of the α-keratin composition and structure, including their gender dependence in healthy subjects. Nail clippings were collected from 78 healthy volunteers (46 females and 32 males; mean age of 22.3 ± 3.5 years). The snippets were cleaned, pulverized, lyophilized and studied using solid-state 13C CP/MAS NMR. The NMR spectra were deconvoluted into separate signals, the areas of which were then subjected to statistical analyses: cluster analysis, principal component analysis and tests for unpaired groups. With regard to the amino acid composition of the nail proteins, males have more Leu and Ala, and less Cys, Arg and Ile, than females. Furthermore, the α-keratin of males has more disulphide bonds, and more β-sheet and random coil secondary structures, but fewer α-helical regions. The higher content of disulphide bonds is possible in the α-keratin of males despite the slightly lower Cys content and it renders their fingernail plates stiffer than those of females.
Introduction
Human fingernails are skin appendages.1,2 Nail plates are specialized structures that cover distal surfaces of fingers and comprise three histological layers composed of α-keratin – an insoluble biomaterial containing microfibrils of keratin proteins (7–10 nm in diameter) immersed in a matrix of globular, keratin associated proteins (KAPs).1–4 The α-keratins can be “hard” and “soft”. In the hard keratins, microfibrils are relatively ordered in the surrounding matrix and thus endow tissue with toughness. In contrast, the soft keratins contain rather loosely packed bundles of cytoplasmic microfibrils and give mechanical resilience to epithelial cells. Nail plates contain 80–90% hard keratins and the remaining part is soft.5 The α-keratins are also primary constituents of hair and the stratum corneum of skin.3The structure of α-keratin microfibrils is complex.3,6 The keratin proteins are assembled as coiled coils: two right-handed helical polypeptide chains (monomers) are twisted into a left-handed coil (dimer) strengthened by disulphide cross-links between cysteine residues. Such dimers aggregate further via protofilaments and protofibrils to form intermediate filaments (IFs).3,6 The IFs are responsible for the characteristic X-ray diffraction pattern of α-keratins.3 They contain low-sulphur keratin proteins, while KAPs surrounding them are high-sulphur and high-glycine-tyrosine proteins.3 The aforementioned disulphide bonds are of crucial importance in maintaining the structure and ameliorating mechanical properties of α-keratins.
Another aspect to consider is that α-keratin proteins also have non-α-helical N- and C-terminal domains, which are sometimes quite extended.6 Moreover, there are microfibril regions with the β-sheet secondary structure and the α-helix → β-sheet transitions take place under various physical and chemical conditions. Such transitions are considerably dependent on the tissue hydration level.7,8 Besides, the β-sheet structural domains can occur in KAPs of the α-keratin matrix. The coexisting α-helix and β-sheet structures can be easily discerned and quantified using carbon-13 solid-state NMR spectroscopy.8
Chemically, human fingernails are composed of amino acids (keratin), lipids (0.1–1.0 wt%; mostly cholesterol), minerals (most abundant elements: Cl, Ca, K, Na, Si, Mg, Zn, Fe, Al, Br, Cu) and water (7–12 wt%).1,9 Environmental exposure can influence trace element levels in nails9–11 and significantly affect their water content.12 There is also a gender effect: male fingernails contain less Au, Bi and Si and more Na, Mg and K than those of females.13 However, there is no information about any external influence on the amino acid composition, except after decade-long occupational exposure.14 This composition is decided during keratin synthesis in the nail matrix and remains stable with the nail plates' growth.15
Another important feature of fingernail plates is their continuous growth, with an average rate of 3.5 mm per month,16 so natural regeneration of a fingernail after avulsion is achieved in 4–6 months. It is interesting that both fingernails and toenails of men grow faster than those of women.16 During the nail's growth, various chemicals (biomarkers, toxins, illicit substances) can pass from the adjacent blood vessels into the keratinous tissue, where they are retained for up to 6 months. Therefore, similarly to hair, nail plates have been recommended as a diagnostic material in medicine, toxicology and criminology. They are easy to collect in a non-invasive manner, are stable and do not require special storage conditions.
So far, fingernail research has mostly focused on the quantitative analysis of organic elements (C, S, N)17 and inorganic trace elements.9–11,13 Most interestingly, Dittmar et al.17 have found that fingernails of females contain more sulphur than those of males and therefore females have a lower N/S ratio. However, the higher sulphur content does not necessarily mean a higher concentration of keratin disulphide bonds. Only rare reports have been devoted to the keratin structure in nails. It has been investigated in the context of some diseases18–25 and after chemical or physical modification.26–29 In our opinion, the diagnosis of systemic diseases, based on the fingernail protein composition and structure, firstly requires a comprehensive examination of the keratin structure in healthy subjects.
A most promising method of structural analysis of complex, solid, native biological materials is solid-state NMR spectroscopy (ssNMR).8,30–33 Classical high-resolution 13C ssNMR requires fast magic-angle spinning (MAS) with high-power decoupling to narrow the 13C peaks and cross-polarization (CP) to increase their intensity.34,35 This method has already provided a lot of information on keratin at all its structural levels and on keratin molecular mobility. In particular, previous 13C CP/MAS NMR papers have been devoted to the interpretation of the carbon-13 spectra, characterization of native and modified keratins, elucidation of the α-keratin structure, testing its dependence on stretching, heating and chemical treatment, analysis of the α-helix and β-sheet regions and observation of their mutual transitions, monitoring disulphide bonds breaking under various conditions, thermal and reductive/oxidative denaturation, assessment of crystalline and amorphous regions, characterization of molecular dynamics and so on.8,26–28,33,36–43 The studies were made on human and horse hair, human stratum corneum, horse hoof and sheep wool.
As yet, there has only been one ssNMR study of fingernails.26 The impact of high pressure on the morphology and molecular dynamics of nail α-keratin was studied using 1H wide-line and 13C CP/MAS NMR. Proton spin-diffusion and longitudinal carbon-13 relaxation in the rotating frame were employed. Under uniaxial compression, the rigid domains increased and α-helices transformed partially to β-sheets, inducing a dynamic heterogeneity of amino acid residues. However, that study was performed on a single sample of clippings collected from several subjects (healthy young adult humans).
Therefore, more ssNMR information on the fingernails of healthy humans is required if such material is to be used for medical diagnostics. Possibly, the patient's gender should also be considered in this case. Sex-related differences in the keratinized tissues were found mainly in the elemental composition13,17 and growth rate16 of fingernails, and then in the mean pH values and chemical composition of epidermal stratum corneum,44 and in the secondary structure and amino-acid composition of hair fibres.45 Hence, we decided to look for the structural differences in the fingernail keratin between women and men. The people enrolled in the study were young and healthy. Their fingernail clippings were studied using the previously recommended 13C CP/MAS NMR spectroscopy.
Materials and methods
Ethics statement
All the procedures performed involving human participants were in accordance with the ethical standards of the Medical University of Warsaw, and with the 1964 Helsinki Declaration and its later amendments. The research has been approved by the Bioethics Committee of the Medical University of Warsaw (permission No. KB/92/2013). Informed consent was obtained from all the participants before the study began. No personal patient data were analysed or included in this work.Samples/material
The group of 78 young volunteers (46 females and 32 males) for this study was recruited from among university students and workers. The mean age of all the participants (±the standard deviation) was 22.3 ± 3.5 years, with the youngest and oldest subjects being 19 and 30 years old, respectively. The exclusion criteria were chronic diseases and nail, bone or urinary system disorders. The volunteers also declared that they did not use intensive cosmetic treatment of fingernail plates.Fingernail clippings, each approximately 3 mm wide, were harvested from ten fingers of each subject and stored in Eppendorf tubes in a desiccator (over silica gel). In the first processing step, any visible dirt on the surface of nails was removed manually with a blade. Then, the fingernail clippings were cleaned using acetone and dried at room temperature. Finally, they were pulverized and lyophilized (see later). The samples from females and males are designated by F# and M#, respectively, where the hashes stand for integers enumerating the participants.
In addition to these 78 regular samples prepared for the main study, there were other samples used to adjust the experimental conditions. A large number of fingernail plates was collected from a single male and then divided into several smaller parts. These samples were used to examine effects of grinding and lyophilization on the keratin structure. Furthermore, 13 male volunteers collected a second series of fingernail clippings. This material was cosmetically treated, as described later, and compared with the first, untreated series of samples from the same subjects. Such a comparison was necessary to find out whether the cosmetic treatment may have affected our NMR results in any way.
Pulverization
Prior to the NMR measurements, the samples were pulverized and homogenized by grinding them in a cryogenic grinder (6770 Freezer/Mill, SPEX SamplePrep LCC, USA). The process involved two steps: freezing for 1 minute and grinding for 1 minute 10 seconds.Lyophilization
The pulverized samples were lyophilized in a laboratory freeze dryer (ALPHA 1-2 LDplus, Christ, Germany) in vacuum conditions. The samples were frozen for 15 minutes in liquid nitrogen, then dried for 24 hours under a pressure of 0.12 mbar and next for 0.5 hour under a pressure of 0.0010 mbar. This procedure was optimized for the fingernail powder. The mass loss representing the removed water was 9.37 ± 0.30 and 9.41 ± 0.32 wt% (mean ± SE) for females and males, respectively. The difference between these values is statistically insignificant.Cosmetic treatment
As previously mentioned, there were 13 nail samples especially collected to verify the effect of cosmetic treatment. All these samples were initially varnished with a colourless nail polish (Wibo, Poland), kept covered with this varnish for 48 hours and then cleaned with a cosmetic nail-polish remover (Delia Cosmetics Sp. z o.o.). This procedure was repeated three times. Afterwards, the clippings were cleaned, pulverized and lyophilized in the same way as other samples.Carbon-13 NMR experiments
The high-resolution solid-state NMR measurements were carried out at 298 K on powdered samples of nails (natural 13C abundance) using an Avance 400 WB spectrometer (Bruker, Germany) with a Bruker 4 mm CP/MAS probe. The resonance 13C (observed) and 1H (decoupler) frequencies were 100 and 400 MHz, respectively. The spectra were acquired with 2000 scans each, using proton TPPM decoupling under MAS at 8 kHz and CP from protons. The contact, acquisition and repetition time periods were 1.5 ms, 0.03 s and 7 s, respectively (optimized). The spectra were processed with zero filling and exponential apodization (LB = 30 Hz). All the raw data of the 13C CP/MAS NMR spectra are collected as pairs of numbers in Dataset S1.†Peak fitting
The spectra were analysed using the ACD Spec Manager 10.08 (2007) software. Initial signal parameters (position, width and height) for the fittings were based on earlier literature results and our own analysis using the second derivative procedure carried out in GRAMS (GRAMS/AI program, version 9.00 R2). The result of the second derivative procedure for the very complicated aliphatic and Cα-methine region is presented in Fig. S1 (see ESI†). Each peak maximum on the inverted second derivative spectrum shows the signal's position on the 13C CP/MAS NMR spectrum. The contributions from various amino acid residues (the aliphatic and aromatic spectral regions) and from α-helix and β-sheet structures (the carbonyl region) were determined from the respective fitted signal areas on 13C CP/MAS NMR spectra.Data preparation
In this work, we analysed areas (also called integral intensities) of the 13C CP/MAS NMR signals from amino acid residues of nail α-keratin. For every individual, there was a spectrum containing a set of signals with areas characteristic of this person. Before any statistical processing, those areas expressed in arbitrary units were appropriately normalized to take account of the different sample amount for each spectrum (person). We used two methods of such normalization, preferred for the particular statistical treatment. For the hierarchical cluster analysis46 and for the statistical tests by groups, the signal areas for each individual were divided by the total area of all the fitted signals within the analysed spectrum. Thus, each signal was represented by an area a fraction of its full spectrum, hereafter called a relative signal area. This was convenient, because the sample mass in the MAS rotor was not involved and, in principle, such normalization rendered data less dependent on the experimental conditions. However, the latter procedure was unacceptable for the principal component analysis (PCA), because it resulted in an ill-conditioned correlation matrix.47 Therefore, for PCA the signal areas for each sample were divided by its weight in mg. In other words, for PCA we used signal areas per 1 mg of the sample, hereafter called absolute signal areas.Statistical analysis
The statistical analysis was done using two computer programs: STATISTICA 12PL (StatSoft, 2016) and SPSS 15.0 for Windows (SPSS Inc., 2006). As a test of data normality, the Shapiro–Wilk W test was performed. To evaluate the differences in means between female and male groups, we used the Student's t-test for unpaired samples or the non-parametric Kolmogorov–Smirnov test for unpaired samples. On the other hand, for the comparison between the samples before and after the cosmetic treatment, the Student's t-test for paired samples or the Wilcoxon signed-rank test for paired samples were applied. The differences between groups were considered significant for p < 0.05.Cluster analysis (CA)46 can sort cases (participants) into meaningful groups based on similarities in the sets of variables (here the NMR signal areas) measured for those cases. We have applied hierarchical CA as an initial method to verify whether areas of the 13C NMR signals of amino acid residues may efficiently characterize differences in nail keratin taken from males and females. The similarity was measured using the Euclidean distance and the dendrogram was constructed using Ward's algorithm (details in Statistical Report S1†).
Principal component analysis (PCA) was done to reduce our large set of variables, which comprised 18 normalized areas of signals from amino acid residues of nail keratin (details in Statistical Report S2†). This statistical method is capable of transforming such a large set of possibly correlated variables into a smaller new set of uncorrelated variables called principal components (PCs).47 In our analysis, only 13 of 18 fitted signals were selected for the final solution based on the criterion that a variable communality value should be over 0.5. We note that the skipped signals (48.0, 56.5, 16.5, 35.8 and 33.0 ppm) were either strongly overlapped with neighbouring signals or rather weak. In the final solution, we kept only one principal component (PC1) according to the Kaiser rule, the variance extracted criterion and the Cattell's scree test. The PC1 was composed of 13 variables, so the case-to-variable ratio was 6 (78/13) and the variable-to-component ratio was 13 (13/1). The overall KMO measure of sampling adequacy (MSA) was 0.905 with the diagonal elements of the anti-image correlation matrix (the MSAs for the individual variables) in the 0.816–0.964 range. The minimum, maximum and mean values of the communalities were 0.51, 0.88 and 0.73 (SE = 0.03), respectively. The absolute values of PC1 loadings were in the 0.714–0.938 range. There was no problem with cross-loadings, because only one component was extracted.
Results
Assignment of NMR signals
Our 13C CP/MAS NMR spectra of fingernail plates in the native state (Fig. 1A) are similar to the nail spectrum reported previously26 and to the spectra of other α-keratin containing materials.8,27,28,33,36–43 They can be subdivided into four regions at 0–50, 50–80, 105–163 and 163–186 ppm, comprising side-chain aliphatic, Cα-methine, side-chain aromatic and carbonyl signals, respectively. This partition is not completely strict, because the first region contains a Cα peak of Gly, while the second one comprises Cβ peaks of Ser and Thr. Unfortunately, the peaks within the nail spectrum are considerably overlapped. | ||
| Fig. 1 A typical 13C CP/MAS NMR spectrum of a human fingernail plate. (A) Full spectrum; (B and C) expanded regions fitted with Gaussian functions. The signal numbers correspond to Table 1. The arrows mark signals that are of particular importance to this work (see text). Asterisks denote spinning sidebands. | ||
To reveal the constituent signals of the particular regions, the spectra have been deconvoluted into Gaussian components (Fig. 1B and C). The side-chain aliphatic, Cα-methine and carbonyl regions comprise nine, four and three signals, respectively. In the side-chain aromatic range, there are three amino acid signals and many disturbing sidebands. The detailed assignment of the fitted signals based on the former publications8,33,43 and Biological Magnetic Resonance Data Bank48 is presented in Table 1.
| Signal | Chemical shifta [ppm] | Assignmentb | Area change for F → M c,d |
|---|---|---|---|
| a SE ≤ 0.1.b Abbreviations: H – helix, S – sheet, C – random coil.c Statistically significant changes (see Table S1): ↓ – decrease, ↑ – increase, NC – no change.d Degree of significance: * weak (0.05 < p < 0.01), ** strong (p < 0.001). | |||
| 1 | 12.7 | δCH3-Ile | ↓** |
| 2 | 16.5 | γ′CH3-Ile; βCH3-Ala(S) | NC |
| 3 | 20.4 | γCH3-Thr,Val; γ′CH3-Val | NC |
| 4 | 25.1 | βCH2-Arg(H); βCH2-reduced Cys; γCH2-Ile,Pro,Arg,Lys; γCH-Leu; δCH3-Leu; δCH2-Lys | ↑* |
| 5 | 29.7 | βCH2-Glu,His,Pro(S); βCH-Val(H) | NC |
| 6 | 33.0 | βCH2-Lys(S); γCH2-Glu | NC |
| 7 | 35.8 | βCH2-Asp,Phe(C),Tyr(C); βCH-Ile(S) | ↓** |
| 8 | 40.5 | αCH2-Gly; βCH2-cross-linked Cys; βCH2-Leu(H); δCH2-Arg; εCH2-Lys | ↑** |
| 9 | 48.0 | δCH2-Pro | NC |
| 10 | 53.4 | αCH-Asp,Glu,His,Phe(C),Tyr(C),Ala(S),Arg(H),Leu(H),Lys(S),Cys(S) | NC |
| 11 | 56.5 | NC | |
| 12 | 59.9 | αCH-Pro(S),Ser(S),Cys(H) | NC |
| 13 | 64.9 | αCH-Ile(S),Thr(H),Val(H); βCH2-Ser(S); βCH-Thr(H) | ↓* |
| # | 116.2 | εCHarom-Tyr | NC |
| 14 | 129.0 | γCarom-Tyr; γC-His; δCHarom-Phe,Tyr; εCHarom-Phe | NC |
| 15 | 157.6 | ζC-Arg; ζCarom-Tyr | ↓* |
| 16 | 171.7 | Main-chain C![[double bond, length as m-dash]](https://www.rsc.org/images/entities/char_e001.gif) O of all amino acids (β-sheet and random coil) O of all amino acids (β-sheet and random coil) |
↑** |
| 17 | 175.4 | Main-chain CO of all amino acids (α-helix) |
↓** |
| 18 | 180.5 | Side-chain CO: γC-Asp, δC-Glu |
NC |
There are two spectral areas of α-keratin, marked in Fig. 1A with arrows, which turned out to be especially useful in our work: (1) the carbonyl region with two signals at about 171.7 and 175.4 ppm from main-chain carbonyl carbons in the β-sheet and α-helix structures, respectively, also containing a minor signal at about 180.5 ppm from side-chain carbonyl carbons of Asp and Glu; (2) a broad signal at 40.5 ppm produced by various amino acids including cross-linked Cys residues. We shall show that these spectral areas can bring essential information on the sex differences in human fingernails.
Sample preparation effects
Our fingernail samples had to be in the form of a powder in order to be spun in the MAS NMR rotor and brought to the same hydration level to be correctly compared in terms of the keratin structure. Keratin can undergo a structural transformation through heating, the action of mechanical forces and by a change in its interaction with a solvent.27–29,40,41 Therefore, it was necessary to check whether our samples had been affected by the preparation processes: pulverization in liquid nitrogen and/or dehydration caused by lyophilization. In both cases, the answer is negative because the 13C CP/MAS spectra of a fingernail plate after grinding and lyophilization (Fig. 2) are virtually the same. In particular, this similarity refers to the signal at 40.5 ppm characterizing the disulphide bonds and to the carbonyl region with contributions from the α-helix and β-sheet structures. There are only insignificant differences in the chemical shifts and relative areas of the fitted carbonyl signals (Fig. 2), as confirmed by appropriate statistical tests. Thus, the sample preparation procedures had an insignificant influence on the keratin structure. | ||
| Fig. 2 The 13C CP/MAS spectrum of fingernail plates from a single man. (A) Cleaned and cut into snippets, (B) pulverized, (C) pulverized and lyophilized. The inset shows corresponding deconvoluted carbonyl regions with the area ratios of the signals at 179.6, 175.8 and 172.0 ppm. | ||
Cosmetic treatment effects
The effect of a cosmetic treatment on fingernail plates has also been investigated. Since females practise nail-varnishing and polishing much more often than males, such cosmetic treatment might influence our results on the sex-related differences in the keratin structure. We have compared the carbon-13 spectra of paired samples taken from 13 males: the first series was in the native state and the second series was the same as the former one but cosmetically treated. Appropriate statistical tests for paired samples were used to compare relative areas of the 18 fitted signals. The tests have indicated that there is no significant difference in the spectra of untreated and treated samples. This is shown in Fig. 3 for the mean relative areas of the signals representing the α-helix and β-sheet structures and the signals having contributions from the Cys residues.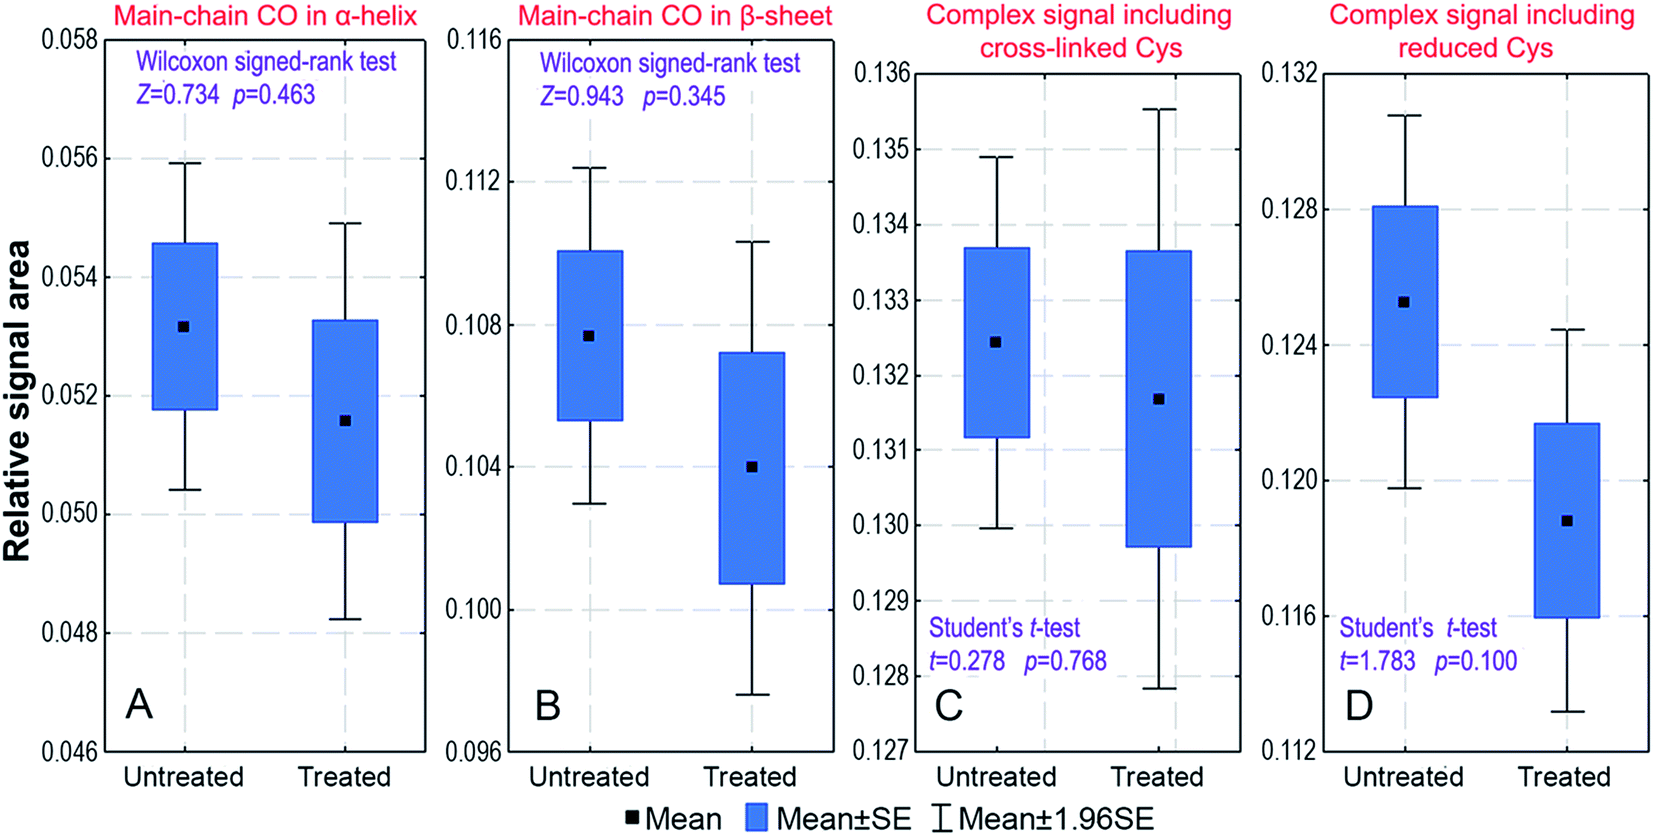 | ||
| Fig. 3 The box-and-whiskers plots for the relative areas of selected 13C CP/MAS signals from male fingernail plates studied before (untreated) and after (treated) the cosmetic treatment. The graphs are shown for the signals at: (A) 175.7 ppm; (B) 171.9 ppm; (C) 40.4 ppm; (D) 25.1 ppm. The observed differences between the untreated and treated samples are statistically insignificant, as shown by the presented p-values of the following tests for paired samples: (A and B) Wilcoxon signed-rank test (non-normal data distribution); (C and D) Student's t-test (normal data distribution). | ||
Sex differences in fingernail keratin
We have performed cluster analysis (CA) and principal component analysis (PCA) to obtain an initial assessment of whether the areas of the keratin 13C CP/MAS NMR signals are sensitive to the gender of the fingernail donors. These analyses were carried out on the relative and absolute signal areas, respectively (see Materials and methods). The CA procedure gave excellent separation of the female and male groups (Fig. 4). The PCA procedure reduced our set of variables to the single component PC1, which explains 73.50% of variance and has sizable loadings from 13 signal areas (Table 2). So many substantial contributions to the PC1 have assured us that the amino acid composition of the nail keratin must display significant inter-subject variability. It is spectacular that the signal at 40.5 ppm, having a large contribution from the Cys residues cross-linked by disulphide bonds, has the highest area loading on the PC1 (0.938). This is an indication that the content of the keratin disulphide bonds can have a particular discriminating power for our purpose. | ||
| Fig. 4 The dendrogram of the hierarchical cluster analysis (CA). Hierarchical CA was performed on the relative areas of the 13C CP/MAS NMR signals. The dendrogram shows a clear discrimination between the male and female groups. | ||
| Extraction of the principal components | ||
|---|---|---|
| PC | Eigenvalue | Cumulative variance (%) |
| 1 | 9.554 | 73.50 |
| 2 | 0.732 | 79.12 |
| 3 | 0.655 | 84.16 |
| 4 | 0.529 | 88.23 |
| 5 | 0.382 | 91.26 |
| PCA characteristics of the variables | ||
|---|---|---|
| Variable | Communalities from PC1 | Factor loadings for PC1 |
| Area 180.5 | 0.509 | 0.714 |
| Area 175.4 | 0.765 | 0.874 |
| Area 171.8 | 0.698 | 0.835 |
| Area 157.6 | 0.773 | 0.879 |
| Area 129.0 | 0.832 | 0.912 |
| Area 64.9 | 0.737 | 0.858 |
| Area 59.9 | 0.730 | 0.855 |
| Area 53.4 | 0.829 | 0.911 |
| Area 40.5 | 0.879 | 0.938 |
| Area 29.7 | 0.754 | 0.868 |
| Area 25.1 | 0.805 | 0.897 |
| Area 20.4 | 0.702 | 0.838 |
| Area 12.7 | 0.540 | 0.735 |
Unfortunately, the PC1 values do not have a normal distribution (Fig. 5A). However, it is evident, even by a visual inspection, that the PC1 distributions for females and males are not alike. The former has a bimodal and the latter a trimodal distribution with considerably different maxima, as fitted with the Gaussian kernel function of the STATISTICA program. This visual distinction is corroborated by the conclusive, non-parametric Kolmogorov–Smirnov test for unpaired samples (p = 0.004; Fig. 5B). In order to apply the stronger, parametric test, we have transformed our non-normally distributed PC1 variable to statistical normality using the Templeton method49 (Fig. 5C). Then, the Student's t-test for unpaired samples proved (p = 0.013) that the mean values of the transformed variable for the female and male groups are significantly different (Fig. 5D). This prompted us to perform group comparisons for each of the 13C CP/MAS NMR signals.
 | ||
| Fig. 5 The comparison of the PC1 scores between female and male cases. (A and C) Statistical distributions; (B and D) box-and-whiskers plots. The original PC1 scores shown in (A) were evaluated in (B) with the non-parametric Kolmogorov–Smirnov test for unpaired samples (p = 0.004), while the PC1 scores transformed to the normal distribution shown in (C) were evaluated in (D) with the parametric Student's t-test for unpaired samples (p = 0.013). | ||
Next, we have selected 18 signals suitable for the comparison between the female and male groups (Table 1). During this procedure, the signals that substantially overlapped with spinning sidebands (εCHarom-Tyr, γCH-Phe, ζCH-Phe, δCH-His and εCH-His) were excluded from further analysis. We were primarily concerned with the signal areas (integral intensities), because they carried quantitative information on the amino acids attributed to those signals. All the spectra were recorded with the same contact time (1.5 ms), optimized for the whole spectrum. It follows that the exact integral intensities of the signals, independent of the cross-polarization kinetics,50 were not determined. Such an analysis of 78 samples measured with a series of contact times (normally we apply at least 32 values), followed by fittings of 18 CP kinetic functions for each spectrum (one function per signal), would be very time-consuming. The kinetic function of each signal within the examined spectrum would be composed of component kinetic functions from the amino acids, which would contribute to this signal. Thus, the fittings would be flawed by the complex nature of the CP signals and consequently by error-prone computations. The problem is that, in principle, each signal in the keratin spectrum is associated with a unique cross-polarization kinetics.50 Given the acquisition conditions, that is, an arbitrary but adjusted contact time is used, the intensity comparison between different signals within the same spectrum is not reasonable, although for the same signal between different spectra it is justified.
Generally, a signal in the 13C CP/MAS NMR spectrum of nail keratin is a superposition of several resonances, because it has contributions from particular carbons of different amino acids (Table 1). There are statistically significant differences between the female and male groups in both integral intensities and widths of seven signals (Signals 1, 4, 7, 8, 13, 16 and 17; Fig. 6) and in the integral intensity of Signal 15 (Tables 1 and S1†). The signal area can vary if there is a change in the amino acid composition of the tissue proteins, in their secondary structure and in their content of disulphide bonds. Those aspects are discussed below.
 | ||
| Fig. 6 The box-and-whiskers plots for the relative areas of selected 13C CP/MAS signals from fingernail plates of females and males. The graphs are shown for the signals at: (A) 175.4 ppm; (B) 171.7 ppm; (C) 40.5 ppm; (D) 25.1 ppm. The observed sex differences are statistically significant, as shown by the presented p-values of the Student's t-test for unpaired samples (normal data distribution). | ||
As far as the amino acid composition is concerned, Dittmar et al. found that the nails of males contain less sulphur than the nails of females.17 Considering that the Met content in nails is negligible compared with that of Cys (0.7 vs. 11.4 mole%51), males must have less Cys than females. The elemental analysis used by Dittmar et al.17 was not capable of specifying whether there was a concomitant shift in relative concentrations of oxidized (cross-linked) and reduced Cys (our Signals 8 and 4). Notwithstanding this, that work gave us a hint that the amino acid composition may be gender dependent. The confirmation of this assumption has already been provided in our work on the CA and PCA analyses. Another piece of evidence can be obtained from Signal 1 (Table 1), which is produced by only one amino acid. This signal has a significantly lower area for males, indicating that the Ile content is lower for this group.
There are two carbonyl signals of crucial importance for assessing the secondary structure of proteins. Signal 16 is from β-sheet (S) and random coil (C) regions, while Signal 17 is only from α-helical (H) regions (Table 1). Both show significant gender differences (Fig. 6). It is clear that males have more S/C and fewer H structural regions than females.
This important result indicates that the interpretation of the signals with contributions from the α and β carbons requires special care. The Cα and Cβ resonances experience substantial spectral shifts during the H ↔ S/C transitions. We have estimated them for the 16 amino acids of nail keratins, including the oxCys and redCys forms, on the basis of Table S1† from the work of Wong et al.33 It turns out that under the H → S and H → C structural changes, the Cα resonances move, on average, to a lower chemical shift by 3.7 and 2.7 ppm, respectively, while the Cβ resonances move, on average, to a higher chemical shift by 2.4 and 0.9 ppm, respectively. Thus, the absolute chemical shift change for Cβ is smaller than for Cα, and for H → C is smaller than for H → S. In contrast, for other carbons (γ, δ, ε, ζ) it is safe to assume that their resonances do not move with a change in the protein secondary structure. Unfortunately, Table 1 contains incomplete assignments concerning the secondary structures. Except for Cys, the positions of the Cα and Cβ resonances are known only for one of the H, S or C structures, as determined by Wong et al.33 Therefore, one must bear in mind that, for example, the Cα(H) resonance of a given amino acid has its Cα(S) and Cα(C) counterparts, possibly displaced to a lower chemical shift by 3.7 and 2.7 ppm, respectively. Nevertheless, a detailed comparative analysis of the signal areas between the female and male groups is possible (Appendix S1†). The greater the line-widths (see the FWHM values in Table S1†), the more probable it is that at least the Cβ resonances will still remain within the original signal envelope despite the keratin H ↔ S/C structural alterations.
Such analysis must also refer to the content of disulphide bonds in the analysed specimens. In this respect, the most helpful information is that β carbons of oxidized (cross-linked) and reduced forms of Cys resonate at about 40 and 25–26 ppm, respectively (Table 1).8 It is meaningful that with a very strong significance (p = 0.0000000067) Signal 8 at 40.5 ppm has a higher mean integral intensity for males than for females (Fig. 6). It follows that the fingernail α-keratin of males has more disulphide bonds than that of females. The analysis of Signal 4 at 25.1 ppm is not straightforward, but its increase for males (low significance: p = 0.013) can be explained by a rise of the Leu content.
Overall, the detailed comparative analysis of the peak areas (Table S1†) demonstrates some modification of the amino acid composition of fingernail α-keratin (expressed in molecular fractions), when going from females to males: an increase in Leu, Ala and possibly in Ser; a decrease in Cys, Arg and Ile; no change found in Glu, Asp, Pro, Thr, Val, Tyr and Phe; undetermined variations in Gly, Lys and His.
Discussion
Our results refer to proteins of fingernail plates, in particular to keratins of IFs and to KAPs of the matrix. The 13C CP/MAS NMR spectra provided new information on the amino acid composition, the secondary structure and the content of disulphide bonds. It was proved with certainty that these features are gender dependent.With regard to the amino acid composition, the observed difference between males and females cannot simply be explained by a difference in the filaments/matrix ratio. Consider that low-sulphur proteins are in the filaments and high-sulphur proteins are in the matrix. The amino acid molecular percentages in these proteins of fingernail plates are known from the work of Marshall.51 Therefore, it is possible to figure out what would be the effect on the molecular percentages of particular amino acids caused by an increase or decrease of the filaments/matrix ratio. However, neither of these outcomes matches the observed differences between the amino acid profiles of males and females. One need only look at the differences in the Ile, Ala, Pro and Glu content – the amino acids assessed by us with a fair level of confidence and simultaneously showing large differences between the low- and high-sulphur proteins. We found for males that Ile and Ala have a lower and higher content, respectively, than for females, while Pro and Glu keep the same concentrations. As the sulphur content is lower for males,17 a higher filaments/matrix ratio would be expected and translated into the decrease in Pro and the increase in Ile, Ala and Glu.51 Thus, nothing fits and the reasoning based only on the difference in the filaments/matrix ratio has to be rejected.
There are various types of keratins and KAPs with specific amino acid compositions and sequences. These proteins show considerable variability between species, between different animals within a species, between tissues of one animal and even in their distribution inside the examined tissue.52 Such variability is also observed in humans.1,53 Therefore, we believe that the difference we observed in the amino acid composition between males and females results generally from the sex-dependent proportions of various proteins in human fingernails. We submit that sex hormones are capable of inducing the expression of particular keratin genes,54,55 so they can affect the amino acid composition of α-keratin and consequently regulate the relative abundance of the α-helix and β-sheet regions, and the amount of disulphide bonds, too. Furthermore, it is known that the sex hormones exert influence on the skin and skin appendages.56 The differences in the amino acid composition were occasionally found in other fibrillar (collagen)57 and globular (blood plasma)58 proteins. These findings are not related to fingernail α-keratin, but together with our results indicate that when discussing biochemical protein functions, it is worthwhile to pay attention to possible gender differences in the amino acid composition.
We have found that fingernail proteins of males have significantly more β-sheet and random coil structural regions, and fewer α-helix structural regions than those of females. The β-sheet and random coil structures are more frequent in the α-keratin matrix, which is rich in globular KAPs. However, such structural segments can also be present in the IF keratins. On the basis of our results, we cannot reach a conclusion about whether the fibrils, the matrix or both these components are responsible for the gender-related difference in the secondary structure. We only submit that the postulated increase in the Ser content together with the decrease in the Cys content are reminiscent of β-keratins, in which the β-sheet is the preferred secondary structure.3 Therefore, such changes may endow male keratin with a greater stiffness.3
Furthermore, we have found that the fingernail α-keratin of males has more disulphide bonds than that of females. This should be noted in view of the lower content of sulphur for the male group. Using the results of Dittmar et al.17 reported in wt%, we have estimated that in their work the Cys content of male nails was lower by 0.6 mole% compared with that of females and that this amount corresponds to about 6 Cys residues per 1000 amino acid residues. If all the Cys residues were involved in disulphide bonds, the lower content of Cys would correspond only to the loss of 3 such bonds per 1000 residues. This is not many and, in fact, it does not prevent Signal 8 at 40.5 ppm (Table 1), controlled by oxCys, from exhibiting a significantly larger integral intensity for males than for females. Thus, a higher content of disulphide bonds is possible in the α-keratin of males, despite the lower Cys content, and it renders their fingernail plates stiffer than those of females.
The discussion about α-keratin from fingernails cannot take place without a comparison with hair, the other skin appendage containing this proteinaceous material. The information in the literature on hair proteins is immense, but we are aware only of two sources that make reference to the gender effects. Dawber59 mentioned that “in general, male scalp hair contains more cystine than female hair…” without giving any supporting evidence. Barton45 observed that male hair fibres preferred the β-sheet structure (PCA and derivative analyses of ATR-FT-IR spectra). Interestingly, these two sex-related pieces of information on hair are in agreement with our results on nails.
In summary, nail clippings can serve as a diagnostic material in medical and forensic analyses. They are easy to collect in a non-invasive manner, are stable and do not require special storage conditions.60 Our work has shown that 13C CP/MAS NMR spectroscopy combined with a hierarchical cluster analysis is capable of discriminating between nail plates from different genders. This method can be readily used in forensic investigations together with Raman analysis.61,62 Nail proteins were studied in relation to osteoporosis,19–22,63,64 diabetes,23 chronic fatigue syndrome65 and autism.25 The application of the nail material and solid-state NMR spectroscopy to diagnose diseases on the molecular level is an interesting perspective. However, the next desirable step should be to study how the nail α-keratin composition and structure change with ageing.
Conflict of interest statement
The authors declare no conflict of interest.Acknowledgements
The Medical University of Warsaw is acknowledged for the Young Scientists' Grant (FW23/PM33D/14). The authors are grateful to the volunteers for taking part in this study.References
- D. A. R. de Berker and R. Baran, in Baran & Dawber's Diseases of the Nails and their Management, ed. R. Baran, D. A. R. de Berker, M. Holzberg and L. Thomas, Wiley-Blackwell, Chichester, United Kingdom, 2012, pp. 1–50 Search PubMed.
- D. de Berker, Clin. Dermatol., 2013, 31, 509–515 CrossRef PubMed.
- B. Wang, W. Yang, J. McKittrick and M. A. Meyers, Prog. Mater. Sci., 2016, 76, 229–318 CrossRef CAS.
- M. Feughelman, J. Appl. Polym. Sci., 2002, 83, 489–507 CrossRef CAS.
- M. H. Lynch, W. M. O'Guin, C. Hardy, L. Mak and T.-T. Sun, J. Cell Biol., 1986, 103(6), 2593–2606 CrossRef CAS PubMed.
- D. A. D. Parry, S. V. Strelkov, P. Burkhard, U. Aebi and H. Hermann, Exp. Cell Res., 2007, 313, 2204–2216 CrossRef CAS PubMed.
- L. Kreplak, J. Doucet, P. Dumas and F. Briki, Biophys. J., 2004, 87, 640–647 CrossRef CAS PubMed.
- M. J. Duer, N. McDougal and R. C. Murray, Phys. Chem. Chem. Phys., 2003, 5, 2894–2899 RSC.
- A. Sukumar, Rev. Environ. Contam. Toxicol., 2006, 185, 141–177 CAS.
- G. Samanta, R. Sharma, T. Roychowdhury and D. Chakraborti, Sci. Total Environ., 2004, 326, 33–47 CrossRef CAS PubMed.
- B. Nowak and J. Chmielnicka, Ecotoxicol. Environ. Saf., 2000, 46, 265–274 CrossRef CAS PubMed.
- C. Barba, M. Martí, A. M. Manich, J. Carilla, J. L. Parra and L. Coderch, Thermochim. Acta, 2010, 503–504, 33–39 CrossRef CAS.
- I. Rodushkin and M. D. Axelsson, Sci. Total Environ., 2000, 262, 21–36 CrossRef CAS PubMed.
- E. Schumacher, W. Dindorf and M. Dittmar, Sci. Total Environ., 2009, 407(7), 2151–2157 CrossRef CAS PubMed.
- R. J. Block, D. Bolling, F. C. Brand and A. Schein, J. Biol. Chem., 1939, 128, 181–186 CAS.
- S. Yaemsiri, N. Hou, M. M. Slining and K. He, J. Eur. Acad. Dermatol. Venereol., 2010, 24, 420–423 CrossRef CAS PubMed.
- M. Dittmar, W. Dindorf and A. Banerjee, Gerontology, 2008, 54, 100–105 CrossRef CAS PubMed.
- M. Bahreini, Z. Hosseinimakarem and S. H. Tavassoli, J. Appl. Phys., 2012, 112, 054701 CrossRef.
- I. Pillay, D. Lyons, M. J. German, N. S. Lawson, H. M. Pollock, J. Saunders, S. Chowdhury, P. Moran and M. R. Towler, J. Women's Health, 2005, 14, 339–344 CrossRef CAS PubMed.
- P. Moran, M. R. Towler, S. Chowdhury, J. Saunders, M. J. German, N. S. Lawson, H. M. Pollock, I. Pillay and D. Lyons, J. Mater. Sci.: Mater. Med., 2007, 18, 969–974 CrossRef CAS PubMed.
- M. R. Towler, A. Wren, N. Rushe, J. Saunders, N. M. Cummins and P. M. Jakeman, J. Mater. Sci.: Mater. Med., 2007, 18, 759–763 CrossRef CAS PubMed.
- N. M. Cummins, J. C. C. Day, A. Wren, P. Carroll, N. Murphy, P. M. Jakeman and M. R. Towler, Spectroscopy, 2010, 42, 517–524 CrossRef.
- K. M. Farhan, T. P. Sastry and A. B. Mandal, Clin. Chim. Acta, 2011, 412, 386–389 CrossRef CAS PubMed.
- V. J. James, Int. J. Cancer, 2009, 125, 133–138 CrossRef CAS PubMed.
- M. D. L. Priya and A. Geetha, Clin. Chim. Acta, 2011, 412, 1036–1042 CrossRef PubMed.
- D. E. Demco, L. Utiu, W. Tillmann, B. Blümich and C. Popescu, Chem. Phys. Lett., 2011, 509, 62–66 CrossRef CAS.
- H. Yoshimizu, H. Mimura and I. Ando, Macromolecules, 1991, 24, 862–866 CrossRef CAS.
- N. Nishikawa, Y. Tanizawa, S. Tanaka, Y. Horiguchi and T. Asakura, Polymer, 1998, 39, 3835–3840 CrossRef CAS.
- M. Baias, D. E. Demco, C. Popescu, R. Fechete, C. Melian, B. Blümich and M. Möller, J. Phys. Chem. B, 2009, 113, 2184–2192 CrossRef CAS PubMed.
- A. Böckmann, M. Ernst and B. H. Meier, J. Magn. Reson., 2015, 253, 71–79 CrossRef PubMed.
- V. Agarwal, S. Penzel, K. Szekely, R. Cadalbert, E. Testori, A. Oss, J. Past, A. Samoson, M. Ernst, A. Böckmann and B. H. Meier, Angew. Chem., Int. Ed., 2014, 53, 12253–12256 CrossRef CAS PubMed.
- V. Ladizhansky, Isr. J. Chem., 2014, 54, 86–103 CrossRef CAS.
- W. C. V. Wong, A. Narkevicius, W. Y. Chow, D. G. Reid, R. Rajan, R. A. Brooks, M. Green and M. J. Duer, J. Biomol. NMR, 2016, 66, 93–98 CrossRef CAS PubMed.
- M. J. Duer, Introduction to Solid-State NMR Spectroscopy, Wiley-Blackwell, Oxford, United Kingdom, 1st edn, 2004 Search PubMed.
- D. C. Apperley, R. K. Harris and P. Hodgkinson, Solid-State NMR: Basic Principles & Practice, Momentum Press, New York, USA, 2012 Search PubMed.
- H. R. Kricheldorf and D. Müller, Colloid Polym. Sci., 1984, 262, 856–861 CAS.
- H. Yoshimizu and I. Ando, Macromolecules, 1990, 23, 2908–2912 CrossRef CAS.
- H. Yoshimizu, H. Mimura and I. Ando, J. Mol. Struct., 1991, 246, 367–379 CrossRef CAS.
- N. Nishikawa, Y. Horiguchi, T. Asakura and I. Ando, Polymer, 1999, 40, 2139–2144 CrossRef CAS.
- M. Baias, D. E. Demco, D. Istrate, C. Popescu, B. Blümich and M. Möller, J. Phys. Chem. B, 2009, 113, 12136–12147 CrossRef CAS PubMed.
- L. Utiu, D. E. Demco, R. Fechete, M. Möller and C. Popescu, Chem. Phys. Lett., 2011, 517, 86–91 CrossRef CAS.
- Y. Jokura, S. Ishikawa, H. Tokuda and G. Imokawa, J. Invest. Dermatol., 1995, 104, 806–812 CrossRef CAS PubMed.
- S. Björklund, A. Nowacka, J. A. Bouwstra, E. Sparr and D. Topgaard, PLoS One, 2013, 8(4), e61889 Search PubMed.
- U. Jacobi, J. Gautier, W. Sterry and J. Lademann, Dermatology, 2005, 211, 312–317 CrossRef PubMed.
- P. M. J. Barton. PhD thesis, Queensland University of Technology, Brisbane (Australia), 2011 Search PubMed.
- P. A. Gore Jr, in Handbook of Applied Multivariate Statistics and Mathematical Modeling, Cluster analysis, ed. H. E. A. Tinsley and S. D. Brown, Academic Press, London, United Kingdom, 2000, pp. 297–321 Search PubMed.
- M. A. Pett, N. R. Lackey and J. J. Sullivan, Making Sense of Factor Analysis: The Use of Factor Analysis for Instrument Development in Health Care Research, SAGE Publications, London, United Kingdom, 1st edn, 2003 Search PubMed.
- E. L. Ulrich, H. Akutsu, J. F. Doreleijers, Y. Harano, Y. E. Ioannidis, J. Lin, M. Livny, S. Mading, D. Maziuk, Z. Miller, E. Nakatani, C. F. Schulte, D. E. Tolmie, R. K. Wenger, H. Yao and J. L. Markley, Nucleic Acids Res., 2008, 36(1), D402–D408 CAS.
- G. F. Templeton, Comm. Assoc. Inform. Syst., 2011, 28(4), 41–58 Search PubMed.
- W. Kolodziejski and J. Klinowski, Chem. Rev., 2002, 102, 613–618 CrossRef CAS PubMed.
- R. C. Marshall, J. Invest. Dermatol., 1980, 75, 264–269 CrossRef CAS PubMed.
- R. C. Marshall, D. F. G. Orwin and J. M. Gillespie, Electron Microsc. Rev., 1991, 4, 47–83 CrossRef CAS PubMed.
- R. Moll, M. Divo and L. Langbein, Histochem. Cell Biol., 2008, 129, 705–733 CrossRef CAS PubMed.
- H. H. Bragulla and D. G. Homberger, J Anat., 2009, 214, 516–559 CrossRef CAS PubMed.
- L. F. Jave-Suarez, L. Langein, H. Winter, S. Praetzel, M. A. Rogers and J. Schweizer, J. Invest. Dermatol., 2004, 122, 555–564 CrossRef CAS PubMed.
- O. Abbas and A.-G. Kibbi, in Manual of Gender Dermatology, ed. L. C. Parish, S. Brenner, M. Ramos-e-Silva and J. L. Parish, Jones & Bartlett Learning LLC, Sudbury, United States of America, 2011, pp. 25–90 Search PubMed.
- S. A. Gerk and O. A. Golovanova, Chem. Sustainable Dev., 2013, 21, 283–288 Search PubMed.
- M. D. Armstrong and U. Stave, Metabolism, 1973, 22(4), 561–569 CrossRef CAS PubMed.
- R. Dawber, Clin. Dermatol., 1996, 14(1), 105–112 CrossRef CAS PubMed.
- S. Stephen, A. Tosti and A. Rubin, Dermatol. Clin., 2015, 33, 289–301 CrossRef CAS PubMed.
- E. Widjaja, G. H. Lim and A. An, Analyst, 2008, 133(4), 493–498 RSC.
- E. Widjaja and M. Garland, Talanta, 2010, 80(5), 1665–1671 CrossRef CAS PubMed.
- J. R. Beattie, N. M. Cummins, C. Caraher, O. M. O'Driscoll, A. T. Bansal, R. Eastell, S. H. Ralston, M. D. Stone, G. Pearson and M. R. Towler, Clin. Med. Insights: Arthritis Musculoskeletal Disord., 2016, 9, 109–116 CrossRef PubMed.
- A. Hossein-nezhad, M. Sadeghi Afjeh, H. Saghafi, M. Rahmani, M. Parviz, Z. Maghbooli and B. Larijani, Iran. J. Public Health, 2008, 37(sup), 55–62 Search PubMed.
- A. Sakudo, H. Kuratsune, Y. H. Kato and K. Ikuta, Clin. Chim. Acta, 2009, 402, 75–78 CrossRef CAS PubMed.
Footnote |
| † Electronic supplementary information (ESI) available. See DOI: 10.1039/c7ra03487c |
| This journal is © The Royal Society of Chemistry 2017 |