
 Open Access Article
 This Open Access Article is licensed under a Creative Commons Attribution-Non Commercial 3.0 Unported Licence
Evolution of the in vitro degradation of Zn–Mg alloys under simulated physiological conditions
Marta M. Alves *a,
Tomáš Prošekb,
Catarina F. Santosac and
Maria F. Montemora
*a,
Tomáš Prošekb,
Catarina F. Santosac and
Maria F. Montemora
aCQE, DEQ, Instituto Superior Técnico, Universidade de Lisboa, Av. Rovisco Pais 1049-001, Lisboa, Portugal. E-mail: martamalves@tecnico.ulisboa.pt
bTechnopark Kralupy, The University of Chemistry and Technology in Prague, Zizkova 7, 278 01 Kralupy nad Vltavou, Czech Republic
cEST Setúbal, DEM, Instituto Politécnico de Setúbal, Campus IPS, 2910-761 Setúbal, Portugal
First published on 30th May 2017
Abstract
The primary reactions occurring upon the insertion of Zn-derived materials inside an organism are of the utmost importance as the chemical species resulting from degradation of these new resorbable biomaterials will be crucial for the interaction with the surrounding tissues. In this sense, the degradation of Zn–Mg alloys under physiologically simulated conditions was investigated. The presence of magnesium (1–2%) as an alloying element in Zn alloys affected the composition of the corrosion layer and the associated in vitro degradation behaviour. A detailed physico-chemical characterization of the in vitro built-up of the corrosion layers of pure Zn and two Zn–Mg alloys (Zn–1Mg and Zn–2Mg) was achieved by confocal Raman spectroscopy, scanning electron microscopy and energy-dispersive X-ray spectroscopy. This study revealed that the presence of Mg in Zn–Mg alloys modulated simonkolleite turnover, promoted brucite formation and yielded a calcium phosphate layer containing skorpionite and hydroxyapatite. These last compounds, by being bone analogues may favour the osseointegration of Zn–Mg-based materials over that of pure Zn. When comparing both Zn–Mg alloys, the distinct evolutions observed in these compounds' (skorpionite and hydroxyapatite) formation may present specific advantageous according to the bone-healing process required. A detailed analysis of the corrosion behaviour, achieved by electrochemical techniques, showed that Zn–Mg alloys had a corrosion resistance inferior to that of pure Zn; however, the built-up of potential biocompatible corrosion layers together with superior strength and castability of these Zn–Mg alloys make them special attractive biomaterials for clinical bone implants, particularly adequate in load-bearing applications.
1. Introduction
Our aging society has an urgent need for novel biomaterials. Amongst typical bone and heart-associated malignancies, there is a considerable number of pathologies requiring transient support in wound-healing processes.1 Resorbable biomaterials are being revealed as promising candidates to assist in these transient-healing processes. The main advantage lies on the absorption of the inserted material that by avoiding a second surgery for implant removal will improve patients' recovery. Bioresorbable materials used for biomedical applications are polymers, ceramics and metals.2 Metals have been widely used due to their characteristic high mechanical stress resistance and fracture toughness. When composed of non-toxic and essential metals such as Mg, Fe and Zn, these biomaterials are expected to present optimal biocompatibilities. Despite the interesting mechanical properties of Mg and Fe, the degradation rate of these two biomaterials requires additional surface protection strategies to meet the requisites for biomedical applications.3–6 The corrosion rate of Zn has been reported to be compatible with that of wound-healing progress, with the degradation products considered innocuous for adjacent tissues.7,8 Zinc, as a micronutrient, with a tolerable upper intake of 40 mg per day, supports the function of numerous enzymes involved in essential processes like protein and DNA synthesis. This involvement is translated in the participation of Zn in a myriad of cellular processes that goes from intracellular signalling to immunity modulation and bone growth.9 A favoured bone growth, and therefore skeletal remodelling, may promote a faster healing process which will drive to the best possible bone functional recovery.9 Moreover, in elderly, a fragile population segment more often requiring medical implants, Zn supplementation was reported to decrease common cold extent and severity, blindness and cardiovascular diseases mortality,9,10 providing thus potentially additional beneficial health effects. However, when considering load-bearing implants, the poor mechanical strength of Zn limits its use. A superior strength and castability can be achieved by alloying Zn. Commercial Zn alloys demonstrated increased strength and superb elongation when compared with pure Zn;11 however a detrimental effect by the release of Al into the organism cannot be ignored. In that sense, the addition of physiological relevant elements may bring an added value in terms of biocompatibility.12,13 Mg, for example, is an essential nutrient that supports important biological processes from which bone growth and development can be highlighted.14 The addition of Mg provided Zn–Mg alloys with a maximum strength and elongation for Mg contents around 1 wt%.12,15,16 The in vitro and in vivo assays confirmed these alloys biocompatibility.17–21 Nevertheless, contradictory in vitro degradation results were attained. Li et al.21 reported that Zn–1Mg was prone to corrosion more than pure Zn,21 whereas Cheng et al.22 reported the opposite behaviour. Similarly Dambatta et al.17 reported a higher corrosion potential for Zn–3Mg than for pure Zn, with other studies pointing out similar in vitro degradation rates for Zn–1Mg, Zn–1.5Mg and Zn–3Mg.12,23 As already pinpointed by Krieg et al.,16 this discrepancy may arise from experimental setups, with the immersion time and electrolyte solutions being two important key factors.24 For instance, Dambatta et al.17 referred to the early (at the seconds level) in vitro degradation of Zn–Mg alloys whereas in other studies authors reported the responses of samples immersed for 7 days,25 14 days12,23,26 and 21 days.27 It is important to have in mind that from the time that a resorbable metallic material is inserted inside the organism and cells adhesion, a corrosion layer is build-up. The nature of these corrosion products is crucial for the upcoming cell interaction, which is expected to occur in a couple of hours up to a few days.28 In this sense, in vitro degradation studies within an early immersion times are more adequate for the in vivo translation of the achieved results. Furthermore, the electrolyte solution used in the majority of these studies was simulated body fluid (SBF) solution,12,17,23,27 whereas few other works used Hank's21,26 or NaCl solutions.25 An extensive review performed by Sanchez et al.24 on the degradation rates of Mg alloys revealed that SBF solution had the better correlation between in vitro and in vivo results. Recently, Ascencio et al.29 reported the importance of the electrolyte renewal in the corrosion mechanisms of Mg alloys. Indeed, the homeostasis provided by the adjacent tissues to the implanted material, i.e. compensation of ions imbalance from alloys dissolution and corrosion products precipitation,29 is an important factor to have in consideration in in vitro assays. This has not yet been considered for the in vitro corrosion studies of Zn–Mg alloys.12,23,25,27To address these important gaps in the knowledge of Zn–Mg alloys behaviour within the context of biodegradable implants, i.e., (i) earlier degradation events and (ii) electrolyte renewal, a detailed evaluation of the corrosion layers built-up and in vitro degradation of pure Zn, Zn–1Mg and Zn–2Mg was performed. For that purpose Raman spectroscopy, scanning electron microscopy (SEM), chemical element analyses and electrochemical impedance spectroscopy (EIS) were used.
2. Experimental
2.1. Preparation of the materials
The alloys were prepared as described by Prosek et al.30 Briefly, Zn was melted and ZnCl2 flux was added at the temperature of 450 °C. Magnesium was set in at the temperature by 50 K higher than the liquidus temperature of each alloy. The melt was strongly homogenized by a graphite bar and poured into a mould with a quatrefoil section. After solidification, it was machined to a bar with diameter of 20 mm and cut to coin-like samples. Chemical composition of the alloys, given in Table 1, was determined using a X-ray energy dispersive spectrometer (EDS) analysis.30 The resulting microstructure was studied after etching by 5% (v/v) HNO3 in ethanol.| Substrate | Zn [wt%] | Mg [wt%] |
|---|---|---|
| Zn | 99.9 | 0.0 |
| Zn–Mg1 | 98.9 | 1.1 |
| Zn–Mg2 | 97.9 | 2.1 |
2.2. Physico-chemical characterization
The corrosion layer-built up was studied by immersing the samples in 40 ml of SBF solution at pH 7.4 (Table 2) at 37 °C up to six days. In this system a three days renewal interval was considered to avoid pH variations.| Reagents | Amount for 1 L | Concentration |
|---|---|---|
| NaCl | 8.035 g | 137.5 mM |
| NaHCO3 | 0.355 g | 4.2 mM |
| KCl | 0.225 g | 3.0 mM |
| K2HPO4·3H2O | 0.231 g | 1.0 mM |
| MgCl2·6H2O | 0.311 g | 1.5 mM |
| CaCl2 | 0.292 g | 2.6 mM |
| Na2SO4 | 0.072 g | 0.5 mM |
| (HOCH2)3CNH2 | 6.118 g | 50.5 mM |
Raman spectra of the corrosion layers built-up after one, three and six days of immersion were collected by using the radiation source with a solid-state laser operating at 532 nm with an output power of 20 mW and a spectrograph with a 600 lines per mm grating (Horiba LabRAM HR800 Evolution). A 100 times objective lens focused the laser beam on the samples surface and the spectra were obtained with acquisition time of 10 s and 10 accumulations. Spectra from different morphological features were acquired and added after normalization. The morphology of these corroded surfaces was analysed by scanning electron microscopy (SEM) using a Hitachi S2400 apparatus, and the elemental chemical composition by the respective EDS.
2.3. Electrochemical measurements
For the electrochemical experiments, Zn, Zn–1Mg and Zn–2Mg coupons were mounted in cold curing epoxy resin. The mounted coupons were polished with SiC paper up to 2500 grit, washed with ethanol and dried in air before use. The corrosion tests were performed by immersing the samples in SBF solution at pH 7.4 (Table 2) at 37 °C. A three-electrode electrochemical cell with the sample as working electrode, saturated calomel electrode (SCE) as reference electrode, and a platinum coil as counter electrode was used. The electrochemical measurements were carried out in an AUTOLAB PGSTAT 302N. Electrochemical impedance spectroscopy (EIS) measurements were carried by applying 10 mV perturbation with the measuring frequency ranging from 105 Hz down to 10−2 Hz. The EIS spectra were periodically recorded at open circuit potential (OCP) during immersion in the testing electrolyte. For that purpose the samples were immersed up to six days with a three days solution renewal interval. Potentiodynamic measurements were performed within the range of ±10 mV from OCP until ±1 V vs. SCE at a scan rate of 1 mV s−1. Each electrochemical assay was repeated to confirm the reproducibility of the results. The EIS data analyses, the equivalent circuit modelling and corresponding elements values were calculated using Zview® software and the Tafel extrapolation method used to determine the corrosion current density (icorr) and the corrosion potential (Ecorr) was performed using OriginPro 8.5.0 software. The corrosion rates were then determined according to ASTM Standard G102.2.4. Simulated body fluid contact angle
The samples were polished with SiC paper up to 2500 grit, washed with absolute ethanol and dried in vacuum before use. Surface contact angle was evaluated by measuring the static contact angles of SBF solution through the sessile drop method at 37 °C. Drops generated with a micrometric syringe were deposited on the surface. The corresponding images were acquired using a video camera (JAI CV-A50) attached to a microscope (Wild M3Z), which was connected to a frame grabber (Data Translation DT3155). The image acquisition and analyses were performed 30 s after the droplet deposition using the ADSA-P software (Axisymmetric Drop Shape Analysis-Profile). Statistically significant changes were evaluated by one way ANOVA on ranks and Dunn's test (p < 0.05).3. Results and discussion
3.1. Built-up of the corrosion layers
The insertion of a biomaterial inside an organism triggers several biochemical events. One of the primary events, especially important when considering resorbable metallic materials, are electrochemical reactions. These reactions, responsible for controlling the degradation of such metallic materials will strongly influence the built-up of the resulting corrosion layer. Typically, the composition of corrosion layers of Zn-derived substrates is dependent upon the ionic species available in the electrolyte.32 The SBF solution, used to simulate the physiological environments,31 when in contact with metallic Zn-derived surfaces may promote Zn ions release into the solution (eqn (1)):| Zn → Zn2+ + 2e− | (1) |
The interaction of the released ions with the available ionic species results in the built-up of specific corrosion products. Hydra Medusa33 calculations depicted in the fraction diagram in Fig. 1a show that Zn in the SBF solution at pH 7.4 can precipitate in the form of Zn5Cl2(OH)8 (simonkolleite), Zn5(CO3)2(OH)6 (hydrozincite), ZnCO3 (smithsonite) or Zn3(PO4)2 (hopeite). The oxidation reaction is balanced by oxygen reduction, resulting in an increased hydroxyl ion content that additionally favours metal hydroxide formation (eqn (2)):
| Zn2+ + 2OH− → Zn(OH)2 | (2) |
 | ||
| Fig. 1 Fraction diagram for Zn (a) and Mg (b) in aqueous solution at 25 °C calculated by Hydra Medusa software.33 An initial concentration of soluble Me2+ of 10−4 M at pH 7.4 was considered. The ionic concentration for Cl−, HCO32− and HPO42− were used according to the concentrations present in the simulated body fluid (SBF) solution (Table 2). | ||
Zinc hydroxide is readily dehydrated to form ZnO (zincite).34 In a similar perspective, the dissolution of Mg can allow for formation of corrosion products in the form of MgCO3 (magnesite), as depicted in Fig. 1b, and additionally Mg(OH)2 (brucite).32,35 As depicted in Fig. 2, the characteristic Raman peaks of the corrosion products matched with those deposited in RRUFF database (http://rruff.info) for simonkolleite (390 cm−1), hydrozincite (390 cm−1 and 1050 cm−1) and zincite (420 cm−1). The absence of the characteristic peaks for smithsonite and hopeite excluded these compounds from participating in the built-up of the corrosion layers. A novel P-derived compound, Ca3Zn2(PO4)2CO3(OH)2 (skorpionite) with two characteristic peaks at 970 cm−1 and 1080 cm−1, was detected as contributing for the built-up of the corrosion layers. In fact, the presence of Zn-doped Ca phosphates was already reported on corroded Zn–Mg alloy surfaces.23,36,37 The presence of a peak at 970 cm−1 without that at 1080 cm−1 can be pinpointed for Ca5(PO4)3(OH) (hydroxyapatite). Typically the immersion of biomaterials in the SBF solution is used to grow a hydroxyapatite-containing coating on their surface.31,38 An additional strong band detected at around 556 cm−1, previously ascribed to the surface optical (SO) phonon vibrations, was consistently detected on Zn and Zn–Mg alloys. This may have resulted from disorderly arranged areas or boundaries between alloy surfaces and disordered regions of native oxide layers.39,40 The presence of Mg in the alloys was assigned to the characteristic peak of brucite at 277 cm−1 and 443 cm−1, with no characteristic peak being assigned to magnesite.
 | ||
| Fig. 2 Raman spectra of the corroded surfaces of Zn, Zn–1Mg and Zn–2Mg immersed in simulated body fluid (SBF) solution at 37 °C for one, three and six days; peaks were compared with those deposited in RRUFF database (http://rruff.info): hydroxyapatite, HAP (ID: R060180); simonkolleite, SMK (ID: R130616); hydrozincite, HDZ (ID: R050635); skorpionite, SKP (ID: R060938); zincite, ZNC (ID: R050635) and brucite, BRC (ID: R040077). SO stands for surface optical phonon vibrations. Predominate peaks are marked in bold. | ||
3.2. Evolution of the corrosion layer
The evolving nature of the corrosion layers was analysed along the immersion time (Fig. 2). The typical zincite peak41 indicated the presence of this compound along the time on Zn and Zn–Mg corroding surfaces. Hydrozincite and skorpionite, which were formed at the earlier stages of immersion of Zn, tended to vanish until day three and reappeared in the corrosion layer later on. The evidence of simonkolleite and hydroxyapatite at the earliest immersion stages could be distorted because the characteristic peaks of these compound are coincident with those of hydrozincite and skorpionite, respectively. However, the disappearance of the major hydrozincite and skorpionite peaks at 1050 cm−1 and 1080 cm−1, respectively, three days after immersion confirmed that simonkolleite and hydroxyapatite were formed thereafter. The progression of hydroxyapatite, a biomimetic compound, was quite distinct on the corroded surfaces of Zn and Zn–Mg alloys. While the characteristic peak for hydroxyapatite (970 cm−1) revealed a decreasing trend along Zn immersion, the opposite behaviour was observed for Zn–Mg alloys. This behaviour can impact the material biocompatibility, as the presence of this bone analogue may favour wound-healing progression by increasing angiogenesis and decreasing implanted-associated inflammatory reactions.42 Brucite, the only Mg-derived corrosion product identified, was detected on the corroded Zn–Mg alloy surfaces three days after immersion.A deeper insight into the built-up of these layers was attained by studying the spatial distribution of these compounds. As depicted in Fig. 3, the morphological and chemical elements distribution revealed typical features that can be assigned to some of the previously identified Zn-derived corrosion compounds.32 As depicted in Fig. 3a and b, the overlap of lamina-like structures with the chloride map evidenced the spatial distribution of simonkolleite. The typical lamina-like structure observed on Zn surface, one day after immersion, was absent three days after, reappeared at the sixth day. This observation corroborated the dynamic behaviour of simonkolleite formation already pinpointed (Fig. 2). On the corroded surface of Zn–1Mg the typical lamina-like structures could not be detected, however, the chloride map suggested that simonkolleite was present on the corrosion layer since the beginning of immersion. On Zn–2Mg the detection of chloride together with a lamina-like structure six days after immersion indicated a delayed formation of simonkolleite. Overall, according to the corroding substrate distinct simonkolleite turnovers were attained: a fast turnover occurred on pure Zn, a slower happened on Zn–1Mg and delayed one took place on Zn–2Mg. A high content of carbon (data not shown) overlapping with a typical dark crystal-like structure (Fig. 3a), detected three days after immersion, was consistent with hydrozincite formation on Zn surface. The absence of identical morphological features on the alloys surface did not excluded the presence of such corrosion product (Fig. 2). The detection of light spherical aggregates, one day after immersion on the alloys and three days after on Zn (Fig. 3a), together with phosphorous and calcium maps (Fig. 3b) could be related to the formation of hydroxyapatite. These were morphological features coincident with those reported for the formation of hydroxyapatite layers on biomaterials' surfaces.38 Despite the absence of an associated morphologic structure, the presence of skorpionite could also be considered (Fig. 2 and 3). Although no morphologic features could be associated to brucite, the detection of magnesium three days after immersion on the surface of Zn–Mg alloys (Fig. 3c) suggested that this compound was actively participating in the built-up of the corrosion layer, as proposed by the Raman data (Fig. 2). Finally, the presence of oxygen could not only be assigned to each of the beforehand mentioned compounds, but can be as well related with zincite formation. Despite the absence of a typical morphological feature for this common Zn-derived product, its participation in the built-up of the corrosion layers has been suggested (Fig. 2).
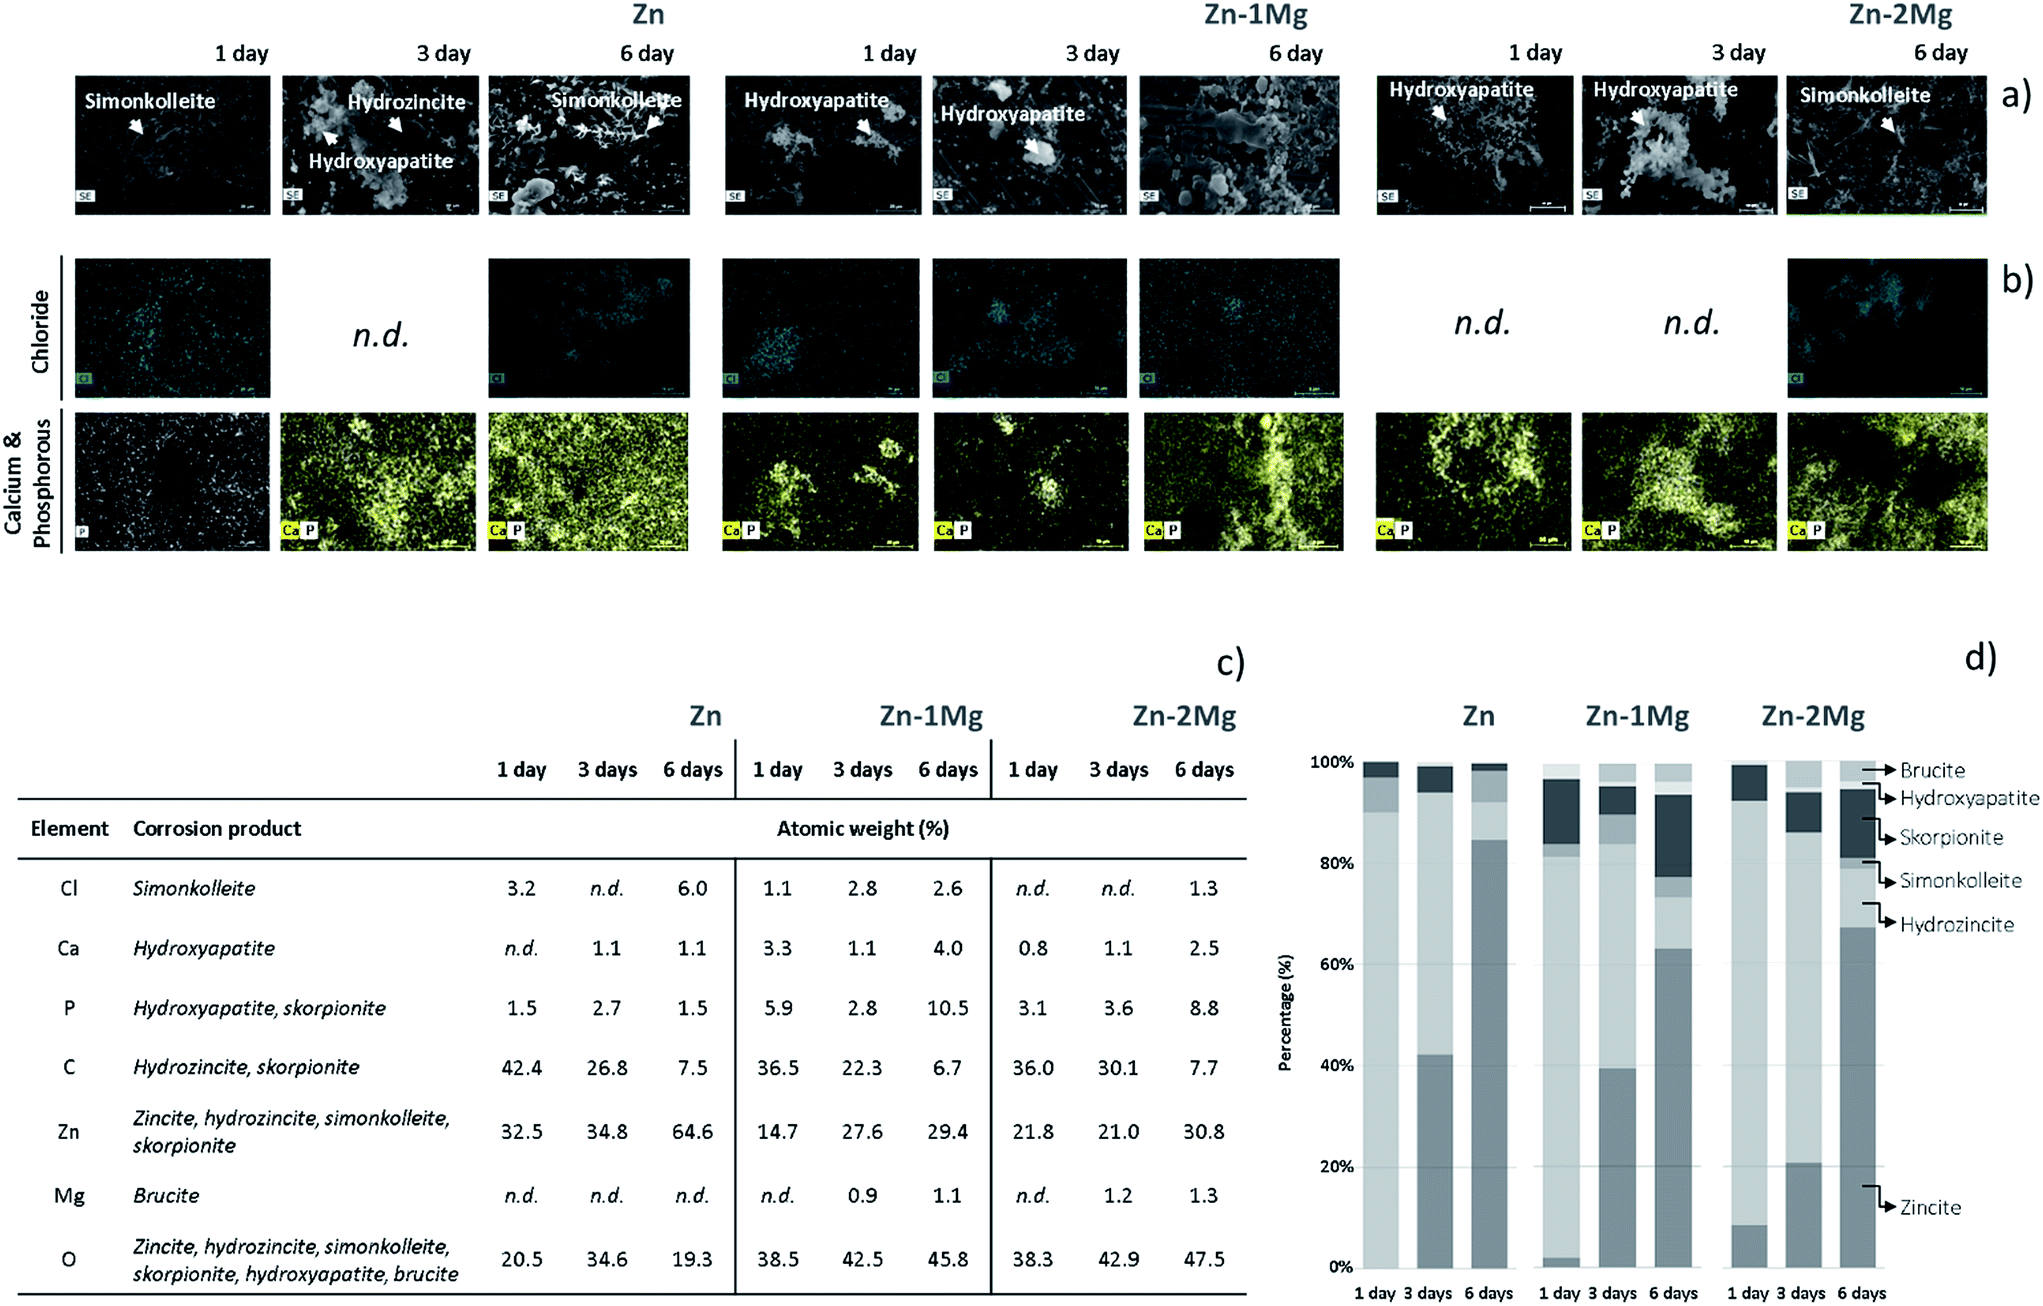 | ||
| Fig. 3 Micrographs (a), X-ray energy dispersive spectrometer (EDS) mapping (b) and chemical atomic elements percentage (c) in association with the compounds (d) present on the corroded surfaces of Zn, Zn–1Mg and Zn–2Mg up to six days of immersion in simulated body fluid (SBF) solution at 37 °C; n.d., non-detected. | ||
The integrated overview of the products that compose the corrosion layer (Fig. 1 and 2), morphological and EDS analyses (Fig. 3) revealed the evolving nature of the corrosion layers under simulated physiological conditions. Similarly, this dynamic nature has been already discussed by Prosek et al.43 when these alloys were exposed to simulated atmospheric conditions. In an attempt to simulate the evolution of the in vitro built-up of the studied corrosion layers, the percentage of each chemical element was related with its stoichiometric participation on the corrosion products detected. As depicted in Fig. 3c and d, simonkolleite percentage was determined through the chloride percentage and that of brucite from the magnesium content. An approximation was made for hydroxyapatite, which was calculated based on the total calcium content. The remaining compounds compositions were derived from the previous ones. The skorpionite content was determined after subtracting calcium from the phosphorous content. In turn, hydrozincite content was calculated after deducting skorpionite content from carbon. Finally, zinc was used to calculate zincite content after subtracting all the previous Zn-containing compounds. As depicted in Fig. 3 the corrosion layers predominantly formed by hydrozincite and zincite are in agreement with the previous findings of Volovitch et al.32 Consistent decrease in a hydrozincite content accompanied by an increase amount of zincite is a well described phenomenon (eqn (3)):32
| Zn5(CO3)2(OH)6 + 2OH− → 5ZnO + 2HCO32− + 3H2O | (3) |
However, it needs to be considered that these corrosion products are represented by two of the most erroneous compounds in EDS, carbon and oxygen.
Simonkolleite showed specific evolving patterns according to the corroding substrate. On Zn, simonkolleite was present one day after immersion, disappeared during next two days and reappeared later on. A distinct behaviour was observed on the corroded surface of Zn–1Mg, where the simonkolleite content dropped from day three till day six. On the surface of Zn–2Mg, the presence of simonkolleite was observed only six days after immersion (Fig. 3). Simonkolleite presented a delayed evolution with an increasing Mg content, a result corroborated by Volovitch et al.32 when testing these alloys in simulated atmospheric conditions. Brucite was only detected on the Zn–Mg alloy surfaces three days after immersion. The relatively high content of Mg (1.5 mM) in the SBF solution,31 together with the absence of Mg-derived compounds on the corroded Zn surface, suggested that brucite formation was modulated by the Mg released from the alloys surface. This fact together with the SBF buffering ability indicated that an altered local pH, rather than the simple presence of dissolved Mg, was controlling the formation of this compound typically stable at high pH values. Different authors had already suggested that Mg dissolution from Zn–Mg alloys could modulate local pH further influencing the nature of the corrosion products formed.35,44 This will not only constrain the formation of Mg-derived products but may also be affecting the formation of the Zn-derived products that were building-up the different corrosion layers. Indeed, prior to brucite detection, magnesium could be acting as a buffering agent towards the reaction with hydroxyl ions (eqn (4)):
| Mg2+ + 2OH− → Mg(OH)2 | (4) |
Along this initial stage the consumption of hydroxyl ions may have inhibited the interconversion of hydrozincite into zincite (eqn (3));43,45 however, in a later stage, the complete consumption of the dissolved magnesium ions (eqn (4)) may have resulted in the loss of this buffering ability which can be associated to an increased pH at the cathodic sites.32 This hypothesis was supported by the brucite detection being coincident with a sharp interconversion observed for hydrozincite into zincite on Zn–Mg alloys (Fig. 3).
Overall the built-up of distinct corrosion layers is related with the specific degradation behaviour of these Zn-derived materials.
3.3. In vitro degradation behaviour
To understand the corrosion progress of Zn and Zn–Mg alloys, a detailed analysis of the impedance responses was performed. Fig. 4a) depicts the Nyquist plots that revealed distinct evolutions for these materials, indicating that different corrosion processes were occurring under these simulated physiological conditions.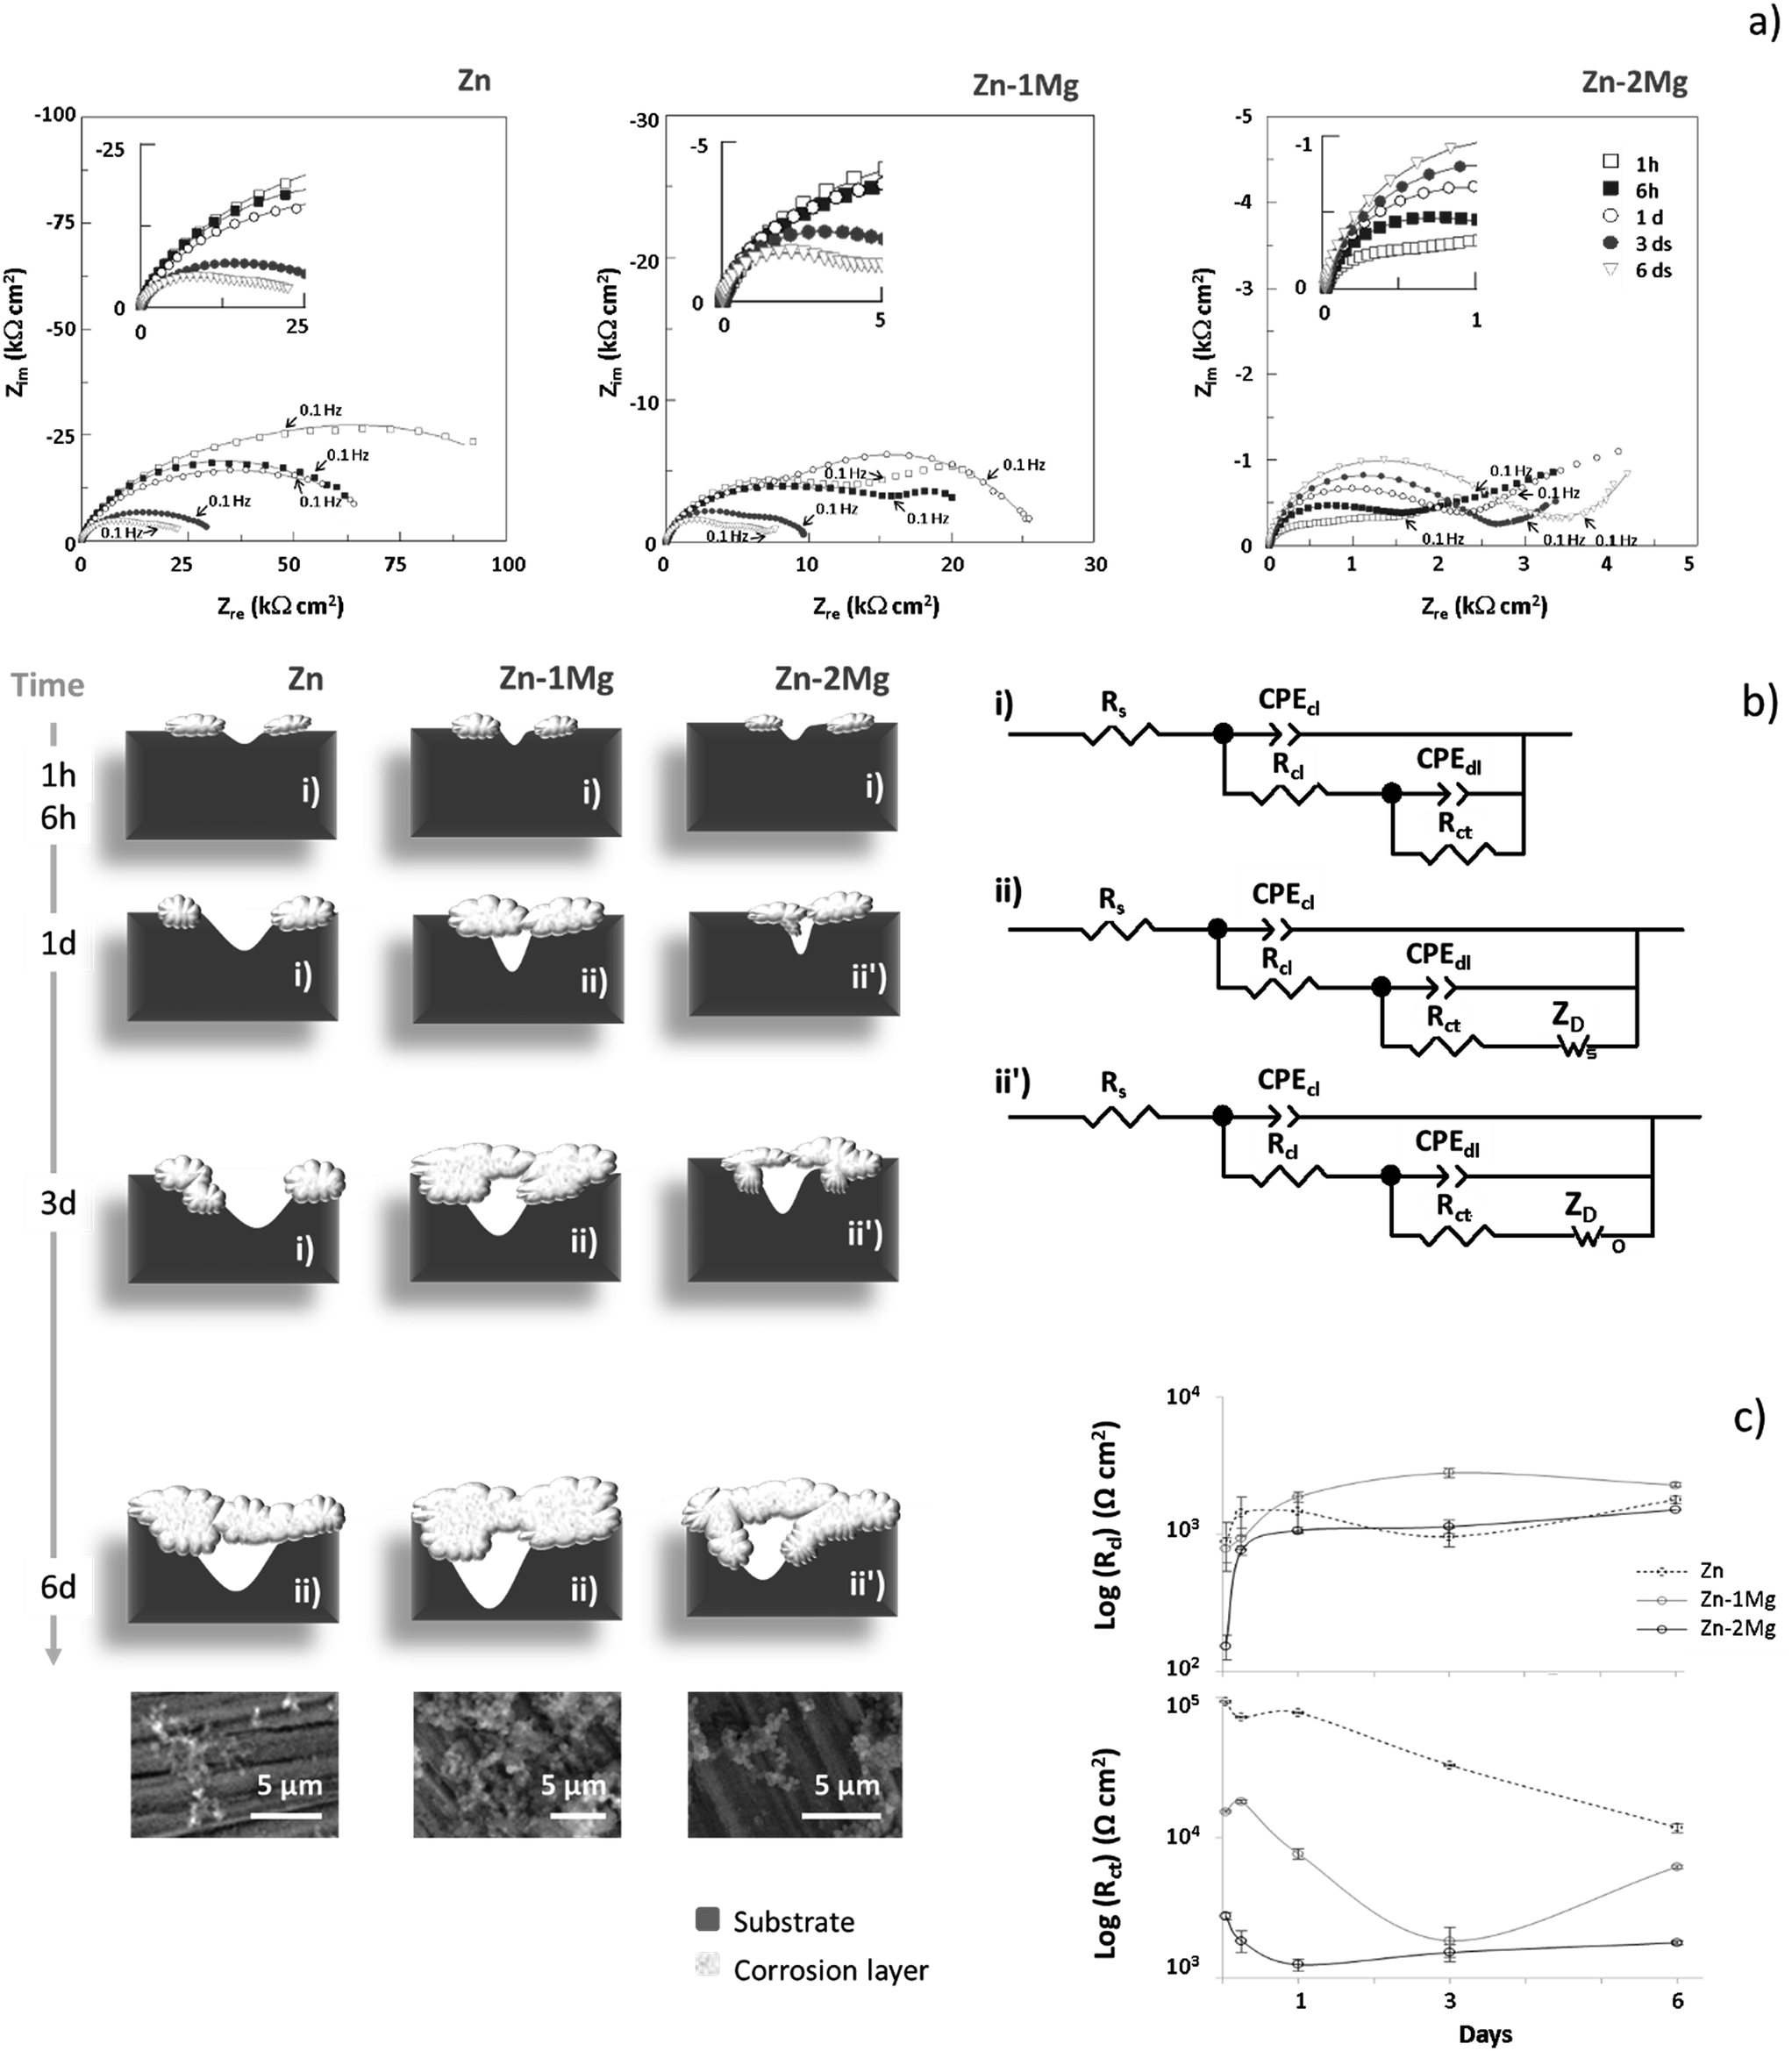 | ||
| Fig. 4 Nyquist (a) plots of Zn, Zn–1Mg and Zn–2Mg under simulated physiological conditions where continuous lines represent EIS data fitting; equivalent circuits (ECs) used to fit the EIS data and schematic representation of the corrosion evolution (b) where SEM images of the corroded surfaces six days after immersion are provided, and corresponding resistances evolution (c) with bars representing the associated errors (Table 3); cl, corrosion layer; dl, double layer; ct, charge transfer and D, diffusion. | ||
The EIS plots for Zn and Zn–1Mg showed the presence of two overlapped conductive loops, one at high-medium frequencies and another at low frequencies, while for Zn–2Mg a tailed shaped curve developed in the low frequency range. However, in some cases an additional time constant was observed. The time constant observed at higher frequencies could be assigned to the built-up of the corrosion products layer, and in the medium frequencies range to the double layer capacitance and charge transfer resistance. At lower frequencies range the time constant could be assigned to mass transport-controlled events. This interpretation agreed with that proposed by Dambatta et al.17 that reported two time constants assigned to double layer and Warburg type events for Zn–3Mg immersed in SBF solution. The time constant assigned to the built-up of a corrosion layer was not sufficiently defined, probably due to the short immersion time used in that study.17
To further detail the undergoing corrosion events the EIS data was fitted with two equivalent circuits (EC) as depicted in Fig. 4b. In the earlier immersion, an EC composed by a resistive element representing the electrolyte solution resistance (Rs) connected in series with two parallel combinations of constant phase elements (CPE) and resistors (R) was considered (Fig. 4bi), while for later immersion times, depending on the system, a Warburg element [short (Fig. 4bii) or open (Fig. 4bii′)] was additionally proposed. As presented in Table 3, chi-squared (χ2) values in the order of 10−4 to 10−5 supported the good fit obtained with the suggested EC models. The building-up of a corrosion layer (cl), described by CPEcl/Rcl, showed a constant phase element with a near ideal capacitor behaviour (n ≅ 0.9), suggesting that a protective layer was formed. At the beginning of immersion the corrosion layer resistance (Rcl) increased for all studied materials; thereafter, it kept constant for the alloys, being smaller for Zn–2Mg than for Zn–1Mg, while for Zn this resistance decreased for three days after immersion recovering upon the sixth day (Fig. 4c). The different resistance values and respective evolutions corroborated the distinct protectiveness of the corrosion layers (Fig. 4 and Table 3). By determining the electrolyte uptake towards the metal surface, these distinct built-up layers will affect other upcoming corrosion events. The CPEdl admittances within the range of 10−4 to 10−6 Ω−1 cm−2 sn, were typical of double layer (dl) capacitances and assigned to an exposed metal surface activity. An initially higher resistance (Rct) observed for Zn suggested a decreased corrosion activity, whereas the lowest resistance values observed for Zn–2Mg suggested a more active interfacial process; an in-between Rct behaviour for Zn–1Mg indicated that this alloys was less prone to corrode than Zn–2Mg. In earlier stages of immersion, Rct evolution was similar and a decreasing trend was observed for all the samples, a behaviour that suggests that an active corrosion is ongoing. However, for longer immersion times, distinct evolutions were observed; while it kept decreasing for Zn, a slight increase was observed one day after immersion for Zn–2Mg and a pronounced increase after three days for Zn–1Mg (Fig. 4c). This increasing trend observed for the alloys indicated that the corrosion process was hindered by the built-up of protective corrosion layers (Fig. 3). This in turn may hinder the transport of charged species. Indeed, a time constant, assigned to mass-controlled processes (ZD), was revealed six days after immersion for Zn and one day after for Zn–Mg alloys (Fig. 4 and Table 3). A short-circuit Warburg element (Ws) was assigned to Zn and Zn–1Mg while an open-circuit Warburg element (Wo) was assigned to Zn–2Mg. This suggested once again that distinct corrosion layers were built-up with a more protective one being formed on Zn–2Mg surface than on both Zn and Zn–1Mg.
| Material | Parameter | Units | 1 hour | 6 hours | 1 day | 3 days | 6 days |
|---|---|---|---|---|---|---|---|
| Zn | χ2 | 2.95 × 10⁻⁴ | 1.95 × 10⁻⁴ | 1.13 × 10⁻⁴ | 1.35 × 10⁻⁴ | 2.02 × 10⁻⁵ | |
| Rs | (Ω cm2) | 31.8 | 30.1 | 30.39 | 17.71 | 27.07 | |
| CPEcl | (Ω−1 cm−2 sn) | 2.5 × 10⁻⁶ | 1.5 × 10⁻⁷ | 1.38 × 10⁻⁶ | 1.26 × 10⁻⁶ | 1.31 × 10⁻⁶ | |
| ncl | 0.918 | 0.936 | 0.938 | 0.943 | 0.930 | ||
| Rct | (Ω cm2) | 877 | 1418 | 1454 | 958 | 1773 | |
| CPEdl | (Ω−1 cm−2 sn) | 1.14 × 10⁻⁵ | 7.80 × 10⁻⁶ | 1.12 × 10⁻⁵ | 1.92 × 10⁻⁵ | 1.09 × 10⁻⁵ | |
| ndl | 0.537 | 0.520 | 0.457 | 0.451 | 0.54 | ||
| Rct | (Ω cm2) | 93![[thin space (1/6-em)]](https://www.rsc.org/images/entities/char_2009.gif) 013 013 |
72103 |
77507 |
32769 |
11745 |
|
| RD | (Ω cm2 s−1) | 13459 |
|||||
| TD | (s) | 26 | |||||
| P | 0.25 | ||||||
| Zn–1Mg | χ2 | 1.66 × 10⁻⁴ | 3.94 × 10⁻⁵ | 4.26 × 10⁻⁵ | 5.14 × 10⁻⁵ | 2.02 × 10⁻⁴ | |
| Rs | (Ω cm2) | 32.1 | 30.13 | 20.32 | 25.40 | 13.98 | |
| CPEcl | (Ω−1 cm−2 sn) | 2.9 × 10⁻⁶ | 1.09 × 10⁻⁶ | 7.3 × 10⁻⁷ | 6.8 × 10⁻⁷ | 6.2 × 10⁻⁷ | |
| ncl | 0.882 | 0.919 | 0.929 | 0.918 | 0.920 | ||
| Rct | (Ω cm2) | 781 | 936 | 1866 | 2789 | 2277 | |
| CPEdl | (Ω−1 cm−2 sn) | 1.45 × 10⁻⁵ | 1.92 × 10⁻⁵ | 8.5 × 10⁻⁶ | 3 × 10⁻⁶ | 7.7 × 10⁻⁵ | |
| ndl | 0.546 | 0.431 | 0.52 | 0.74 | 0.36 | ||
| Rct | (Ω cm2) | 15310 |
18045 |
7676 | 1842 | 6205 | |
| RD | (Ω cm2 s−1) | 17045 |
5472 | 4851 | |||
| TD | (s) | 0.77 | 0.54 | 130 | |||
| P | 0.39 | 0.318 | 0.90 | ||||
| Zn–2Mg | χ2 | 1.43 × 10⁻⁴ | 1.40 × 10⁻⁴ | 6.37 × 10⁻⁵ | 1.11 × 10⁻⁴ | 1.10 × 10⁻⁴ | |
| Rs | (Ω cm2) | 26.95 | 25.69 | 25.78 | 24.02 | 15.10 | |
| CPEcl | (Ω−1 cm−2 sn) | 3.1 × 10⁻⁶ | 2.13 × 10⁻⁶ | 1.40 × 10⁻⁶ | 9.9 × 10⁻⁷ | 7.80 × 10⁻⁷ | |
| ncl | 0.889 | 0.889 | 0.912 | 0.913 | 0.9188 | ||
| Rct | (Ω cm2) | 153 | 758 | 1063 | 1134 | 1500 | |
| CPEdl | (Ω−1 cm−2 sn) | 3.69 × 10⁻⁴ | 1.8 × 10⁻⁴ | 5.0 × 10⁻⁵ | 4.2 × 10⁻⁵ | 4.4 × 10⁻⁵ | |
| ndl | 0.30 | 0.42 | 0.54 | 0.46 | 0.46 | ||
| Rct | (Ω cm2) | 2756 | 1840 | 1244 | 1519 | 1783 | |
| RD | (Ω cm2 s−1) | 2250 | 1690 | 1874 | |||
| TD | (s) | 11 | 86 | 49 | |||
| P | 0.44 | 0.340 | 0.34 |
To further understand the initial corrosion onset of these resorbable materials, other electrochemical measurements were carried out. Fig. 5a and b depicts the OCP and the low frequency impedance modulus (|Z|) evolutions of Zn and Zn–Mg alloys up to six day of immersion in SBF solution, respectively. A few seconds after samples immersion, the lowest OCP was observed for Zn–1Mg (−1.067 V) followed by Zn (−1.060 V) and Zn–2Mg (−0.987 V). This tendency was reverted one hour after immersion, when the lowest OCP value was observed for Zn–2Mg (−1.072 V), followed by Zn–1Mg (−1.063 V) and Zn (−1.020 V). From there on, the OCP of Zn and Zn–Mg alloys reached similar and stable values (Fig. 5a). In a similar manner, |Z| evolution revealed that important electrochemical changes were happening during the earlier stages of immersion. The highest initial corrosion resistance value, and also the most intense drop in |Z|, was observed for pure Zn and occurred one hour after immersion. A lower initial |Z| was observed for Zn–1Mg with a small drop being observed at the early stages of immersion. On the other hand, Zn–2Mg showed the lowest initial |Z| with a slight increasing tendency from the early beginning of immersion. Thereafter, |Z| values were kept relatively stable for all the studied samples (Fig. 5b). From this stability one can conclude that electrolyte renewal caused no significant electrochemical alterations on both the OCP and |Z| evolutions from the third to the fourth day of immersion. These findings were further corroborated by the identical EIS spectra obtained before and after SBF renewal [from the third (Fig. 4a) to the fourth day (data not shown) of immersion] and by stable pH values in the bulk solution (7.5 ± 0.1) observed along the time. Our results contrast with the report of Ascencio et al.29 on WE43 Mg alloy, where SBF renewal affected the in vitro corrosion progression by partially dissolving the corrosion layer. These observations show the specificity of each metallic system with the homeostasis effect provided by the SBF solution renewal causing insignificant electrochemical alterations on these Zn-derived materials. Overall the initial corrosion events seemed to have a much more preponderant role on the built-up of distinct corrosion layers than electrolyte renewal afterwards. The corrosion resistance of these materials was studied further by d.c. potentiodynamic measurements. As depicted in Fig. 5c and d the material presenting the highest corrosion rate was Zn–1Mg followed by Zn and then Zn–2Mg. The anodic branch evidenced some differences and corroborates that the Zn–2Mg alloy displays lower anodic current densities, which is in line with the fact that a more protective layer is being formed on this alloy compared to Zn–1Mg (Fig. 4). These distinct corrosion onsets can be associated to the contrasting solid phases distributions observed for pure Zn and Zn–Mg. As depicted in Fig. 5e, the different distributions of Zn dendrites and Zn plus Mg2Zn11 eutectic in interdendritic areas, as described elsewhere,30 observed for Zn–1Mg and Zn–2Mg contrast with the unique Zn phase on pure Zn.
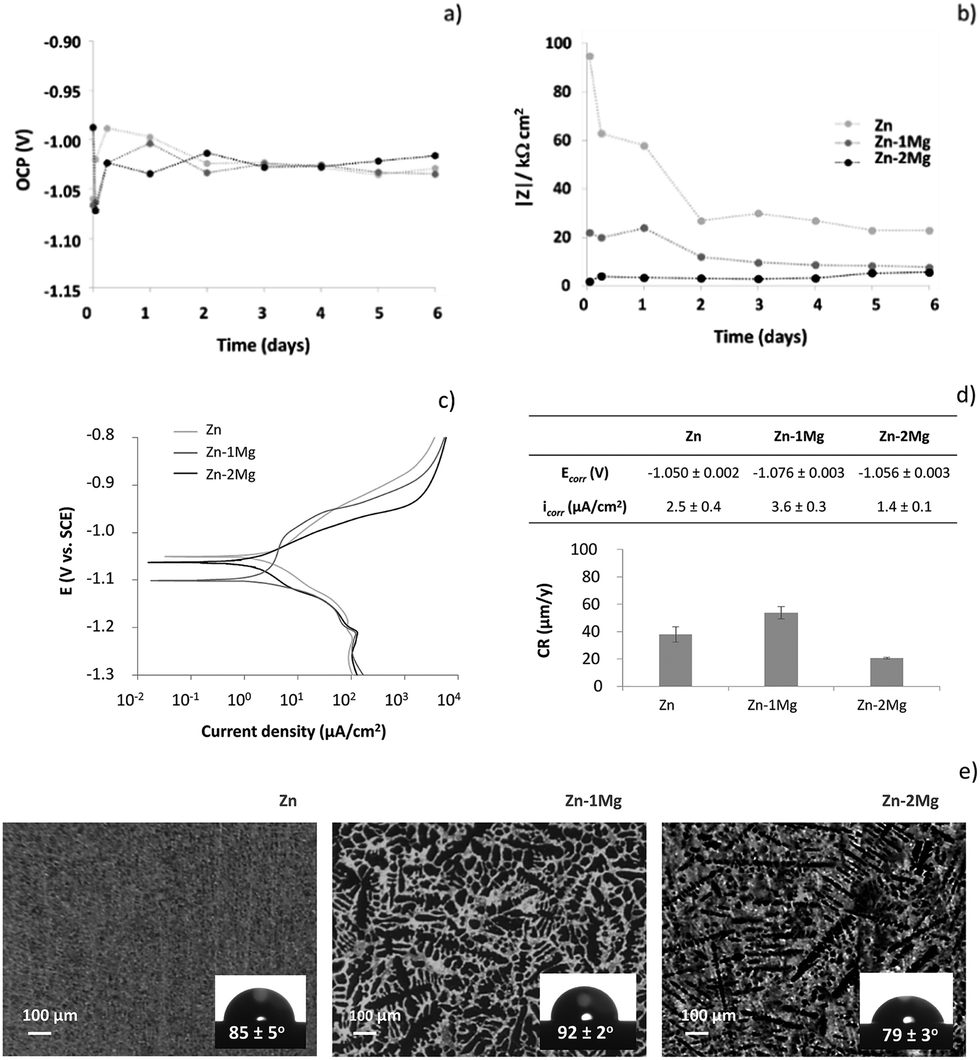 | ||
| Fig. 5 Open circuit potential (OCP) vs. SCE (a), low frequency impedance modulus (|Z|) (10−2 Hz) (b), potentiodynamic curves (c) and corresponding corrosion parameters (d) of Zn and Zn–Mg alloys immersed in simulated body fluid (SBF) solution at 37 °C; micrographs of the microstructure and respective contact angles with the SBF solution at 37 °C (e) of Zn, Zn–1Mg and Zn–2Mg (Zn dendrites, lighter areas; Zn plus Mg2Zn11 eutectic, darker areas.30 | ||
A more uniform distribution of Zn plus Mg2Zn11 interdendrites can be observed on Zn–2Mg surface, when compared to Zn–1Mg. This will result in the formation of distinct microgalvanic cells, with the Mg-rich phases acting as local anodes and Zn matrix as cathodes, as already described by Mostaed et al.26 In this sense, one can hypothesize that a higher number of microgalvanic cells attained on Zn–2Mg may justify a higher corrosion activity detected on this alloy (Fig. 4 and 5). The distinct solid phases distribution can influence other properties important for the corrosion onset, namely the electrolyte contact angle. The insets of Fig. 5c revealed that the contact angle of the SBF solution with these materials were slightly different: the highest contact angle was observed for Zn–1Mg (92 ± 2°) and the lowest for Zn–2Mg (79 ± 3°), resulting in a statistical significant difference of 13° between the alloys; Zn presented an in-between contact angle of 85 ± 5° consistent with the previously reported water contact angle for pure Zn.41 The higher hydrophilicity of Zn–2Mg and more uniform distribution of the galvanic couples supported once again the lowest corrosion resistance for this alloy.
While it is clear that the initial corrosion onset was dependent upon properties of bare substrates (Fig. 5), later on the different corrosion trends can be also assigned to distinct compositional evolutions of the built-up corrosion layers (Fig. 3): the higher corrosion rate of Zn is consistent with a decreased hydrozincite content being accompanied by a sharp increase of zincite, a semi-conductor that may by itself catalyse oxygen reduction favouring the corrosion progression.34 Simonkolleite, with the insulating nature being consistent with the variation of Rcl cannot explain the corrosion layer protectiveness achieved for the alloys. Brucite was referred to increase the resistance of Zn–Mg alloys rather than simonkolleite.30,44 The distinct protectiveness attained by the alloys may be caused by specific brucite distributions. The larger number of smaller non-interconnecting dendrites on Zn–2Mg (Fig. 5e) might result in a more uniform distribution of brucite compared to Zn–1Mg. This hypothesis is in line with the previous report of Elvins et al.46 where a larger number of smaller non-interconnecting dendrites had a positive effect on the corrosion resistance of Zn–Al alloys.
In this study, a lower corrosion resistance of Zn–Mg alloys compared to Zn was observed (Fig. 4 and 5). Opposite results have been previously reported.30,35,44,47 This discrepancy may be indirectly related to brucite formation. As recently suggested by Prosek et al.,48 the Zn–Mg phase stability depends upon the electrolyte volumes. A thin electrolyte film formed in humid atmosphere can be easily enriched in magnesium ions in contrary to bulk solutions used in this study. This enrichment will impact the corrosion layer built-up by allowing for more efficient electrolyte buffering and brucite precipitation resulting in a higher corrosion resistance of Zn–Mg alloys.
Therefore, the evolving nature of the corrosion layer reported in this, and in Prosek et al. work,43 is of utmost importance to determine the application of Zn–Mg alloys. Under atmospheric conditions, when automobile coatings are envisaged, Zn–Mg alloys seemed effective for steel corrosion protection;30,35,44,47 however a decreased corrosion resistance obtained under immersion conditions appeared appropriate for resorbable materials towards clinical bone-healing applications.
4. Conclusions
Small magnesium additions to zinc were enough to produce distinct in vitro corrosion patterns during six days of immersion in SBF solution, with the interdendritic distribution of the solid phases having a preponderant influence on the corrosion onset of Zn–Mg alloys. Initially a higher corrosion activity associated to the presence of Mg was followed by the built-up of distinct protective corrosion layers affecting the degradation behaviour thereafter. The dynamic nature of the corrosion products composition, in which Mg participated mainly as brucite, seemed to result from the local pH modulation. This, by additionally influencing the formation of the other corrosion products, contributed for the different precipitation of calcium phosphate-derived products, skorpionite and a hydroxyapatite. While the initial formation of these compounds on Zn–1Mg may be more appropriate for fast healing processes, the progressive and more uniform distribution achieved on Zn–2Mg may be more adequate for delicate wound-healing processes. Overall, the presence of these compounds, which mimic primary bone components are expected to favour the biocompatibility towards a positive osseointegration of Zn–Mg-based implanted biomaterials.Acknowledgements
The author Marta Alves thanks FCT for providing financial support towards SFRH/BPD/76646/2011. The authors also acknowledge FCT support towards UID/QUI/00100/2013. Amir Zomorodian, Darya Snihirova and Laura Córdoba are also acknowledged for their support with the EIS measurements whereas Professors Benilde Saramago and Ana Paula Serro are acknowledged for their contribution with wettability measurements and Professor Luis Santos with Raman.References
- WHO, Global Health and Aging, 2011 Search PubMed.
- L. Tan, X. Yu, P. Wan and K. Yang, J. Mater. Sci. Technol., 2013, 29, 503–513 CAS.
- D. Vojtích, J. Kubásek, J. Capek and I. Pospísilová, Mater. Technol., 2015, 49, 877–882 Search PubMed.
- M. F. Montemor, Surf. Coat. Technol., 2014, 258, 17–37 CrossRef CAS.
- N. Li and Y. Zheng, J. Mater. Sci. Technol., 2013, 29, 489–502 CAS.
- A. A. John, A. P. Subramanian, M. V. Vellayappan, A. Balaji, S. K. Jaganathan, H. Mohandas, T. Paramalinggam, E. Supriyanto and M. Yusof, RSC Adv., 2015, 5, 39232–39244 RSC.
- P. K. Bowen, J. Drelich and J. Goldman, Adv. Mater., 2013, 25, 2577–2582 CrossRef CAS PubMed.
- X. Liu, J. Sun, Y. Yang, Z. Pu and Y. Zheng, Mater. Lett., 2015, 161, 53–56 CrossRef CAS.
- N. W. Solomons, Ann. Nutr. Metab., 2013, 62, 8–17 CrossRef CAS PubMed.
- R. D. Lindeman, in Handbook of Clinical Nutrition and Aging, ed. C. W. Bales and C. S. Ritchie, Humana Press, NY, 2009, pp. 137–156 Search PubMed.
- C. Wang, H. T. Yang, X. Li and Y. F. Zheng, J. Mater. Sci. Technol., 2016, 32, 909–918 Search PubMed.
- D. Vojtech, J. Kubásek, J. Serák and P. Novák, Acta Biomater., 2011, 7, 3515–3522 CrossRef CAS PubMed.
- C. Wang, Z. Yu, Y. Cui, Y. Zhang, S. Yu, G. Qu and H. Gong, J. Mater. Sci. Technol., 2016, 32, 925–929 Search PubMed.
- J. H. F. de Baaij, J. G. J. Hoenderop and R. J. M. Bindels, Physiol. Rev., 2015, 95, 1–46 CrossRef PubMed.
- X. Liu, J. Sun, K. Qiu, Y. Yang, Z. Pu, L. Li and Y. Zheng, Mater. Lett., 2015, 161, 53–56 CrossRef CAS.
- R. Krieg, A. Vimalanandan and M. Rohwerder, J. Electrochem. Soc., 2014, 161, C156–C161 CrossRef CAS.
- M. Dambatta, N. Murni, S. Izman, D. Kurniawan, G. Froemming and H. Hermawan, Proc. Inst. Mech. Eng., Part H, 2015, 229, 335–342 CrossRef CAS PubMed.
- H. Gong, K. Wang, R. Strich and J. G. Zhou, J. Biomed. Mater. Res., Part B, 2015, 103, 1632–1640 CrossRef CAS PubMed.
- N. S. Murni, M. S. Dambatta, S. K. Yeap, G. R. A. Froemming and H. Hermawan, Mater. Sci. Eng., C, 2015, 49, 560–566 CrossRef CAS PubMed.
- J. Kubásek, D. Vojtech, E. Jablonská, I. Pospísilová, J. Lipov and T. Ruml, Mater. Sci. Eng., C, 2016, 58, 24–35 CrossRef PubMed.
- H. F. Li, X. H. Xie, Y. F. Zheng, Y. Cong, F. Y. Zhou, K. J. Qiu, X. Wang, S. H. Chen, L. Huang, L. Tian and L. Qin, Sci. Rep., 2015, 5, 10719 CrossRef CAS PubMed.
- J. Cheng, B. Liu, Y. H. Wu and Y. F. Zheng, J. Mater. Sci. Technol., 2013, 29, 619–627 CAS.
- J. Kubasek and D. Vojtech, 21st International Conference on Metallurgy and Materials (Metal 2012), 2012, pp. 1355–1361 Search PubMed.
- A. H. M. Sanchez, B. J. C. Luthringer, F. Feyerabend and R. Willumeit, Acta Biomater., 2015, 13, 16–31 CrossRef CAS PubMed.
- D. Vojtích, J. Kubásek, J. Capek and I. Pospísilová, Mater. Technol., 2015, 49, 877–882 Search PubMed.
- E. Mostaed, M. Sikora-Jasinska, A. Mostaed, S. Loffredo, A. G. Demir, B. Previtali, D. Mantovani, R. Beanland and M. Vedani, J. Mech. Behav. Biomed. Mater., 2016, 60, 581–602 CrossRef CAS PubMed.
- M. S. Dambatta, S. Izman, D. Kurniawan, S. Farahany, B. Yahaya and H. Hermawan, Mater. Des., 2015, 85, 431–437 CrossRef CAS.
- P. Roach, D. Eglin, K. Rohde and C. C. Perry, J. Mater. Sci.: Mater. Med., 2007, 18, 1263–1277 CrossRef CAS PubMed.
- M. Ascencio, M. Pekguleryuz and S. Omanovic, Corros. Sci., 2015, 91, 297–310 CrossRef CAS.
- T. Prosek, A. Nazarov, U. Bexell, D. Thierry and J. Serak, Corros. Sci., 2008, 50, 2216–2231 CrossRef CAS.
- T. Kokubo and H. Takadama, Biomaterials, 2006, 27, 2907–2915 CrossRef CAS PubMed.
- P. Volovitch, C. Allely and K. Ogle, Corros. Sci., 2009, 51, 1251–1262 CrossRef CAS.
- I. Puigdomenech, Medusa software, KTH, Stockholm, 2015, http://https://www.kth.se/en/che/medusa/downloads-1.386254 Search PubMed.
- A. Nazarov, E. Diler, D. Persson and D. Thierry, J. Electroanal. Chem., 2015, 737, 129–140 CrossRef CAS.
- N. C. Hosking, M. A. Strom, P. H. Shipway and C. D. Rudd, Corros. Sci., 2007, 49, 3669–3695 CrossRef CAS.
- C. Z. Yao, Z. C. Wang, S. L. Tay, T. P. Zhu and W. Gao, J. Alloys Compd., 2014, 602, 101–107 CrossRef CAS.
- M. M. Alves, T. Prosek, C. F. Santos and M. F. Montemor, Mater. Sci. Eng., C, 2017, 70(2), 112–120 CrossRef CAS PubMed.
- A. C. Tas, Acta Biomater., 2014, 10, 1771–1792 CrossRef CAS PubMed.
- M. Šćepanović, M. Grujić-Brojčin, K. Vojisavljević, S. Bernik and T. Srećković, J. Raman Spectrosc., 2009, 41, 914–921 CrossRef.
- H. Zeng, W. Cai, B. Cao, J. Hu, Y. Li and P. Liu, Appl. Phys. Lett., 2006, 88, 181905 CrossRef.
- M. M. Alves, C. Santos, M. J. Carmezim and M. F. Montemor, Appl. Surf. Sci., 2015, 332, 152–158 CrossRef CAS.
- D. R. Katti, A. Sharma, A. H. Ambre and K. S. Katti, Mater. Sci. Eng., C, 2015, 46, 207–217 CrossRef CAS PubMed.
- T. Prosek, D. Persson, J. Stoulil and D. Thierry, Corros. Sci., 2014, 86, 231–238 CrossRef CAS.
- E. Diler, S. Rioual, B. Lescop, D. Thierry and B. Rouvellou, Corros. Sci., 2012, 65, 178–186 CrossRef CAS.
- M. Salgueiro Azevedo, C. Allély, K. Ogle and P. Volovitch, Electrochim. Acta, 2015, 153, 159–169 CrossRef CAS.
- J. Elvins, J. A. Spittle, J. H. Sullivan and D. A. Worsley, Corros. Sci., 2008, 50, 1650–1658 CrossRef CAS.
- J. Stoulil, T. Prosek, A. Nazarov, J. Oswald, P. Kriz and D. Thierry, Mater. Corros., 2015, 66, 777–782 CrossRef CAS.
- T. Prosek, J. Hagstrom, D. Persson, N. Fuertes, F. Lindberg, O. Chocholatý, C. Taxen, J. Serak and D. Thierry, Corros. Sci., 2016, 110, 71–81 CrossRef CAS.
| This journal is © The Royal Society of Chemistry 2017 |