 Open Access Article
Creative Commons Attribution 3.0 Unported Licence
Facile preparation of in situ coated Ti3C2Tx/Ni0.5Zn0.5Fe2O4 composites and their electromagnetic performance
Youbing Liab,
Xiaobing Zhou *bc,
Jing Wanga,
Qihuang Dengb,
Mian Lib,
Shiyu Dub,
Young-Hwan Hanc,
Jaehyung Lee*c and
Qing Huang*b
aSchool of Materials Science and Engineering, Anhui University of Science and Technology, Huainan, Anhui 232001, China
bEngineering Laboratory of Specialty Fibers and Nuclear Energy Materials (FiNE), Ningbo Institute of Materials Technology and Engineering, Chinese Academy of Sciences, Ningbo, Zhejiang 315201, China. E-mail: zhouxb@nimte.ac.cn; huangqing@nimte.ac.cn
cSchool of Materials Science and Engineering, Yeungnam University, Gyeongsan, Korea. E-mail: jhlee@ynu.ac.kr
First published on 8th May 2017
Abstract
A novel family of Ti3C2Tx/ferrite composites with high reflection loss was developed using a facile in situ co-precipitation method. The as-synthesized Ti3C2Tx/ferrite composite with a 5 wt% Ti3C2Tx MXenes loading exhibited high reflection loss (−42.5 dB) at 13.5 GHz. The effective absorption bandwidth of the 5 wt% Ti3C2Tx/Ni0.5Zn0.5Fe2O4 composite reached ∼3 GHz (12–15 GHz) in the K-band. The incorporation of Ti3C2Tx MXenes improved the electromagnetic impedance of the Ti3C2Tx/Ni0.5Zn0.5Fe2O4 composite resulting from the enhanced electrical conductivity. The potential electromagnetic wave absorption mechanisms were revealed, which may contain magnetic loss, dielectric loss, conductivity loss, multiple reflections, and scattering. The technique is facile, fast, scalable, and favorable for the commercialization of this composite. This study provides a potential way to develop EM wave absorbing materials for a large family of MXenes/ferrite composites.
1. Introduction
Electromagnetic (EM) radiation pollution is attracting increasing attention because it affects human health and the operation of electronic devices. High-performance electromagnetic interference (EMI) absorbing and shielding materials have attracted growing interest as a way to solve these problems.1–3 Three typical mechanisms are involved in the design of promising EMI absorbing and shielding materials suggested by Shahzad et al.4 The first is to interact with the EM fields by charge carries, which require materials with high electrical conductivity. The secondary mechanism is absorbing EM radiation by the materials electric and/or magnetic dipoles interacting with radiation. The third mechanism is accounting for multiple internal reflections that arise from scattering centers and interfaces or defect sites within the shielding material, resulting in scattering and the absorption of EM waves. Therefore, a hybrid material that combines high electrical conductivity, magnetic loss, and multiple reflections was reported to be a promising candidate for EMI absorbing and shielding.5 Furthermore, the effective absorption of composites was usually defined as reflection loss (RL) <−10 dB, which corresponds to more than 90% EM wave energy absorbed. The corresponding frequency range (RL < −10 dB) is denoted as the effective absorption bandwidth. The reflection loss (RL) values of the composites can be calculated using the transmission line theory:6,7
 | (1) |
 | (2) |
Ni–Zn ferrites have been considered promising candidates as EM absorbers owing to their appropriate permeability and permittivity.5,8,9 On the other hand, Ni–Zn ferrites attenuate the EM wave mainly through magnetic loss and lead to the impedance matching is out of balance.10 Furthermore, the high resistivity and narrow absorption bandwidth have limited their applications as EMI absorbers.11–13 To solve these problems, high electrical conducting one-dimensional (1D) carbon nanotubes (CNTs) and two-dimensional (2D) graphene were introduced to ferrites.14–17 In our previous work,14,15 CNTs were coated in situ with Ni0.5Zn0.5Fe2O4 by a combined precipitation-hydrothermal method. The results showed that when the CNT content was 5 wt%, the reflection ratios were less than −10 dB within the frequency range, 2–9 GHz, and the reflection ratios reached a minimum −32.5 dB at 3.9 GHz. Shen et al.18 developed a novel polyetherimide (PEI)/grapheme@Fe3O4 (G@Fe3O4) composite foams, and when the G@Fe3O4 loading was 10 wt%, the PEI/G@Fe3O4 foam exhibited a high EMI shielding effectiveness of ∼41.5 dB (g−1 cm−3) at 8–12 GHz. They suggested that most of the applied microwave was absorbed rather than reflected, resulting from the improved impedance matching, electromagnetic wave attenuation, and multiple reflections.
MXenes, developed by Naguib et al.,19 are a new family of 2D transition metal carbides and/or nitrides obtained by etching the A layer of MAX phases, where M represents a transition metal, “A” are elements in the group 13–16, “X” represents carbon and/or nitrogen. The exposed transition-metal surfaces are terminated with a mixture groups (Tx), such as –OH, ![[double bond, length as m-dash]](https://www.rsc.org/images/entities/char_e001.gif) O, and –F, after HF etching.20 More than 20 different MXenes have been synthesized.21 MXenes exhibit promising potential applications as Li-ion batteries and supercapacitors owing to their excellent chemical and physical properties.22,23 Recently, Han et al.24 developed 2D Ti3C2Tx (where Tx denotes the surface terminated groups) MXenes for novel EM absorbing applications. The fundamental EM loss mechanisms of Ti3C2Tx before and after annealing were revealed. They suggested that the formation of a localized sandwich structure composed of TiO2 nanocrystals and amorphous carbon without sacrificing the original 2D layer structure improved the microwave absorbing capability. Moreover, Shahzad et al.4 first developed highly flexible MXene films and nacre-like MXene-sodium alginate (SA) composite films for EMI shielding. They reported that a 45 μm thick Ti3C2Tx film exhibited an EMI shielding effectiveness of 92 dB (>50 dB for a 2.5 mm film), which is the highest among synthetic materials of comparable thickness produced to date. The excellent electrical conductivity of Ti3C2Tx films (4600 S cm−1) and multiple internal reflections from Ti3C2Tx flakes in free-standing films were considered the reason for the high EMI shielding effectiveness. Furthermore, they suggested that the surface terminated groups (–OH,
O, and –F, after HF etching.20 More than 20 different MXenes have been synthesized.21 MXenes exhibit promising potential applications as Li-ion batteries and supercapacitors owing to their excellent chemical and physical properties.22,23 Recently, Han et al.24 developed 2D Ti3C2Tx (where Tx denotes the surface terminated groups) MXenes for novel EM absorbing applications. The fundamental EM loss mechanisms of Ti3C2Tx before and after annealing were revealed. They suggested that the formation of a localized sandwich structure composed of TiO2 nanocrystals and amorphous carbon without sacrificing the original 2D layer structure improved the microwave absorbing capability. Moreover, Shahzad et al.4 first developed highly flexible MXene films and nacre-like MXene-sodium alginate (SA) composite films for EMI shielding. They reported that a 45 μm thick Ti3C2Tx film exhibited an EMI shielding effectiveness of 92 dB (>50 dB for a 2.5 mm film), which is the highest among synthetic materials of comparable thickness produced to date. The excellent electrical conductivity of Ti3C2Tx films (4600 S cm−1) and multiple internal reflections from Ti3C2Tx flakes in free-standing films were considered the reason for the high EMI shielding effectiveness. Furthermore, they suggested that the surface terminated groups (–OH, ![[double bond, length as m-dash]](https://www.rsc.org/images/entities/char_e001.gif) O, and –F,) play a role on the high EMI shielding effectiveness. The ability of each element to interact with input electromagnetic waves leads to polarization losses, which in turn improve the overall shielding.
O, and –F,) play a role on the high EMI shielding effectiveness. The ability of each element to interact with input electromagnetic waves leads to polarization losses, which in turn improve the overall shielding.
Therefore, Ti3C2Tx MXenes are promising candidates as EMI absorbing materials.4,24,25 Moreover, Ti3C2Tx terminated with negative groups (–OH, and –F) can be potentially coated with metal positive ions (such as Ni2+, Zn2+, and Fe2+). Herein, a novel Ti3C2Tx/Ni0.5Zn0.5Fe2O4 composite, which potentially combines three EM wave absorbing mechanisms, was designed and synthesized. A facile chemical co-precipitation approach was developed to ensure that the Ti3C2Tx flakes were coated in situ with Ni0.5Zn0.5Fe2O4 ferrites, and without oxidation and sacrificing the original layer structure. The phase, microstructure, and electromagnetic properties of Ti3C2Tx/Ni0.5Zn0.5Fe2O4 composites were investigated systematically. To the best of the authors' knowledge, this is the first effort to reveal the EM loss mechanisms of Ti3C2Tx/Ni0.5Zn0.5Fe2O4 composites. The combination of Ti3C2Tx MXenes may not only improve the impedance matching characteristics, but also combine the advantages of the individual components. The present work paves the way to develop a large family of MXenes/ferrites composites for EM wave absorbing.
2. Experimental section
2.1 Materials
Elemental powders of TiC (∼200 mesh, 99% purity), Ti (∼200 mesh, 99% purity), and Al (∼300 mesh, 99% purity) were commercially obtained from Target Research Center of General Research Institute for Nonferrous Metals, Beijing, China. Nickel nitrate (Ni(NO3)2·6H2O), zinc nitrate (Zn(NO3)2·6H2O), ferric nitrate (FeSO4·7H2O), sodium hydroxide (NaOH), sodium lignosulfonate (SLS), and hydrofluoric acid (HF) were commercially obtained from Aladdin Chemical Reagent, China.2.2 Preparation and functionalization of Ti3C2Tx MXenes
The Ti3AlC2 (purity of 98.5 wt%, containing a small amount of TiC and Al2O3 impurity phases, 300 mesh) was synthesized by the spark plasma sintering (SPS) of a mixture of Ti, Al, and C in a fixed mole ratio at 1400 °C for 20 min. After cooling to room temperature, the as-prepared Ti3AlC2 bulk samples were pulverized to powders and passed through a 300 mesh screen. The Ti3C2Tx powders were synthesized using the procedure suggested by Naguib et al.19 A 1 g sample of Ti3AlC2 powder was added to a 10 ml of a HF solution (40 wt%) for 72 h at room temperature, the solution was stirred lightly every 12 h. The as-received solution was centrifuged, washed with deionized water and alcohol, and dried at room temperature for 48 h. To improve the dispersion behavior of the Ti3C2Tx powders in water. The obtained Ti3C2Tx powders were functionalized by a disperser of sodium lignin sulfonate (SLS). Typically, 0.1 g Ti3C2Tx powders and 0.05 g SLS were added to 100 ml deionized water, followed by another ultrasonic dispersion process for 45 min. Finally, a modified 1 mg ml−1 Ti3C2Tx dispersion solution was obtained after removing the excessive SLS by filtration and washing.2.3 Preparation of in situ coated Ti3C2Tx/Ni0.5Zn0.5Fe2O4 composites
The desired amount of the Ti3C2Tx dispersion solution was added to a salt solution composed of Ni(NO3)2·6H2O, Zn(NO3)2·6H2O, and FeSO4·7H2O at a molar ratio of Ni![[thin space (1/6-em)]](https://www.rsc.org/images/entities/char_2009.gif) :
:![[thin space (1/6-em)]](https://www.rsc.org/images/entities/char_2009.gif) Zn
Zn![[thin space (1/6-em)]](https://www.rsc.org/images/entities/char_2009.gif) :
:![[thin space (1/6-em)]](https://www.rsc.org/images/entities/char_2009.gif) Fe = 0.5
Fe = 0.5![[thin space (1/6-em)]](https://www.rsc.org/images/entities/char_2009.gif) :
:![[thin space (1/6-em)]](https://www.rsc.org/images/entities/char_2009.gif) 0.5
0.5![[thin space (1/6-em)]](https://www.rsc.org/images/entities/char_2009.gif) :
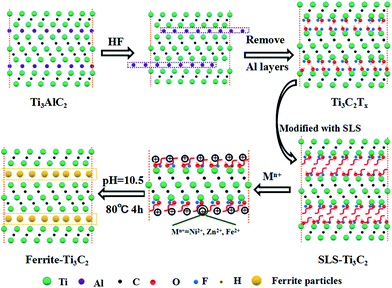
:![[thin space (1/6-em)]](https://www.rsc.org/images/entities/char_2009.gif) 2 according to the stoichiometric ratio of Ni0.5Zn0.5Fe2O4, followed by magnetic stirring and ultrasonic dispersing for 60 min. According to the thermodynamic calculations reported in the literature, the pH needs to be controlled at 10.5 to fabricate the expected ferrite.26 The salt and Ti3C2Tx of the mixed solution and 1 M NaOH solution were added dropwise at a flow rate of 2.5 ml min−1 under continuous stirring with O2 pumped into the reaction solution. After co-precipitation, a Ni, Zn, and Fe precursor slurry formed and then continued to react at 80 °C for 4 h. The finally obtained precipitates were washed 5 times with deionized water and absolute ethanol, dried, ground, and passed through a 200 mesh sieve; the final Ti3C2Tx/Ni0.5Zn0.5Fe2O4 composites were obtained. The schematic presents the facile co-precipitation processing of the Ti3C2/Ni0.5Zn0.5Fe2O4 composites (Fig. 1).
2 according to the stoichiometric ratio of Ni0.5Zn0.5Fe2O4, followed by magnetic stirring and ultrasonic dispersing for 60 min. According to the thermodynamic calculations reported in the literature, the pH needs to be controlled at 10.5 to fabricate the expected ferrite.26 The salt and Ti3C2Tx of the mixed solution and 1 M NaOH solution were added dropwise at a flow rate of 2.5 ml min−1 under continuous stirring with O2 pumped into the reaction solution. After co-precipitation, a Ni, Zn, and Fe precursor slurry formed and then continued to react at 80 °C for 4 h. The finally obtained precipitates were washed 5 times with deionized water and absolute ethanol, dried, ground, and passed through a 200 mesh sieve; the final Ti3C2Tx/Ni0.5Zn0.5Fe2O4 composites were obtained. The schematic presents the facile co-precipitation processing of the Ti3C2/Ni0.5Zn0.5Fe2O4 composites (Fig. 1).
2.4 Characterization
X-ray diffraction (XRD, D8 Advance, Bruker AXS, Germany) was used to analyze the sample phase; the XRD data were collected using Cu Kα radiation at a step size of 0.02°/2θ with a collection time of 1 s per step. Fourier transform infrared (FTIR, Thermo, Nicolet6700, USA) spectroscopy was used to characterize the functional groups on the surface before and after the functionalization of Ti3C2Tx. The microstructure and chemical composition were observed by scanning electron microscopy (SEM, QUANTA 250 FEG, FEI, USA) equipped with an energy dispersive spectroscopy (EDS) system. Transmission electron microscopy (TEM Tecnai F20, FEI, USA) and high-resolution TEM (HRTEM) images were carried out at an acceleration voltage of 200 kV. The specific surface area was measured using the Brunauer–Emmett–Teller (BET)27 method on an ASAP2020 instrument. The electromagnetic property was measured using a physical properties measurement system (PPMS, Quantum Design, USA) at the room temperature hysteresis loop.The permittivity and permeability were measured using a microwave vector network analyser (8722ES, Agilent, USA) in the frequency range of 0.2–18 GHz. The specimens used for the permittivity and permeability property measurements were fabricated by mixing different Ti3C2Tx contents of the Ti3C2Tx/Ni0.5Zn0.5Fe2O4 composites with 20 wt% paraffin. Typically, the composites and paraffin were dispersed in hexane after grinding to avoid aggregation. The mass ratio of paraffin to composite powders is 1![[thin space (1/6-em)]](https://www.rsc.org/images/entities/char_2009.gif) :
:![[thin space (1/6-em)]](https://www.rsc.org/images/entities/char_2009.gif) 4. After the solvent was volatilized, the mixed powders were cold-pressed into the samples with a toroid (outside diameter is 7 mm, inside diameter is 3 mm, and thickness of 2 mm) under a pressure of 5 MPa. After that, the specimens were inserted into a copper holder and connected between the waveguide flanges of the instrument. The complex permittivity and permeability of the samples were calculated from S parameters (S11 and S21) which measured from vector network analyzer using the coaxial-line transmission method.
4. After the solvent was volatilized, the mixed powders were cold-pressed into the samples with a toroid (outside diameter is 7 mm, inside diameter is 3 mm, and thickness of 2 mm) under a pressure of 5 MPa. After that, the specimens were inserted into a copper holder and connected between the waveguide flanges of the instrument. The complex permittivity and permeability of the samples were calculated from S parameters (S11 and S21) which measured from vector network analyzer using the coaxial-line transmission method.
3. Results and discussion
Fig. 2a presents XRD patterns of the as-received Ti3AlC2 powders and after HF etching Ti3C2Tx MXenes. The Ti3AlC2 typical XRD peak of (104) at 39° 2θ disappeared and was replaced with a low intensity broadened peak. This indicates that the Al atomic layers had been exfoliated successfully and the corresponding 2D Ti3C2Tx MXenes had formed after HF etching. At the same time, new XRD peaks for Ti3C2F2 were detected at 8.9° and 18.4° 2θ showing that F was inserted into the Ti3C2Tx MXenes interlayer.28 Furthermore, a new peak at 27.4° 2θ was detected, which was assigned to Ti3C2(OH)2.28 These results suggest that the Ti3C2Tx surfaces were terminated with functional groups of –OH, and –F after HF etching. Fig. 1b and c exhibit SEM images of Ti3AlC2 and as-obtained Ti3C2Tx MXenes after HF etching, respectively. Ti3AlC2 exhibited a typical layered structure, as shown in Fig. 2b. After HF etching, a similar accordions' 2D layered structure was formed by extracting an Al atom from Ti3AlC2 (Fig. 2c). The terminated negative groups of –OH, and –F combined with the 2D layered structure provides potential channels for Ni, Zn, and Fe ion intercalation. Fig. 2d shows a TEM image of the Ti3C2Tx MXenes sheets. The material showed a similar hexagonal symmetry and crystallinity to that of the parent Ti3AlC2 phase, as indicated by the fast Fourier transform (FFT) pattern shown in the inset image in Fig. 2d.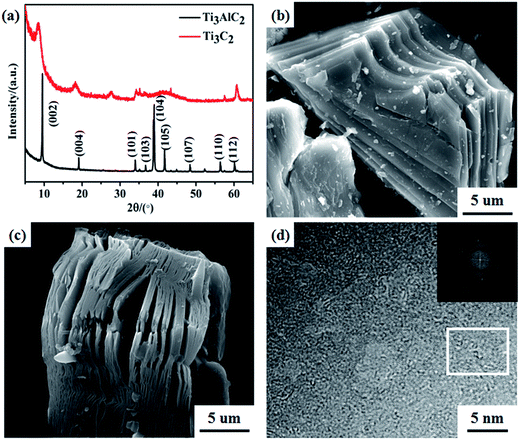 | ||
| Fig. 2 (a) XRD patterns of Ti3AlC2 and Ti3C2Tx MXenes. SEM images of Ti3AlC2 (b) and Ti3C2Tx (c). (d) HRTEM image of Ti3C2Tx sheets, the inset shows the FFT of the white rectangle area. | ||
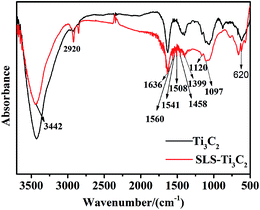
The uniform distribution of Ti3C2Tx MXenes in the matrix of ferrite is a critical issue for Ti3C2Tx/Ni0.5Zn0.5Fe2O4 composites. Although Ti3C2Tx MXenes has good hydrophilicity for the terminated surface groups of –OH, ![[double bond, length as m-dash]](https://www.rsc.org/images/entities/char_e001.gif) O, and –F. To further improve the dispersion behavior of Ti3C2Tx MXenes in water and provide a convenient path for Ni2+, Zn2+, and Fe2+ intercalation, the Ti3C2Tx MXenes were modified with amphiphilic sodium lignin sulfonate (SLS) surfactants. Fig. 3 shows the FTIR spectra of Ti3C2Tx with and without functionalization by SLS. The existence of hydroxyl groups was confirmed by the absorption peaks at 3437 cm−1 and 1636 cm−1, which were assigned to the absorbed external water and strongly hydrogen-bonded OH or extremely strong coordinated H2O in the two samples.29 In addition, the peak at 620 cm−1 was probably due to the deformation vibration of the Ti–O bond;30 the C–F (1097 cm−1) and O–H (1399 cm−1) groups were observed in the spectra of the two samples.31 The –CH2 (2920 cm−1), –C
O, and –F. To further improve the dispersion behavior of Ti3C2Tx MXenes in water and provide a convenient path for Ni2+, Zn2+, and Fe2+ intercalation, the Ti3C2Tx MXenes were modified with amphiphilic sodium lignin sulfonate (SLS) surfactants. Fig. 3 shows the FTIR spectra of Ti3C2Tx with and without functionalization by SLS. The existence of hydroxyl groups was confirmed by the absorption peaks at 3437 cm−1 and 1636 cm−1, which were assigned to the absorbed external water and strongly hydrogen-bonded OH or extremely strong coordinated H2O in the two samples.29 In addition, the peak at 620 cm−1 was probably due to the deformation vibration of the Ti–O bond;30 the C–F (1097 cm−1) and O–H (1399 cm−1) groups were observed in the spectra of the two samples.31 The –CH2 (2920 cm−1), –C![[double bond, length as m-dash]](https://www.rsc.org/images/entities/char_e001.gif) C–(1560 cm−1), aromatic ring (1508 cm−1), C–H (1458 cm−1) group, and C–O (1120 cm−1) were present in the spectra of SLS–Ti3C2.14,32 Lignin sulfonic is an amphoteric hydrophilic polymer surfactant with both carbon chains, phenolic hydroxyl hydrophobic group and hydrophilic group of sulfonic acid. Under the effect of van der Waals forces and steric hindrance effects, the hydrophobic group improved the dispersion of Ti3C2Tx MXenes in water, and the hydrophilic group stretched in the aqueous solution and provided a nucleation channel for the in situ coated and intercalated NiZn ferrite.
C–(1560 cm−1), aromatic ring (1508 cm−1), C–H (1458 cm−1) group, and C–O (1120 cm−1) were present in the spectra of SLS–Ti3C2.14,32 Lignin sulfonic is an amphoteric hydrophilic polymer surfactant with both carbon chains, phenolic hydroxyl hydrophobic group and hydrophilic group of sulfonic acid. Under the effect of van der Waals forces and steric hindrance effects, the hydrophobic group improved the dispersion of Ti3C2Tx MXenes in water, and the hydrophilic group stretched in the aqueous solution and provided a nucleation channel for the in situ coated and intercalated NiZn ferrite.
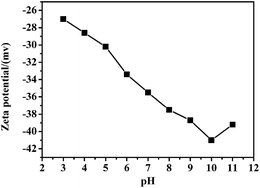
The dispersion behavior of Ti3C2Tx MXenes after modification by SLS was examined. Fig. 4 shows the zeta potential of Ti3C2Tx MXenes after surface functionalization in the pH range of 4–11. The pH was tuned by diluted sodium hydroxide and nitric acid. Over the entire pH range, the zeta potential decreased with increasing pH (slight fluctuations were observed at pH = 9 and 11 for the measurement error). The zeta potential in the entire measured pH range was lower than −25 mV, which is the standard surface potential value of a stable dispersion colloidal solution. The zeta potential reached approximately −40 mV at the Ni2+, Zn2+, and Fe2+ co-precipitation pH of 10.5 ± 0.1.15 Therefore, after functionalization by SLS, a large number of negative charges were modified on the surface of Ti3C2Tx MXenes. The aggregation of Ti3C2Tx MXenes can be prevented by coulomb repulsion and steric-hindrance. On the other hand, the large number of negative charges would absorb Ni2+, Zn2+, and Fe2+, which is a benefit to the NiZn ferrite in situ coated Ti3C2Tx MXenes surface and intercalated into the Ti3C2Tx MXenes interlayer. Furthermore, the local dipole polarization may be induced between the surface functional groups and Ti3C2 when subjected to an alternating EM field.4
The chemical co-precipitation process is a facile scale approach to the synthesis of NiZn ferrite. After modification by SLS, Ti3C2Tx were mixed with the salt solution of Ni(NO3)2·6H2O, Zn(NO3)2·6H2O, and FeSO4·7H2O. Ti3C2Tx/Ni0.5Zn0.5Fe2O4 composites with different Ti3C2Tx contents were synthesized by a co-precipitation process at 80 °C for 4 h. Fig. 5 presents the XRD patterns of pure Ni0.5Zn0.5Fe2O4 and Ti3C2Tx/Ni0.5Zn0.5Fe2O4 composites with different Ti3C2Tx contents. All the specimens showed a typical spinel phase and good crystallization. The characteristic XRD peaks at 18.05°, 30.02°, 35.29°, 43.01°, 53.28°, 56.80° and 62.27° 2θ correspond to the (111), (220), (311), (400), (422), (511) and (440) plane of Ni0.5Zn0.5Fe2O4 crystal, respectively. This is consistent with the Joint Committee on Powder Diffraction Standards (JCPDS) card no. 8-234. The typical XRD peaks of Ti3C2Tx MXenes at 8.9° and 18.4° 2θ were not detected, which may due to the low content of Ti3C2Tx MXenes, and/or full coverage of Ni0.5Zn0.5Fe2O4 nanocrystals on the Ti3C2Tx surface. Moreover, no anatase or rutile phases were detected, which indicates that Ti3C2Tx MXenes was not oxidized due to the facile low temperature co-precipitation process. The mean grain sizes of the Ti3C2Tx/Ni0.5Zn0.5Fe2O4 composites with different Ti3C2Tx contents were calculated from the XRD patterns using Scherrer's equation:33
D = kλ/β![[thin space (1/6-em)]](https://www.rsc.org/images/entities/char_2009.gif) cos cos![[thin space (1/6-em)]](https://www.rsc.org/images/entities/char_2009.gif) θ θ
| (3) |
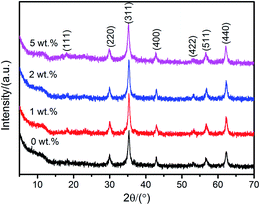 | ||
| Fig. 5 XRD patterns of pure Ni0.5Zn0.5Fe2O4 and Ti3C2Tx/Ni0.5Zn0.5Fe2O4 composites with various Ti3C2Tx contents synthesized at 80 °C for 4 h. | ||
Interestingly, the mean grain size of the Ti3C2Tx/Ni0.5Zn0.5Fe2O4 composites decreased with increasing Ti3C2Tx content. This can be obtained from the NiZn ferrite formation mechanism of the Ti3C2Tx surfaces. There were three steps as follows:33
(i) Initially, Ni2+, Zn2+, and Fe2+ were absorbed in situ by the large number of negative charges of the Ti3C2Tx surfaces. They were co-precipitated by adding a NaOH solution. Fe(OH)2 formed first because of the higher Fe2+ concentration than Ni2+ and Zn2+ (eqn (4)). At the same time, the gel of [Fe(OH)3]m formed after the oxidation of Fe(OH)2 with pumped O2 (eqn (5) and (6)).
| Fe2+ + 2OH− → Fe(OH)2 | (4) |
 | (5) |
| mFe(OH)3 → [Fe(OH)3]m | (6) |
(ii) According to the Fajans rule, Ni2+ and Zn2+ should be absorbed on the surface of colloid cores ([Fe(OH)3]m) because the colloid cores preference absorbed those metal ions, which can form thawless materials with Fe. When Ni2+ and Zn2+ were adsorbed on the colloid cores surface, hydrolysis of the metal ions took place, and the hydroxyl resembling the metal ions were then obtained.
| [Fe(OH)3]m + Ni2+ + Zn2+ + OH− → [Fe(OH)3]m·Ni(Zn)OH+ | (7) |
(iii) In the last stage, as the reaction proceeded, the intermediate was transformed gradually to NiZn ferrite with the release of a proton, which can be written as:
| [Fe(OH)3]m·Ni(Zn)OH+ → NiZnFe2O4 + H2O + H+ | (8) |
Therefore, the number of negative charges on the surface of Ti3C2Tx increased with increasing Ti3C2Tx content, which would provide more channels to absorb metal ions and form more colloid cores ([Fe(OH)3]m). Those larger number of colloid cores ([Fe(OH)3]m) will improve the nucleation of NiZn ferrite. Grain growth was inhibited compared to the free or lower contents of Ti3C2Tx/Ni0.5Zn0.5Fe2O4 composites. Therefore, the grain size decreased with increasing Ti3C2Tx content. On the other hand, the second phase of Ti3C2Tx may prevent grain growth, as observed in graphene/ceramic composites.34 As the contents of Ti3C2Tx increased, the collision probabilities between the second phase of Ti3C2Tx and metal ions would increase, which might impede NiZn ferrite grain growth.
Furthermore, the grain size can be reflected indirectly by the specific surface areas. The specific surface areas of the pure Ni0.5Zn0.5Fe2O4, pure Ti3C2Tx, and Ti3C2Tx/Ni0.5Zn0.5Fe2O4 composites with various Ti3C2Tx contents were measured using the BET method. Fig. 6 presents the specific surface areas of the Ti3C2Tx/Ni0.5Zn0.5Fe2O4 composites with various Ti3C2Tx contents. The specific surface areas of the pure Ni0.5Zn0.5Fe2O4 and as-received Ti3C2Tx MXenes were 53.17 m2 g−1 and 13.91 m2 g−1, respectively. The specific surface areas of the Ti3C2Tx/Ni0.5Zn0.5Fe2O4 composites increased with increasing Ti3C2Tx MXenes content, and reached a maximum of 82.01 m2 g−1 for the 5 wt% Ti3C2Tx/Ni0.5Zn0.5Fe2O4 composites. This indicates that finer grain Ti3C2Tx/Ni0.5Zn0.5Fe2O4 composites were obtained at higher Ti3C2Tx MXenes contents. This is consistent with the grain size calculation from the XRD patterns. The incorporation of the nonmagnetic phase of Ti3C2Tx MXenes impeded the serious aggregation of magnetic NiZn ferrite nanoparticles.
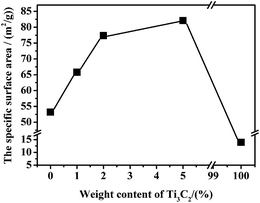 | ||
| Fig. 6 Specific surface areas of pure Ni0.5Zn0.5Fe2O4, pure Ti3C2Tx MXenes, and Ti3C2Tx/Ni0.5Zn0.5Fe2O4 composites with different Ti3C2Tx contents. | ||
SEM and TEM were carried out to further examine the microstructure of the as-synthesized Ti3C2Tx/Ni0.5Zn0.5Fe2O4 composites. Fig. 7a shows a typical SEM image of the 5 wt% Ti3C2Tx/Ni0.5Zn0.5Fe2O4 composites. Ti3C2Tx MXenes were covered homogenously with spherical NiZn ferrite nanoparticles, and Ti3C2Tx MXenes still retained the ordered layer structure. NiZn ferrite nanoparticles had a tendency to agglomerate because of the powerful magnetic dipole interactions and high surface energy. EDS was carried out to confirm the chemical composition of the composites. EDS analysis of the rectangle area marked in Fig. 7a revealed mainly Ti, C, O, Ni, Zn, and Fe (Fig. 7b). S and Na were not detected, showing that the SLS surfactant and NaOH precipitant can be removed by filtration and washing with water. Fig. 6c presents the HRTEM image of 5 wt% Ti3C2Tx/Ni0.5Zn0.5Fe2O4 composites. The ferrite nanograins covered not only the surface of the Ti3C2Tx MXenes sheets, but were also inserted into the Ti3C2Tx MXenes interlayer. The mean grain size of Ni0.5Zn0.5Fe2O4 was approximately 10 nm, which was very close to the value calculated from the XRD patterns. After detailed analysis of the lattice fringes, the lattice fringe spacing 0.25 nm (Fig. 7c) can be assigned to the (311) planes of the cubic spinel crystal Ni0.5Zn0.5Fe2O4. The corresponding selected area electron diffraction (SAED) pattern also indicates the good crystal structure of the cubic spinel phase. The lattice fringe spacing 0.48 nm (Fig. 7c) was a typical (0004) plane of the hexagonal structure of Ti3C2Tx MXenes. Therefore, the morphology of the 5 wt% Ti3C2Tx/Ni0.5Zn0.5Fe2O4 composites further demonstrated that a large number of modified Ti3C2Tx MXenes surface negative charges acted as nucleation centers and interacted with metal ions during co-precipitation, which was a benefit to the in situ coating by Ni0.5Zn0.5Fe2O4 nanoparticles. Furthermore, Ni0.5Zn0.5Fe2O4 nanoparticles were attached firmly to the surface and were inserted into the interlayer of Ti3C2Tx MXenes, and an ultra-sonication processing was performed during TEM specimen preparation, which indicated an excellent electrostatic interaction between Ti3C2Tx and ferrites.
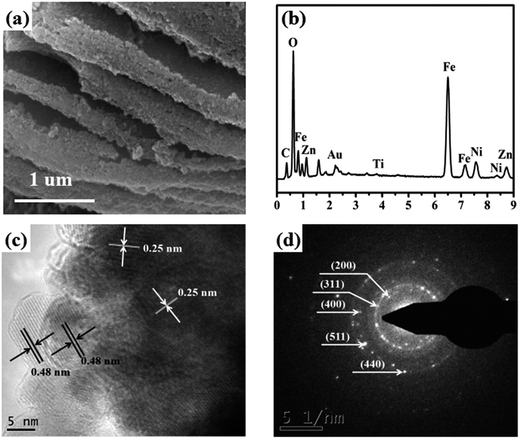 | ||
| Fig. 7 (a) SEM image of 5 wt% Ti3C2Tx/Ni0.5Zn0.5Fe2O4 composites and EDS (b) spectra of the white area in (a); HRTEM image (c) and SAED pattern (d) of 5 wt% Ti3C2Tx/Ni0.5Zn0.5Fe2O4 composites. | ||
The magnetic properties of the Ti3C2Tx/Ni0.5Zn0.5Fe2O4 composites with various Ti3C2Tx contents were examined in an applied magnetic field range from −30 to 30 kOe at room temperature. Fig. 8 shows the hysteresis loop of the Ti3C2Tx/Ni0.5Zn0.5Fe2O4 composites with different Ti3C2Tx contents. All of them exhibited typical soft ferrite properties because the coercive force and residual magnetization are nearly zero. Compared to the pure Ni0.5Zn0.5Fe2O4, the saturation magnetization (Ms) of the 5 wt% Ti3C2Tx/Ni0.5Zn0.5Fe2O4 composites decreased from 32.3 to 27.08 emu g−1. The Ms decreased slightly with decreasing Ti3C2Tx contents. The decrease in Ms might be due to the demagnetizing field produced by the incorporation of nonmagnetic Ti3C2Tx and the decreasing grain size. Xia Li et al.33 observed similar trends for pure NiZn ferrite nanoparticles. Compared to the 19 nm NiZn nanoparticles, the saturation magnetization of 6 nm NiZn nanoparticles decreased from 38 to 32 emu g−1. Kodama et al.35 attributed this to much more frozen spins on the surface that point to random positions, which reduced the saturation magnetization for finer particles.
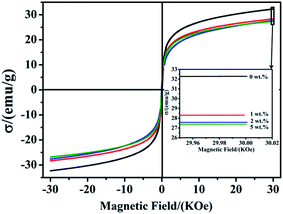 | ||
| Fig. 8 Hysteresis loops of Ti3C2Tx/Ni0.5Zn0.5Fe2O4 composites with various Ti3C2Tx contents: (a) 0 wt%, (b) 1 wt%, (c) 2 wt%, (d) 5 wt%. | ||
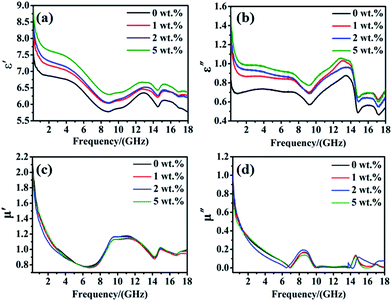
To examine the EM wave absorption of the as-synthesized Ti3C2Tx/Ni0.5Zn0.5Fe2O4 composites, their relative complex permittivity and complex permeability were measured in the frequency range of 0.2–18 GHz. The complex permittivity and permeability are usually used to analyze the dielectric and magnetic properties of the microwave absorber materials. Generally, real part of the permittivity and permeability signify the storage capability of the dielectric and magnetic energy, respectively. While the imaginary part of the permittivity and permeability stand for the loss of dielectric and magnetic energy.36 Fig. 9a–d shows the permittivity and permeability of pure Ni0.5Zn0.5Fe2O4 and Ti3C2Tx/Ni0.5Zn0.5Fe2O4 composites with various Ti3C2Tx contents, respectively. Both the real (ε′) and imaginary (ε′′) part of the permittivity of the Ti3C2Tx/Ni0.5Zn0.5Fe2O4 composites increased with increasing Ti3C2Tx contents (Fig. 9a and b). A high electrical conductivity is benefit to a high complex permittivity according to free electron theory.37 Therefore, these increases are mainly due to the high electrical conductivity of Ti3C2Tx, which are already indicated by both the theoretical prediction and experimental results. Ti3C2Tx shows the metallic-like electrical conductivity behavior, which was attributed to the high electron density of states near the Fermi level [N(Ef)], as simulated from density functional theory.22 Shahzad et al.4 reported the electrical conductivity of Ti3C2Tx films can reach 4600 S cm−1. Therefore, the high aspect ratio of 2D Ti3C2Tx flakes can form a conducting network easily within the NiZn ferrite and provide an electron carrier to improve the electrical conductivity of Ti3C2Tx/Ni0.5Zn0.5Fe2O4 composites. In addition, the conductive network formed by 2D Ti3C2Tx can be seen as a minicapacitor in the composite. The polarization effects improved the charge storage capacity and the real part of permittivity of the composite. An increase in the imaginary part of the permittivity can be attributed to the increasing ohmic loss in the composite. It is worthy to note that, according to the quarter-wavelength equation, the increases in complex permittivity at high frequency will benefit to decline the absorbing thickness.5
Furthermore, both ε′ and ε′′ of all specimens exhibits a certain degree of fluctuation in the frequency range of 0.2–18 GHz. The values of both ε′ and ε′′ first decreased from 0.2–9 GHz and then increased from 9–18 GHz with some obvious resonances. It exhibits obvious frequency-dependent dielectric response. The phenomenon of the values of both ε′ and ε′′ decreased from 0.2–9 GHz is a typical frequency dispersion behavior, which is common in most of carbon/magnetic composites.5,15 This may arise from the lag of the induced charges to follow the reversing external field at high frequencies and finally causes a reduction in the electronic oscillations.38 Furthermore, the permittivity of the Ti3C2Tx/Ni0.5Zn0.5Fe2O4 composites showed typical nonlinear resonant characteristics at 9–18 GHz, which indicates the existence of polarization and relaxation behavior and implies better dielectric loss performance in the corresponding frequency range. Usually, the dielectric property of the material is determined by the electronic, ionic, space charge, Debye dipole and interfacial polarization. As we know, the electronic and ionic polarization is the main contribution in the THz and PHz frequency range. Therefore, the dielectric properties of the Ti3C2Tx/Ni0.5Zn0.5Fe2O4 composites are mainly contributed to space charge, Debye dipole and interfacial polarization. Liu et al.5 observed the similar phenomenon in the co-doped Ni–Zn ferrite/graphene (CNZF/GN) composites. Because of the dielectric properties of Ti3C2Tx/Ni0.5Zn0.5Fe2O4 composites are similar with the CNZF/GN composites. According to the conclusion of Liu et al.,5 the Debye dipolar relaxation effect may be ascribed to the following reason: during the alternation EM wave radiation, the lags in induced charge caused by the ferrite–ferrite, ferrite–Ti3C2Tx, and Ti3C2Tx–Ti3C2Tx interfaces that encounter the external applied field will lead to relaxation and transformation of EM energy into thermal energy. Furthermore, the lattice defects and functional groups produced from Ti3C2Tx and Ti3C2Tx/Ni0.5Zn0.5Fe2O4 composites synthesis processing would produce additional carries between ferrite and Ti3C2Tx and is also beneficial for Debye relaxation. In addition, in the Ti3C2Tx–Ni0.5Zn0.5Fe2O4 heterogeneous system, the accumulation of virtual charges at the interface of Ti3C2Tx and Ni0.5Zn0.5Fe2O4 with different conductivities and dielectric constants would lead to interfacial polarization and is well known as Maxwell–Wagner polarization.
In contrast to the permittivity, the incorporation of small fraction of nonmagnetic Ti3C2Tx had little effect on the permeability of the Ti3C2Tx/Ni0.5Zn0.5Fe2O4 composites (Fig. 9c and d). The real (μ′) and imaginary (μ′′) part of the permeability of the all specimens exhibit similar variation trends in the whole frequency range. The values of μ′ and μ′′ are decreased with an increase in the frequency from 0.2–7 GHz and then some distinct resonance peak could be observed owing to the multiple magnetic resonances. The values of μ′ and μ′′ are less than 2.1 and 1.1, respectively. Because of the desirable magnetization values, the high initial points (>2) of the real parts of the permeability may be favorable for maintaining a large μ′ value and the impedance matching properties in the whole frequency range. The magnetic loss is normally characterized by the imaginary part of permeability (μ′′). The imaginary part of permeability shows a decreasing tendency with increasing frequency, which belongs to typical ferromagnetic behavior. In some frequency ranges, the value of imaginary part of the permeability was negative, which indicates that the magnetic energy radiated from these samples owing to the motion of charges in an electromagnetic field.5 Generally speaking, the magnetic loss of magnetic materials is mainly determined by the domain wall resonance, exchange resonance, hysteresis loss, eddy current resonance, dimensional resonance and natural resonance.39 The magnetic loss may not be ascribed from the domain wall resonance, because it usually occurs in the megahertz frequency range. Furthermore, for NiZn spinel ferrites, exchange resonance is not the main mechanism of magnetic loss in the high frequency range.40 In saddition, for the Ti3C2Tx/Ni0.5Zn0.5Fe2O4 composites, the hysteresis loss is proportional to the area of the hysteresis loop. Therefore it can be negligible in a weak field.41 Moreover, Liu et al.5 calculated the eddy current coefficient and minimum dimensional resonance thickness of the CNZF/GN composites and suggested the absence of an eddy current effect on the magnetic loss. In the present work, the thickness of specimens is about 2 mm, which is smaller than the calculated dimensional resonance thickness (3–4 mm) from wave equations. Therefore, the dimensional resonance can be ignored in the Ti3C2Tx/Ni0.5Zn0.5Fe2O4 composites. Liu et al.5 suggested that the resonance peak in the high frequency range (GHz) should be attributed to natural resonance. Based on these discussion and previous conclusion,5,39–41 the main mechanism of magnetic loss can be attributed to the natural resonance.
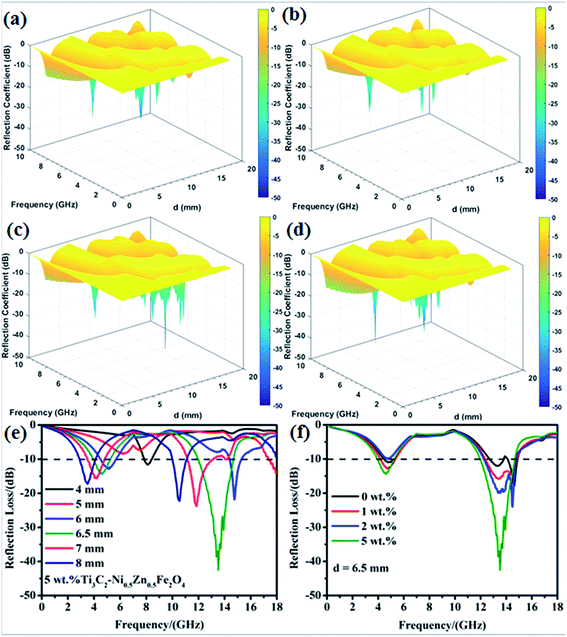
Based on an analysis of the relative complex permittivity and permeability, the EM wave absorption properties of the Ti3C2Tx/Ni0.5Zn0.5Fe2O4 composites were investigated and calculated from the eqn (1) and (2). To further investigate the influence of thickness and frequency on the microwave absorption properties, 3D images map of the reflection loss for various Ti3C2Tx contents are shown in Fig. 10a–d. For convenience comparing, the theoretical calculated reflectance of 5 wt% Ti3C2/Ni0.5Zn0.5Fe2O4 with different thicknesses in the frequency range of 0.2–18 GHz was selected to show in Fig. 10e. The peak shows the minimum RL, and the thickness is nλ/4 (where n = 1, 3, 5…). By adjusting the thickness of the specimens from 4 mm to 8 mm, the effective absorption was obtained in the frequency range, 3–7 GHz and 10–15 GHz, respectively. When the thickness was 6.5 mm, the minimum RL value was −42.5 dB at 13.5 GHz. Interestingly, the RL peaks of 5 wt% Ti3C2Tx/Ni0.5Zn0.5Fe2O4 shifted to a lower-frequency with increasing absorber thickness. This phenomenon can be explained by the quarter-wavelength equation:5
| tm = nλ/4 = nc/4fm(εr/μr)1/2 | (9) |
The good microwave absorption performance of Ti3C2Tx/Ni0.5Zn0.5Fe2O4 composites may be explained as follows (Fig. 11):
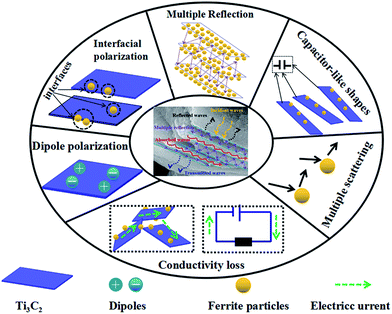 | ||
| Fig. 11 Schematic diagram of the potential electromagnetic wave absorption mechanisms for the Ti3C2Tx/Ni0.5Zn0.5Fe2O4 composites. | ||
(1) First, electromagnetic impedance matching plays a key role in the microwave absorption performance of composites. The microwave absorption of pure Ni0.5Zn0.5Fe2O4 can be attributed mainly to magnetic loss. The imaginary part of complex permittivity is very small at high frequency. Therefore, impedance matching is out of balance. The incorporation of high conductive Ti3C2Tx enhanced the conductivity and improved the impedance matching of the Ti3C2Tx/Ni0.5Zn0.5Fe2O4 composites. Therefore, the microwave absorption performance was also improved.
(2) Second, the dielectric loss and magnetic loss are important factors that contribute to EM wave absorption for the Ti3C2Tx/Ni0.5Zn0.5Fe2O4 composites. The magnetic loss was attributed to the Ni0.5Zn0.5Fe2O4. As suggested by Han et al.24 and Shahzad et al.,4 the dipolar polarization caused by the surface functional groups, localized defects, and dangling bonds of Ti3C2Tx MXenes plays an important role in the dielectric loss. In addition, it is a heterogeneous system. Interfacial polarization, called Maxwel–Wagner polarization, will be generated at the interface of Ni0.5Zn0.5Fe2O4 and Ti3C2Tx MXenes due to the different conductivity and dielectric constants. The in situ co-precipitation method used made the nano Ni0.5Zn0.5Fe2O4 coat the Ti3C2Tx MXenes surfaces and inserted interlayer, which can produce a much larger interface of Ni0.5Zn0.5Fe2O4–Ti3C2Tx, Ti3C2Tx–Ti3C2Tx, and Ni0.5Zn0.5Fe2O4–Ni0.5Zn0.5Fe2O4. This can cause strong interface polarization. Under an electromagnetic field, dipolar polarization and interface polarization can increase the energy dissipation, which gives the Ti3C2Tx/Ni0.5Zn0.5Fe2O4 composites enhanced microwave absorption ability.
(3) Third, as demonstrated in the graphene/ferrite composites system, the conductivity loss cannot be ignored because of the similar excellent conductivity of Ti3C2Tx MXenes with graphene.5 The conductivity network will be formed by the random 2D Ti3C2Tx flakes in the Ti3C2Tx/Ni0.5Zn0.5Fe2O4 composites. When the vertical component of an electromagnetic wave is inputted into the composites in an alternating EM field, the EM wave energy is transferred in the form of a micro current due to the good impedance matching.5 The NiZn ferrites act as an insulator. During micro current transmission, a large portion of the electrical energy would be dissipated due to the high resistance of NiZn ferrites. Moreover a small part is attenuated by Ti3C2Tx MXenes itself because the micro current is transmitted to the insulator of NiZn ferrites.
(4) Multiple reflections could be another important absorption mechanism because of the layer structure of Ti3C2Tx MXenes, as indicated by Shahzad et al.4 and Han et al.23 Some of the incident EM waves entering the Ti3C2Tx/Ni0.5Zn0.5Fe2O4 composites could be reflected immediately because of the high conductivity of Ti3C2Tx MXenes. The remaining waves pass through the MXene and ferrite, where the interaction with the MXenes and ferrite induces a microcurrent that contributes to conductivity losses, resulting in a decrease in the energy of the EM waves. The surviving EM waves will be entered as the next layer of Ti3C2Tx and could be reflected and scattered repeatedly between these interfaces. The first and second layers of Ti3C2Tx act as the reflecting surface and are enhanced to multiple internal reflections with each other. Furthermore, the NiZn ferrite coated with each Ti3C2Tx surface will attenuate the EM waves by magnetic loss and multiple scattering. Therefore, it is difficult for the EM waves to escape from the composites until they are dissipated completely as heat.17
4. Conclusion
A facile, fast, and scalable approach to synthesize a novel family Ti3C2Tx/ferrite composite with good electromagnetic wave absorption was developed using an in situ co-precipitation method. The potential electromagnetic wave absorption mechanisms were proposed. The incorporation of high conductivity Ti3C2Tx MXenes improved the EM impedance of NiZn ferrite, and contributed to the dielectric loss and conductivity loss of the composites. In addition, the multiple reflections caused by the layer structure of Ti3C2Tx MXenes further improved the EM wave absorption performance. The minimum RL value of −42.5 dB at 13.5 GHz with a thickness of 6.5 mm with the 5 wt% Ti3C2Tx was obtained. The effective absorption bandwidth of 5 wt% Ti3C2Tx/Ni0.5Zn0.5Fe2O4 composite reached ∼3 GHz (12–15 GHz) in the K-band. Although the corresponding thickness of the minimum RL value was relative high, in future work, it is expected to decrease with increasing Ti3C2Tx MXenes content. This study is expected to open the door for the potential applications of MXenes/ferrite family in the microwave absorbing field.Acknowledgements
This study was supported by the National Natural Science Foundation of China (Grant No. 51502310), the Natural Science Foundation of Zhejiang Province (Grant No. LY15E020007), and the Natural Science Foundation of Ningbo city (Grant No. 2016A610248). This study was supported by the National Key Research and Development Program of China (No. 2016YFB0700901).References
- B. Zhao, W. Zhao, G. Shao, B. Fan and R. Zhang, ACS Appl. Mater. Interfaces, 2015, 7, 12951–12960 CAS.
- J. Ling, W. Zhai, W. Feng, B. Shen, J. Zhang and W. G. Zheng, ACS Appl. Mater. Interfaces, 2013, 5, 2677–2684 CAS.
- S. Umrao, T. K. Gupta, S. Kumar, V. K. Singh, M. K. Sultania and J. H. Jung, et al., ACS Appl. Mater. Interfaces, 2015, 7, 19831–19842 CAS.
- F. Shahzad, M. Alhabeb, C. B. Hatter, B. Anasori, H. S. Man and C. M. Koo, et al., Science, 2016, 353, 1137–1140 CrossRef CAS PubMed.
- P. Liu, Z. Yao, J. Zhou, Z. Yang and L. B. Kong, J. Mater. Chem. C, 2016, 4, 9738–9749 RSC.
- B. Zhao, B. Fan, S. Gang, W. Zhao and Z. Rui, ACS Appl. Mater. Interfaces, 2015, 7, 18815–18823 CAS.
- Y. Du, W. Liu, R. Qiang, Y. Wang, X. Han and J. Ma, et al., ACS Appl. Mater. Interfaces, 2014, 6, 12997–13006 CAS.
- X. Huang, J. Zhang, M. Lai and T. Sang, J. Alloys Compd., 2015, 627, 367–373 CrossRef CAS.
- P. Liu, Z. Yao and J. Zhou, Ceram. Int., 2015, 41, 13409–13416 CrossRef CAS.
- V. Sunny, P. Kurian and P. Mohanan, et al., J. Alloys Compd., 2010, 1, 297–303 CrossRef.
- Q. Li, Y. Li, X. Li, S. Chen, S. Zhang and J. Wang, et al., J. Alloys Compd., 2014, 608, 35–43 CrossRef CAS.
- Y. Li, R. Yi, A. Yan, L. Deng, K. Zhou and X. Liu, Solid State Sci., 2009, 11, 1319–1324 CrossRef CAS.
- Y. Wang, Y. Huang, Q. Wang and M. Zong, Powder Technol., 2013, 249, 304–308 CrossRef CAS.
- X. Zhou, L. Shen, L. Li, S. Zhou, T. Huang and C. Hu, et al., J. Eur. Ceram. Soc., 2013, 33, 2119–2126 CrossRef CAS.
- X. B. Zhou, L. Shen, L. Li, T. M. Huang, C. F. Hu and W. M. Pan, et al., J. Phys. D: Appl. Phys., 2013, 46, 145002 CrossRef.
- X. Li, W. Cai, J. An, S. Kim, J. Nah and D. Yang, et al., Science, 2009, 324, 1312–1314 CrossRef CAS PubMed.
- N. Ks, G. Ak, M. Sv, Y. Z. Dj and D. Sv, et al., Science, 2004, 306, 666–669 CrossRef PubMed.
- B. Shen, W. Zhai, M. Tao, J. Ling and W. Zheng, ACS Appl. Mater. Interfaces, 2013, 5, 11383–11391 CAS.
- M. Naguib, M. Kurtoglu, V. Presser, J. Lu, J. Niu and M. Heon, et al., Adv. Mater., 2011, 23, 4248–4253 CrossRef CAS PubMed.
- M. Naguib, O. Mashtalir, J. Carle, V. Presser, J. Lu and L. Hultman, et al., ACS Nano, 2012, 6, 1322–1331 CrossRef CAS PubMed.
- M. Ghidiu, M. R. Lukatskaya, M. Q. Zhao, Y. Gogotsi and M. W. Barsoum, Nature, 2014, 516, 78–81 CAS.
- M. R. Lukatskaya, O. Mashtalir, C. E. Ren, Y. Dall'Agnese, P. Rozier and P. L. Taberna, et al., Science, 2013, 341, 1502–1505 CrossRef CAS PubMed.
- Z. Ling, C. E. Ren, M. Q. Zhao, J. Yang, J. M. Giammarco and J. Qiu, et al., Proc. Natl. Acad. Sci. U. S. A., 2014, 111, 16676–16681 CrossRef CAS PubMed.
- M. Han, X. Yin, H. Wu, Z. Hou, C. Song and X. Li, et al., ACS Appl. Mater. Interfaces, 2016, 8, 21011–21019 CAS.
- Y. Qing, W. Zhou, F. Luo and D. Zhu, Ceram. Int., 2016, 42, 16412–16416 CrossRef CAS.
- X. Zhou, J. Dai and J. Cai, J. Chin. Ceram. Soc., 2009, 37, 23–28 CAS.
- S. Brunauer, P. H. Emmett and E. Teller, J. Am. Chem. Soc., 1938, 60, 309–319 CrossRef CAS.
- X. Li, G. Fan and C. Zeng, Int. J. Hydrogen Energy, 2014, 39, 14927–14934 CrossRef CAS.
- X. Li, C. Zeng and G. Fan, Int. J. Hydrogen Energy, 2015, 40, 9217–9224 CrossRef CAS.
- Q. Peng, J. Guo, Q. Zhang, J. Xiang, B. Liu and A. Zhou, et al., J. Am. Chem. Soc., 2014, 136, 4113–4116 CrossRef CAS PubMed.
- Y. Tang, J. F. Zhu, C. H. Yang and F. Wang, J. Alloys Compd., 2016, 685, 194–201 CrossRef CAS.
- Y. Xiang, W. Xu, Y. Zhan, X. Xia, Y. Xiong and Y. Xiong, et al., Polym. Compos., 2013, 34, 860–866 CrossRef CAS.
- X. Li and G. Wang, J. Magn. Magn. Mater., 2009, 321, 1276–1279 CrossRef CAS.
- M. Han, X. Yin, L. Kong, M. Li, W. Duan and L. Zhang, et al., J. Mater. Chem. A, 2014, 2, 16403–16409 CAS.
- R. H. Kodama, A. E. Berkowitz, E. J. McNiff Jr and S. Foner, Phys. Rev. Lett., 1996, 77, 394–397 CrossRef CAS PubMed.
- D. Moitra, M. Chandel, B. K. Ghosh, R. K. Jani, M. K. Patra and S. R. Vadera, et al., RSC Adv., 2016, 6, 14090–14096 RSC.
- C. Wang, X. J. Han, P. Xu, X. L. Zhang, Y. C. Du and S. R. Hu, et al., Appl. Phys. Lett., 2011, 98, 217 Search PubMed.
- V. Panwar and R. M. Mehra, Polym. Eng. Sci., 2008, 48, 2178–2187 CAS.
- B. Lu, X. L. Dong and H. Huang, et al., J. Magn. Magn. Mater., 2008, 6, 1106–1111 CrossRef.
- H. Lv, H. Zhang and B. Zhang, et al., ACS Appl. Mater. Interfaces, 2016, 8, 6529–6538 CAS.
- P. Liu, Z. Yao and J. Zhou, et al., Ceram. Int., 2015, 41, 13409–13416 CrossRef CAS.
| This journal is © The Royal Society of Chemistry 2017 |

