DOI:
10.1039/C7RA03354K
(Paper)
RSC Adv., 2017,
7, 26458-26467
Effect of acetone extract from natural rubber on the structure and interface interaction in NR/CB composites
Received
22nd March 2017
, Accepted 3rd May 2017
First published on 17th May 2017
Abstract
The influences of acetone extract (AE) from natural rubber on the interface structure of NR/CB composites were investigated through rubber process analyzer (RPA), scanning electron microscopy (SEM), Raman spectroscopy, X-ray diffraction (XRD), and differential scanning calorimetry (DSC). The results demonstrated that the crystallite size of CB was increased by AE, leading to the decrease of dispersive free energy (γds) on the CB surface, which results in a reduction of CB–NR interaction. Oppositely, AE also increased the number of physical entanglement points in NR/CB matrix for its polarity interaction with CB, which could promote the CB–NR interaction. Consequently, the optimized value of AE in NR/CB matrix is 2 phr, where the optimal mechanical and dynamical properties were obtained. Simultaneously, AE had a negative effect on the strain-induced crystallization behaviors of NR/CB composites. This research may draw attention to the evaluation of quality standards of NR.
Introduction
Natural rubber is collected from Hevea brasiliensis and is widely used in the industry. For its natural distinction, NR is actually a mixture of compounds, consisting of cis-1,4-polyisoprene (95% w/w) and non-isoprene compounds as proteins (1–2% w/w), acetone extract (1–2% w/w), carbohydrates (0.4% w/w) and minerals (0.3–0.7% w/w).1 All of these are affected by climate, territory, breed or process conditions. These non-isoprene compounds are important to the stability of natural rubber latex, rubber processability, and even the mechanical properties2–6 of the vulcanizate. Unfortunately, the critical components of non-isoprene compounds are still unclear, let alone the effect of these factors on the natural rubber network structure and application performance. In fact, NR is often applied with inorganic particles, such as carbon black, silica,7 MMT,8 and HNTs,9 which is more valuable to practice. However, few researchers were concerned about the influence of non-isoprene compounds on the mechanical and dynamical properties or interface structure of filled NR composites.
Acetone extract (AE), as one of the non-isoprene compounds, is important to the quality of NR. It consists of oleic acid, linoleic acid, stearic acid, and sterol ester, as reported.10 Researchers reported that some accelerants and sterol antioxidant contained in AE could positively affect the curing rate and anti-aging resistance to ozone11–13 of unfilled natural rubber. Carbon black, as a common filler, is widely used in natural rubber composites. W. Thongruang14 explored the correlations of electrical and mechanical properties of NR/CB composites, focusing on differences in mixing methods, curing ingredients or sample thickness. Xu15 investigated the influence of CB grafted with degraded natural rubber on the mechanical and dynamical properties of NR/CB composites, which performed well on tensile stress and tear strength. Others reports about the influence of filler types16 or hybrid filler17 on the properties of NR/CB composites were also done. Above all, researchers payed close attention to the modification of CB particles, and preparation methods that could significantly improve the performance of NR/CB composites. No reports were published about the effects of AE on the dynamical and mechanical properties or structure variation of NR/CB composites, which are valuable to the application of NR in tyres.
In this study, NR/CB composites with different AE were prepared on double rolls open mill. The structural variations of CB and composites caused by AE were investigated through Raman spectroscopy, XRD, DSC and stress–strain behaviors. Simultaneously, the mechanical and dynamic properties of composites and CB–rubber interaction were also illustrated. The results clarified the impact of AE on the structure and dynamic properties of NR/CB composites, which could offer valuable information on Hevea brasiliensis cultivation and on the application of NR/CB composites.
Experimental
Materials
Natural rubber (NR), with trade name SCR-WF, was supplied by Hainan Sinochem Rubber Company, Ltd (Hainan, China). Carbon black (CB N330) was purchased from Guangzhou Institute of Rubber Industry Products Co., Ltd (Guangdong, China). DBP was determined to be 103 × 10−5 m3 kg−1. Other ingredients are commercially industrial products and used as received.
Preparation of NR/CB composites modified by AE
First, natural rubber was extracted by acetone for 48 h through the Soxhlet extraction method and the residual solution was concentrated using a rotary evaporator to obtain the acetone extract (AE). The dried natural rubber NR was mixed with other ingredients on a X(S)K-160 open-mill (Dongguan, China) at room temperature. Basic formulation (mass parts): NR 100, CB (0 or 30), AE (0–5), zinc oxide 5, stearic acid 2, sulfur 1.5, N-cyclohexyl-2-benzothiazolesulfenamide (accelerator CZ) 1.5, benzothiazole disulfide (accelerator DM) 0.5. The optimum curing time (T90) was determined at 143 °C by a UR-2030 oscillating disk rheometer (U-CAN Technology Company, Ltd, Taiwan). The compounds were vulcanized on a KSH R100 flat vulcanizing machine (Kesheng Machinery Co., Ltd, Dongguan, China) after their accommodation at room temperature for 4 h.
Preparation of NR/CB/AE model compound
NR/CB/AE and NR/CB model compounds with the mass ratios of 100/30/5 and 100/30, respectively, were made on a X(S)K-160 open-mill at room temperature for 10 min. No additives were used in this experiment. Then, the compounds were extracted in a Soxhlet extractor using acetone for 72 h, to eliminate the free-moving components of AE, and then extracted by toluene for 72 h continuously, to remove the weakly adsorbed NR molecules from CB. The residuum after extraction was analyzed through Raman spectroscopy and XRD to investigate the interaction.
Analysis and characterization
Strain sweeps of unvulcanized NR/CB composites were conducted by Rubber Processing Analyzer (RPA) (RPA 2000, Alpha, USA) from 0.7% to 200% at 100 °C, 1 Hz. The morphology of fractured surfaces of vulcanized NR/CB composites (15 mm × 6 mm × 1 mm) was observed using a ZEISS Merlin SEM (EVO18 German) machine at an acceleration voltage of 10.0 kV. Tensile properties and tear strength of vulcanizates were determined according to ISO 37-2005 standard (dumbbell A shape) and ISO 34-1:2004 (nicked angle), respectively, at 25 °C using a U-CAN UT-2060 instrument. Shore A hardness was performed following ISO 7619-1:2004 using a XY-1 durometer (Shanghai). Rolling resistance of composites was obtained via a RSS-II rolling resistance testing machine (Beijing Wan Hui Technology Development Co., Ltd, China). Compression fatigue heat production of composites was determined by a RH-2000N (GOTECH Testing Machines Inc.) compression fatigue tester according to ISO4666/3-1982. Abrasion resistance of vulcanized composites was determined using a rotating cylindrical drum device (DIN) according to ISO 4649:2002. Raman spectrum was implemented by a DXR (American Thermo Electron) Laser Co-focal Microscopy Raman Spectrometer in the range of 100–3000 cm−1 at a wavelength of 523 nm. XRD spectrum was recorded on a X' Pert PRO (PANalytical, Holland) wide angle X-ray diffraction system, using Cu Kα radiation (λ = 0.154 nm) with a diffraction angle of 5–90° at a step order of 0.017° per 16.24 s.
The glass transition behaviors of NR/CB composites were examined on a NETZSCH DSC 204 F machine. The temperature program involved a 5 min isothermal hold at −80 °C, followed by heating at 3 °C min−1 to 10 °C under nitrogen. The heat capacity step, ΔCpn, and weight fraction of immobilized polymer layer, χim,18,19 were calculated as follows:
| | |
χim = (ΔCp0 − ΔCpn)/ΔCp0
| (2) |
where Δ
Cp is the heat capacity jump at
Tg. Δ
Cpn is normalized to the polymer weight fraction.
w is the weight fraction of filler. Δ
Cp0 refers to the heat capacity jump at
Tg of the unfilled polymer matrix.
χim is the weight fraction of immobilized polymer layer.
Tg was determined according to ASTM E1356-08, and Δ
Cp was calculated using the NETZSCH Thermal Analysis software.
Results and discussion
Effect of AE on the dispersion of CB in NR/CB composites
Fig. 1 depicts the RPA strain sweep plots of unvulcanized NR/CB composites with different AE. It can be seen that shear modulus (G′) is increased by increasing AE until it obtains a threshold value at 4 phr AE. The result illustrates that the Payne effect of NR/CB composites was enhanced via adding AE. Normally, G′ decreases along with an increase in strain, which is called the Payne effect; a high value of G′ at low strain presents a great degree of aggregation of filler network that would deduce a poor mechanical performance of composites. To further investigate the dispersion of CB in NR matrix, SEM images of NR/CB composites were obtained, which are displayed in Fig. 2. It can be seen that there are no CB aggregates in NR matrix except those shown in Fig. 2(f). Therefore, the enhancement of the Payne effect could not have been caused by the aggregation of CB. This phenomenon could be interpreted through chain entanglement theory. After extraction treatment by acetone, physical entanglement points of natural rubber were destroyed and then replaced by CB particles when preparing NR/CB composites. Due to the alkyl and oxygen-containing groups structure10 of AE components, CB could migrate more easily in the NR/CB/AE system than that of unmodified composites to form a large number of new entanglement points, leading to the enhancement of G′ of composites at low strain. Simultaneously, the decrease of G′ on 5 phr loading should be attributed to the plasticizing effects of small molecular substances of AE.
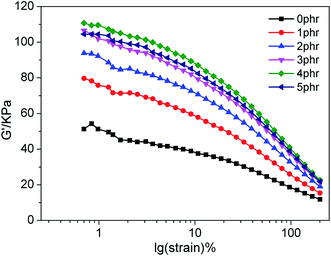 |
| | Fig. 1 RPA strain sweep of unvulcanized NR/CB composites with different contents of AE. | |
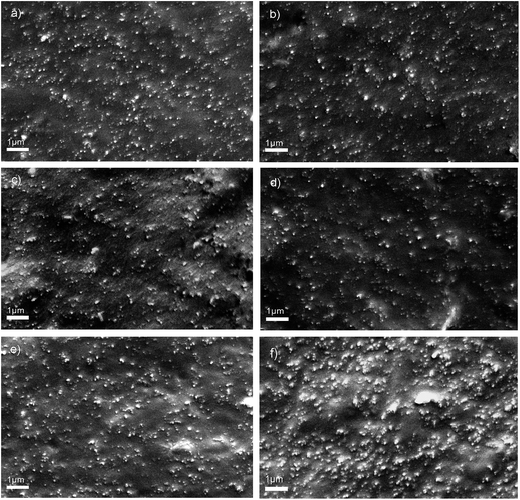 |
| | Fig. 2 SEM images of brittle fracture surfaces of vulcanized NR/CB composites with different AE contents: (a) 0 phr, (b) 1 phr, (c) 2 phr, (d) 3 phr, (e) 4 phr, (f) 5 phr. | |
Analysis of constrained regions of composites by DSC
It is well known that glass transition behavior is a typical feature of polymer molecules that can offer structural variation information of polymers. Normally, Tg and normalized change of heat capacity (ΔCp) of a polymer at the glass transition region are used to evaluate the mobility of polymer molecules that are sensitive to the local environment.20 Fig. 3 shows the glass transition behaviors of unfilled NR and NR/CB composites with different AE.
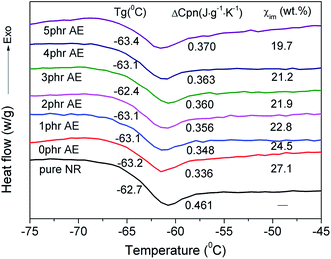 |
| | Fig. 3 Glass transition behaviors of NR/CB composites with different contents of AE. | |
As can be seen, Tg parameters of all samples exhibit no systematic variation upon changing the composition, which is in line with other reports.21,22 One reason for this is that the average size of immobilized polymer region is greater than the length scale of segmental motion and the relaxation is independent of the composition.23 The other is the plasticization effect24 caused by AE that might promote the mobility of the molecular chain. The normalized heat capacity (ΔCpn) is proportional to the number of internal degrees of freedom of molecular motion and could represent the change of polymer chain mobility in the composites directly.20,25 The greater value of ΔCpn at the glass transition region indicates a better chain mobility. In Fig. 3, ΔCpn is increased via increasing AE in NR/CB composites, which indicates improved mobility of the rubber chain. Thus, a reduction of constrained regions is achieved through the decline of weight fraction of immobilized polymer layer (χim) directly. Synthetically, AE might give a negative effect on filler–rubber interaction in NR/CB matrix, particularly with a high loading content.
Raman spectrum
Raman spectroscopy is sensitive to short range disorder and it can reveal the microstructure of CB for its activity toward C–C single bond.26 A previous report27 indicated the importance of Raman spectrum on surface characterization of partially ordered carbon materials. As we know, CB consists of agglomerated spherical primary particles and exists in a wide range of ordered and disordered regions, also called graphite crystalline regions and amorphous areas.28 To further investigate the influence of AE on the microstructure of CB, Raman spectrum was employed and the spectral information of pure CB and residual CB from extracted NR/CB and NR/CB/AE model compounds is presented in Fig. 4. It can be seen that two relatively broad bands appear in the range of 1000–1800 cm−1: the former at ∼1350 cm−1 is D band is typical of the structural disorder and defects, and the latter at ∼1580 cm−1 is G band for the typical graphitic order.27 Generally, the variation information of CB microstructure is much more significant in NR matrix without AE for its larger Raman shift compared with pure CB spectrum. This might be evidence of the weakened interaction between CB and the rubber phase caused by AE.
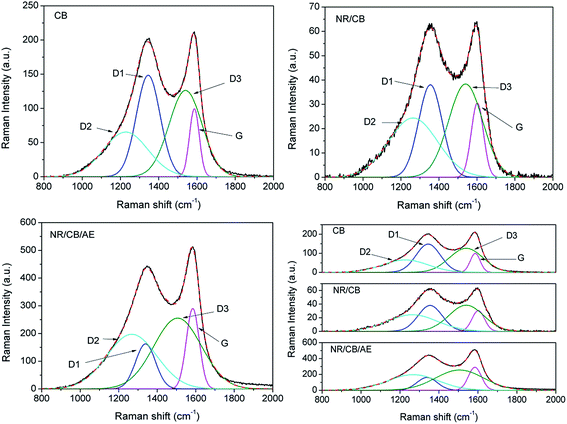 |
| | Fig. 4 Raman spectra peak fitting of pure CB, residual CB from extracted NR/CB and NR/CB/AE model compounds. | |
In order to improve the accuracy in the determination of spectroscopic parameters, such as peak position, bandwidth, lineshape and band intensity, mixed Gaussian–Lorentzian curve fitting26,29 was carried out for each spectrum. Good fits are obtained in Fig. 4, and the data are shown in Table 1. The degree of disorder of D1 is lower than D2 or D3. The definition in article is in line with other report.28 Compared with the parameters of pure CB, the D1 band of CB shifts from 1345 cm−1 to 1355 cm−1 in the NR/CB system, in contrast with 1339 cm−1 in the NR/CB/AE system. G band of CB appears to have a larger variation for the NR/CB system than that of the NR/CB/AE system. Simultaneously, the bandwidth of D1 mode is significantly narrower than that of pure CB, confirming that the degree of ordering of CB in the NR/CB/AE system is greater than that of pure CB.26 Contrasting with the D1 bandwidth of CB in the NR/CB system, it indicates that AE could increase the degree of ordering of CB. Normally, G mode is related to the crystalline component in carbons, and an increase of order in carbonaceous materials is reflected by a decrease of its bandwidth. However, the comparative study of the bandwidth of G mode does not allow conclusive remarks mentioned above. This might be due to the fact that D3 mode, which usually appears at ∼1620 cm−1 as a shoulder, is not observed in these four spectra and interferes with the G mode, thus complicating the interpretation.26,30
Table 1 Raman spectroscopic parameters of CB, residual CB from extracted NR/CB and NR/CB/AE model compounds obtained after curve fitting the experimental spectra by using two Lorentzian bands (D1 and G) and two Gaussian bands (D2 and D3)
| Sample |
Peak position ν (cm−1) |
Bandwidth ω1/2 (cm−1) |
Intensity (peak area%) |
La (nm) |
| CB |
D1 |
1345 |
147 |
31 |
1.1 |
| D2 |
1228 |
273 |
25 |
|
| D3 |
1540 |
204 |
36 |
|
| G |
1586 |
60 |
8 |
|
| NR/CB |
D1 |
1355 |
146 |
24 |
1.8 |
| D2 |
1263 |
304 |
32 |
|
| D3 |
1540 |
211 |
34 |
|
| G |
1602 |
76 |
10 |
|
| NR/CB/AE |
D1 |
1339 |
122 |
11 |
5.2 |
| D2 |
1268 |
306 |
34 |
|
| D3 |
1506 |
291 |
42 |
|
| G |
1585 |
79 |
13 |
|
The nanoscale crystal on the CB surface, proven by High Resolution Transmission Electron Microscopy (HRTEM),31 is important and its size, called microcrystalline planar crystal size (La), has a negative relationship to the dispersive free energy (γds)32 of the CB surface. It is well known that γds is the nonpolar part of CB surface free energy, and it presents a positive effect on the ability of CB to absorb the rubber macromolecule. Thus, La could be a direct evidence reflecting the adsorbability of CB on the rubber macromolecule. The larger its value, the weaker is its adsorption capacity on the rubber phase, as well as a weakened interaction between CB and rubber phase. La could be calculated from the following empirical formula: La = 4.4 IG/ID,26,28,32 where IG and ID are the integrated intensities of the G and D1 bands, respectively. It can be seen that La is increased from 1.1 nm of pure CB to 5.2 nm of the NR/CB/AE system, compared with 1.8 nm of the NR/CB system. This means that AE causes a significant decline in γds of CB that induces the reduction of CB–NR interaction. The increase of La would lead to the diminution of quality and total area of grain boundary, both of which could cause the decrease of high-energy parts on the CB surface.
XRD spectrum
It was reported that carbon black is a heterogeneous mixture of particles that range from single graphite lavers up to graphite crystals several layers thick.33 The effective method to investigate the microstructure of CB particles is X-ray diffraction (XRD).34–36 Fig. 5 demonstrates the XRD spectra of CB, residual CB from extracted NR/CB and NR/CB/AE model compounds. It can be seen in Fig. 5(a) that the 002 peak and 110 peak appear around 25° and 44°, respectively,35,37 which are assigned according to the standard XRD spectrum of graphite. In contrast to the spectrum of pure CB, the shapes and positions of diffraction peaks of residual CB from extracted NR/CB and NR/CB/AE systems significantly changed. This indicates that a significant variation in the microstructure of CB appears via mixing of CB and NR, or adding AE into NR/CB compound.
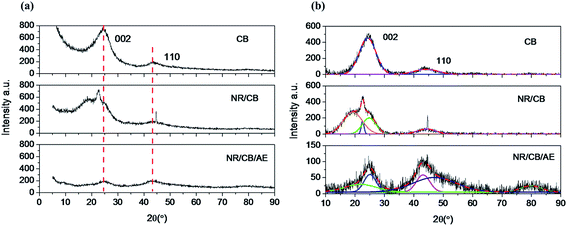 |
| | Fig. 5 XRD spectra of CB, residual CB from extracted NR/CB and NR/CB/AE model compounds: (a) original curves, (b) peak fitting through Gaussian curves. | |
To further study the variation of crystallites structure of CB in three different conditions, a Gaussian peak fitting program was employed; the results are shown in Fig. 5(b) and the data parameters are listed in Table 2. According to the theory of J. Biscoe,32,34,35 crystallite plane size Ha (110 band) and crystallite axial size Hc (002 band) can be calculated by eqn (3) and (4):
| |
 | (3) |
| |
 | (4) |
where
λ is the wavelength of the incident X-ray.
B is the width of half maximum intensity.
θ is the Bragg angle (half of the scattering angle).
B and
θ must be converted into radians during calculation. As is illustrated,
Ha is increased from 1.87 nm of pure CB to 2.39 nm of the NR/CB system, and it further increases to 3.31 nm when AE is added. Simultaneously,
Hc is also increased in the NR/CB or the NR/CB/AE system compared with that of pure CB, and the largest value is obtained without AE. Experimentally,
Ha plays a negative role on the dispersive free energy (
γds) of the CB surface, where a large value of
Ha implies a small value of
γds. In addition, there is no remarkable relationship between
Hc and
γds.
32 Therefore, the increase of
Ha by AE indicates a decline of
γds, which induces the formation of weakened CB–rubber interaction. The result agrees with those of Raman spectra analysis and the bound rubber test. Generally, the critical parts that influence
γds are the small crystallites or faulty crystallites that result in numerous high energy parts where crystal boundary and defects exist, leading to the increase of
γds.
38–40
Table 2 XRD parameters of CB, residual CB from extracted NR/CB and NR/CB/AE model compounds obtained after curve fitting by Gaussian bands
| Sample |
Peak |
B (°) |
2θ (°) |
Ha (nm) |
Hc (nm) |
| CB |
002 |
6.72 |
24.27 |
– |
1.20 |
| 110 |
9.64 |
44.22 |
1.87 |
– |
| NR/CB |
– |
7.65 |
19.22 |
– |
– |
| 002 |
1.14 |
22.55 |
– |
6.99 |
| – |
5.40 |
24.79 |
– |
– |
| 110 |
7.52 |
44.38 |
2.39 |
– |
| NR/CB/AE |
– |
12.77 |
21.82 |
– |
– |
| 002 |
4.87 |
25.08 |
– |
1.65 |
| 110 |
5.41 |
43.15 |
3.31 |
– |
| – |
17.45 |
47.09 |
– |
– |
| – |
8.37 |
79.88 |
– |
– |
Effects of AE on strain-induced crystallization behaviors of NR/CB composites
It is well known that NR is amorphous under the quiescent condition, but highly crystallizable upon stretching. XRD spectra of NR/CB composites at constant strain ratios (λ) are presented in Fig. 6. The 200 band and 120 band both reflect the change of crystallinity on the lateral direction,41 which is perpendicular to the stretching orientation. It can be seen that crystallization behaviors show up at λ = 3 for all specimens and these could be enhanced while increasing the strain sequentially. However, there is no significant difference observed in the curves with different AE.
 |
| | Fig. 6 XRD spectra of NR/CB composites under constant strains: (a) 0 phr AE, (b) 3 phr AE, (c) 5 phr AE (strain ratio, λ = constant length/initial length). | |
In order to reveal the structural variation of NR/CB composites clearly, a peak fitting program was employed using Origin software and Gaussian bands of XRD curves in the range of 10–30° are described in Fig. 7. All the samples with different AE display four Gaussian bands at λ = 3, and a new peak around 28° shows up when λ is 5. This implies a significant change in the structures of the composites with large strain. The crystallinity index CI and the average crystallite size L120 (taking 120 plane as an example) were calculated according to the data in Fig. 7 using eqn (5) and (6);42–45 then the results are found in Fig. 8.
| |
 | (5) |
| |
 | (6) |
where
Ic is the total integrated intensity of crystals (200
![[thin space (1/6-em)]](https://www.rsc.org/images/entities/char_2009.gif)
120 reflections were taken) and
Ia is the total integrated intensity of amorphous peaks.
K is a constant value of 0.89.
43 λ is the wavelength 0.154 nm.
β1/2 is the width at half-height of the 120 reflection, and
θ is the Bragg angle (half of the scattering angle).
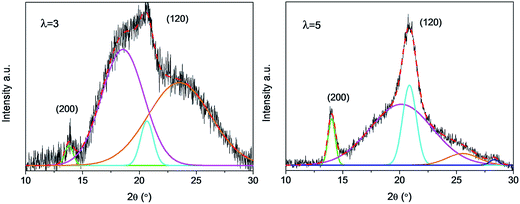 |
| | Fig. 7 XRD crystallization peak fitting of NR/CB composites without AE at different strain. | |
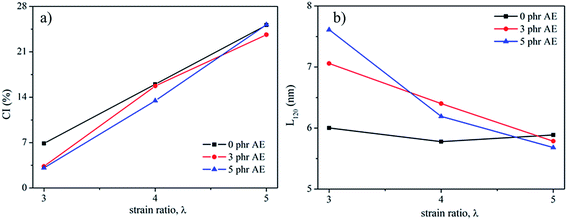 |
| | Fig. 8 Crystallization index (CI) (a) and lateral crystallite size, L120, (b) of NR/CB composites with different AE. | |
In Fig. 8(a), it can be seen that CI increases with increasing strain but decreases after adding AE into the composites, which can be noticed apparently at λ = 3, in contrast to the system with no AE. This means that AE has a negative effect on the crystallization behavior of NR/CB composites. However, in light of the difference in slopes, it can be seen that the composites with AE have large values of crystallization rate, CR, with increasing strain, and CR becomes higher when AE is added at 5 phr compared with that of 3 phr. Generally, strain-induced crystallization SIC of natural rubber is influenced by stretching velocity,46 filler,43,45 additives,44,47 temperature,45 filler–rubber interaction and so on. In the composites, AE and filler–rubber interaction might be the dominant reasons for the variation of SIC behaviors. The increase in CR due to AE in composites should be because of the enhanced slipping effect of NR molecular chains that induce a growth of lattice size along the stretching direction; moreover, the weakened filler–rubber interaction improves the mobility of NR molecular chains, which is beneficial for crystallization. On the other hand, the slipping effect of NR molecular chains by AE might also collapse the chain-folded lamellae or sheaflike (fringed micelle) crystallites43,45,48 and decrease the CI. According to the experimental results that CI decreased via adding AE at the same strain ratio, the later one might be primary. Another fact to interpret the decline of CI is the decrease of L120 with increasing strain in NR/CB composites (Fig. 8(b)), which is in agreement with previous reports.42,43,49 It can be observed that L120 appears to slightly fluctuate in composites without AE with increasing strain, which indicates that the increase in crystallinity is because of the increased number of crystallites.41 However, L120 is increased with the increase of AE at λ = 3 and it decreases significantly on increasing the strain. The greater the content of AE, the larger is the value of the slope of the curve. The increase of L120 by AE at low strain should be related to the unrestricted rubber chains. The new generated crystallites can be compressed44 easily while stretching for the weakened filler–rubber interaction, due to which the stress is focused on the rubber chain. Then, lateral size of composites L120 is decreased sharply.
Effects of AE on mechanical properties of NR/CB composites
Table 3 compares the impact of different AE on the mechanical properties of NR/CB composites. It can be seen that 100% modulus is increased by adding AE, and the maximum value is obtained when loading AE at 1 phr. 300% modulus of composites appears to be a decreasing tendency when AE exceeds 1 phr and the values are lower than that of blank sample without AE. The increase of 100% modulus should be caused by the augment of physical entanglement points that made a positive effect on CB–NR interaction. On the other hand, the decrease of dispersive free energy on the CB surface caused by AE would take a dominant position compared with the entanglement effect at large strain, such as 300% elongation, where entanglement points could be destroyed, resulting in the reduction of CB–NR interaction. This is the reason for the decline of 300% modulus. Simultaneously, tear strength is increased with the increase of AE until it reaches a threshold value at 2 phr AE, and a degressive trend shows up for the value of elongation at break. However, there is no significantly disciplinary change on tensile strength on increasing AE. Generally, the optimal content of AE for NR/CB composites is 2 phr.
Table 3 Mechanical properties of NR/CB composites modified by AE
| Properties |
Modulus (Mpa) |
Tensile strength (Mpa) |
Elongation at break (%) |
Tear strength (KN m−1) |
| 100% |
300% |
| AE (phr) |
0 |
2.12 ± 0.05 |
12.51 ± 0.22 |
32.12 ± 0.83 |
505 ± 11 |
39.90 ± 1.47 |
| 1 |
2.50 ± 0.04 |
12.75 ± 0.14 |
30.20 ± 1.33 |
486 ± 16 |
46.35 ± 1.17 |
| 2 |
2.33 ± 0.03 |
12.00 ± 0.16 |
31.13 ± 0.95 |
502 ± 8 |
49.32 ± 0.80 |
| 3 |
2.32 ± 0.03 |
11.61 ± 0.04 |
30.77 ± 0.78 |
507 ± 8 |
43.76 ± 0.69 |
| 4 |
2.27 ± 0.08 |
10.97 ± 0.28 |
32.55 ± 0.72 |
537 ± 7 |
43.56 ± 0.95 |
| 5 |
2.16 ± 0.07 |
10.38 ± 0.17 |
31.88 ± 0.38 |
542 ± 9 |
36.67 ± 1.29 |
Effects of AE on dynamical properties of NR/CB composites
Rolling power loss, L, and temperature raise of NR/CB composites were investigated and the results are shown in Fig. 9. It can be seen that L is decreased firstly while increasing AE until it gets the minimum value at AE of 2 phr. With the increase of AE, temperature raise also decreases slightly until it obtains a threshold value at AE is 2 phr. Therefore, the optimized ratio for AE in NR/CB composites is 2 phr. The increase of L and the temperature raise should be caused by the weakened CB–rubber interaction. The increase of entanglement points might be responsible for the slight decrease of L and temperature raise, which has a positive effect on CB–rubber interaction and a negative influence on CB–CB interaction.
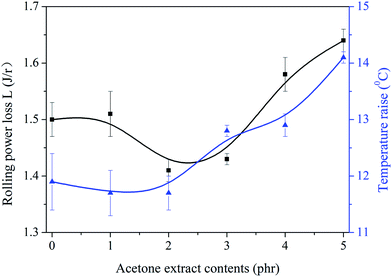 |
| | Fig. 9 Influence of AE on rolling power loss and temperature raise of NR/CB composites. | |
Compression fatigue heat production and DIN abrasion volume were characterized, and the results are shown in Fig. 10. It is observed that heat production decreases slightly with the increase of AE until it achieves a threshold value at AE of 2 phr. This is correlated well with the results in Fig. 9. DIN abrasion volume is significantly decreased on increasing AE and it obtains its minimum value when AE is 4 phr. Although a decline in DIN abrasion volume is seen, the difference is not significant. Generally, the optimized ratio of AE is 2 phr.
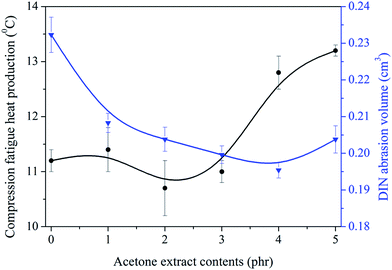 |
| | Fig. 10 Influence of AE on compression heat production and abrasion resistance of NR/CB composites. | |
Above all, two ambivalent aspects influenced the CB–rubber interaction. One is the positive effect of AE on the formation of entanglement points, which improved the CB–rubber interaction. The other is the decrease of dispersive free energy (γds) on the CB surface via adding AE that reduced the CB–rubber interaction. The latter should be the dominant factor when the content of AE exceeded 2 phr where the optimal dynamic properties of NR/CB composites were obtained. The mechanism of CB–rubber interactions are shown in Fig. 11.
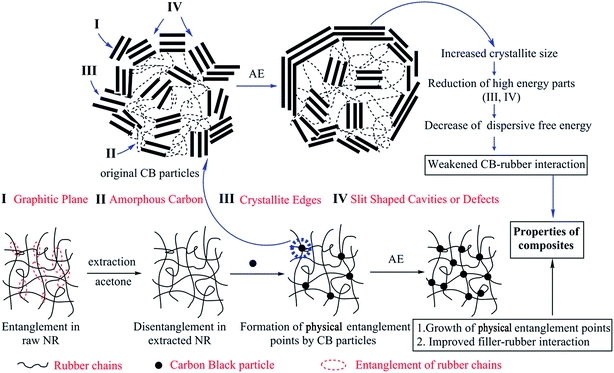 |
| | Fig. 11 Mechanism of CB–rubber interaction influenced by AE. | |
Conclusions
In summary, the influence of acetone extract (AE) from natural rubber on the interface structure and mechanical properties of NR/CB composites were investigated. Raman spectrum and XRD representation illustrated that crystallite size of CB was increased in NR matrix, and it became a larger value when AE was added. The result induced a decrease of the dispersive free energy (γds) on CB surface, which led to the reduction of CB–NR interaction. These phenomena were also proven by the decrease of constrained regions of NR/CB composites. Simultaneously, AE could improve the contact between CB and NR that increased the number of entanglement points and resulted in the promotion of CB–NR interaction. The two contradictory aspects affected the application properties of NR/CB composites. Generally, the optimized content of AE in NR/CB composites is 2 phr where the optimal mechanical and dynamical properties are obtained. On the other hand, AE might affect the strain-induced crystallization behaviors of NR/CB composites by decreasing the crystallization index (CI). Our study clearly disclosed the relationship between AE and structural variation or application performance of NR/CB composites firstly, which is useful to the improvement of theoretical research for NR. It might also make sense to the cultivation of Hevea brasiliensis concerning the content of AE, or how to control an appropriate content of AE to meet the needs of the market. Simultaneously, the reduction of rolling resistance of NR/CB composites when AE was added at 2 phr is very valuable to the development of green tyres, which could significantly decrease atmospheric pollution.
Acknowledgements
The authors thank the financial support from the National Basic Research Program of China, Grant No. 2015CB654700 (2015CB674703), Special Fund for Agro-scientific Research in the Public Interest from the Ministry of Agriculture, China (201403066) and National Key Technology R & D Program of China (2012BAE01B03).
References
- S. Rolere, S. Liengprayoon, L. Vaysse, J. Sainte-Beuve and F. Bonfils, Polym. Test., 2015, 43, 83–93 CrossRef CAS.
- A. Nimpaiboon, S. Amnuaypornsri and J. Sakdapipanich, Polym. Test., 2013, 32, 1135–1144 CrossRef CAS.
- E. Ehabé, F. Bonfils, C. Aymard, A. K. Akinlabi and J. S. Beuve, Polym. Test., 2005, 24, 620–627 CrossRef.
- S. Toki, B. S. Hsiao, S. Amnuaypornsri and J. Sakdapipanich, Polymer, 2009, 50, 2142–2148 CrossRef CAS.
- A. Nimpaiboon and J. Sakdapipanich, Polym. Test., 2013, 32, 1408–1416 CrossRef CAS.
- R. F. A. Altman, Ind. Eng. Chem., 2002, 40, 241–249 CrossRef.
- T. Xu, Z. Jia, Y. Luo, D. Jia and P. Zheng, Appl. Surf. Sci., 2015, 328, 306–313 CrossRef CAS.
- U. Sookyung, C. Nakason, N. Venneman and W. Thaijaroend, Polym. Test., 2016, 54, 223–232 CrossRef CAS.
- B. Zhong, Z. Jia, Y. Luo, B. Guo and D. Jia, Composites, Part A, 2015, 73, 63–71 CrossRef CAS.
- H. Yingpin, Natural Rubber Processing, Hainan press, Haikou, 2007 Search PubMed.
- B. Wang, The effects of the Properties of Nature Rubber after Ozone Aging under different Production Processes and Components, Hainan University, 2015 Search PubMed.
- L. Ma, Extraction and Analysis of Acetone Extract from Natural Latex and its Effects on Properties of Rubber, Hainan University, 2011 Search PubMed.
- L. Fan, Extraction and Analysis of Water-soluble Substance in Natural Rubber Latex and its Effects on Properties of Natural Rubber, Hainan University, 2013 Search PubMed.
- W. Thongruang, B. Nooklay, P. Bunnaul, R. J. Spontak, P. Smithmaitrie and K. Chetpattananondh, Adv. Mater. Res., 2013, 844, 309–313 CrossRef.
- H. Xu, J. Han, F. Liang, X. Zhang and C. Wu, Acta Polym. Sin., 2007, 007, 785–789 CrossRef.
- W. Wongsorat, N. Suppakarn and K. Jarukumjorn, Adv. Mater. Res., 2011, 264–265, 646–651 CrossRef CAS.
- H. Ismail, S. Z. Salleh and Z. Ahmad, J. Elastomers Plast., 2013, 45, 445–455 CrossRef CAS.
- D. Fragiadakis and P. Pissis, J. Non-Cryst. Solids, 2007, 353, 4344–4352 CrossRef CAS.
- A. Sargsyan, A. Tonoyan, S. Davtyan and C. Schick, Eur. Polym. J., 2007, 43, 3113–3127 CrossRef CAS.
- X. Zhang and L. S. Loo, Macromolecules, 2009, 42, 5196–5207 CrossRef CAS.
- Y. Miwa, A. R. Drews and S. Schlick, Macromolecules, 2006, 39, 3304–3311 CrossRef CAS.
- B. Zhong, Z. Jia, Y. Luo and D. Jia, Compos. Sci. Technol., 2015, 117, 46–53 CrossRef CAS.
- J. Mijović, H. K. Lee, J. Kenny and J. Mays, Macromolecules, 2006, 39, 2172–2182 CrossRef.
- J. P. And and S. C. Jana, Macromolecules, 2003, 36, 8391–8397 CrossRef.
- S. V. And and I. Dranca, J. Phys. Chem. B, 2004, 108, 11981–11987 CrossRef.
- T. Jawhari, A. Roid and J. Casado, Carbon, 1995, 33, 1561–1565 CrossRef CAS.
- Y. R. Smith, D. Bhattacharyya, T. Willhard and M. Misra, Chem. Eng. J., 2016, 296, 102–111 CrossRef CAS.
- M. Pawlyta, J. N. Rouzaud and S. Duber, Carbon, 2015, 84, 479–490 CrossRef CAS.
- P. Lespade, A. Marchand, M. Couzi and F. Cruege, Carbon, 1984, 22, 375–385 CrossRef CAS.
- J. Robertson, Adv. Phys., 1986, 35, 317–374 CrossRef CAS.
- W. Zhu, D. E. Miser, W. G. Chan and M. R. Hajaligol, Carbon, 2004, 42, 1841–1845 CrossRef CAS.
- S. Zhang, L. Wei, H. Gu and Y. Zhu, J. Mater. Sci. Eng., 2006, 24, 337–340 CAS.
- B. E. Warren, J. Chem. Phys., 1934, 2, 551–555 CrossRef CAS.
- J. Biscoe and B. E. Warren, J. Appl. Phys., 1942, 13, 364–371 CrossRef CAS.
- L. Lu, V. Sahajwalla, C. Kong and D. Harris, Carbon, 2001, 39, 1821–1833 CrossRef CAS.
- C. R. Houska and B. E. Warren, J. Appl. Phys., 1955, 25, 1503–1509 CrossRef.
- H. Darmstadt, C. Roy, S. Kaliaguine, G. Xu, M. Auger, A. Tuel and V. Ramaswamy, Carbon, 2000, 38, 1279–1287 CrossRef CAS.
- P. Kowalczyk, K. Kaneko and A. P. Terzyk, Carbon, 2004, 42, 1813–1823 CrossRef CAS.
- A. Schröder, M. Klüppel, R. H. Schuster and J. Heidberg, Carbon, 2002, 40, 207–210 CrossRef.
- J. B. Donnet, E. Custodéro, T. K. Wang and G. Hennebert, Carbon, 2002, 40, 163–167 CrossRef CAS.
- M. Tosaka, Strain-Induced Crystallization of Crosslinked Natural Rubber As Revealed by X-ray Diffraction Using Synchrotron Radiation, Peabody Museum, 2007 Search PubMed.
- L. Qu, G. Huang, Y. Nie, J. Wu, G. Weng and P. Zhang, J. Appl. Polym. Sci., 2011, 120, 1346–1354 CrossRef CAS.
- S. Poompradub, M. Tosaka, S. Kohjiya, Y. Ikeda, S. Toki, I. Sics and B. S. Hsiao, J. Appl. Phys., 2005, 97, 103521–103529 CrossRef.
- Y. Ikeda, Y. Yasuda, K. Hijikata, M. Tosaka and S. Kohjiya, Macromolecules, 2008, 41, 5876–5884 CrossRef CAS.
- N. Candau, L. Chazeau, J. M. Chenal, C. Gauthier and E. Munch, Compos. Sci. Technol., 2015, 108, 9–15 CrossRef CAS.
- N. Candau, L. Chazeau, J. M. Chenal, C. Gauthier, J. Ferreira, E. Munch and C. Rochas, Polymer, 2012, 53, 2540–2543 CrossRef CAS.
- C. T. Schrijvers, K. Stronks, H. D. V. D. Mheen and J. P. Mackenbach, Polymer, 2007, 48, 3801–3808 CrossRef.
- F. Billmeyer Jr, Textbook of Polymer Science, Wiley, 3rd edn, 1984 Search PubMed.
- M. Tosaka, S. Murakami, S. Poompradub, S. Kohjiya, Y. Ikeda, S. Toki, I. Sics and B. S. Hsiao, Macromolecules, 2004, 37, 3299–3309 CrossRef CAS.
|
| This journal is © The Royal Society of Chemistry 2017 |
Click here to see how this site uses Cookies. View our privacy policy here.  Open Access Article
 *a,
Lianghui Wua,
Yongjun Chena,
Yuanfang Luoa,
Demin Jiaa and
Zheng Pengb


![[thin space (1/6-em)]](https://www.rsc.org/images/entities/char_2009.gif) 120 reflections were taken) and Ia is the total integrated intensity of amorphous peaks. K is a constant value of 0.89.43 λ is the wavelength 0.154 nm. β1/2 is the width at half-height of the 120 reflection, and θ is the Bragg angle (half of the scattering angle).
120 reflections were taken) and Ia is the total integrated intensity of amorphous peaks. K is a constant value of 0.89.43 λ is the wavelength 0.154 nm. β1/2 is the width at half-height of the 120 reflection, and θ is the Bragg angle (half of the scattering angle).


