
 Open Access Article
 This Open Access Article is licensed under a
 Creative Commons Attribution 3.0 Unported Licence
Synthesis, growth mechanism, optical properties and catalytic activity of ZnO microcrystals obtained via hydrothermal processing
Edgar Alves Araújo Júnior†
a,
Francisco Xavier Nobre†b,
Giancarlo da Silva Sousaa,
Laécio Santos Cavalcantec,
Maria Rita de Morais Chaves Santosa,
Flavio Leandro Souza†d and
José Milton Elias de Matos† *a
*a
aInterdisciplinary Laboratory of Advanced Materials, LIMAV, Natural Sciences Centre, CCN, Department of Chemistry, Federal University of Piauí, Teresina, Piauí 64049-550, Brazil. E-mail: jmematos@ufpi.edu.br; Tel: +55-086-3215-5840
bLaboratory of Research in Biology and Chemistry, LPBQ, Campus Coari, Federal Institute of Amazonas, IFAM, Road Coari-Itapéua, Coari, Itamaraty, AM 69067-360, Brazil. Tel: +55-097-3561-2470
cGERATEC, Natural Sciences Centre (Centro de Ciências da Natureza), University of State of Piauí (Universidade Estadual do Piauí), Teresina, Piauí 64002-150, Brazil
dNatural and Human Sciences Centre (Centro de Ciências Naturais e Humanas – CCNH), Federal University of ABC (Universidade Federal do ABC), 09210-170 Santo André, SP, Brazil
First published on 3rd May 2017
Abstract
In the present study, typical ZnO microcrystals exhibiting the wurtzite hexagonal crystal structure were produced successfully, characterized by a high degree of crystallinity, via hydrothermal processing at 120, 150 and 180 °C, assisted by N-cetyl-N,N,N-trimethylammonium (CTAB). The samples were characterised by XRD, Raman and infrared, FE-SEM, UV-Vis by diffuse reflectance and photoluminescence (PL). The experimental results confirm that all hydrothermally synthesised ZnO samples were crystallised into a wurtzite hexagonal structure. The ZnO crystals exhibit the morphology of hexagonal columns in the absence and double hexagonal columns in the presence of CTAB. The length and average diameter of the microstructures decrease with increasing processing temperature. It is evident that all the synthesised samples present very similar profiles and band positions in the PL emission spectra, with an emission band in the violet range at approximately 400 nm, a small peak in the UV range at approximately 380 nm, and highly superposed and intense emission bands between 440 and 750 nm (blue to red emission), with a maximum at approximately 610 nm. Furthermore, a nucleation and growth model was proposed to explain the formation of ZnO microcrystals, based on the experimental conditions, that were preferably grown in the [001] direction. In addition, the ZnO exhibited excellent performance in the photocatalytic degradation of rhodamine B (RhB) and methyl orange (MO), achieving 97% and 99% photodegradation of RhB and MO, respectively, when ZnO obtained at 120 °C, in the absence of CTAB, was used as catalyst.
1. Introduction
Zinc oxide (ZnO) is a semiconductor material with a wide band gap (3.37 eV), large exciton binding energy (60 meV) and singular electronic and optical properties that are particularly affected by the morphology and size of the crystals.1,2 Studies have demonstrated the versatility and potential capability of ZnO for a wide range of applications in photonic, photovoltaic and electronic devices, such as light-emitting diodes (LEDs), lasers, UV detectors, transistors and solar cells.3–9 ZnO also exhibits interesting piezoelectric properties that permit its application as transducers and surface acoustic wave (SAW) and bulk acoustic wave (BAW) devices.10,11 Furthermore, especially in the form of powder, ZnO can be applied to pigments,12 photo(catalysts).13,14 and UV radiation attenuators.15 Because of its excellent UV attenuation properties, ZnO can also be used in cosmetics, paints, varnish and plastics.10,16,17 In the last five year, ZnO has gained especial attention as antimicrobial agent5,18 and in cancer therapy due it ability to distinguish between normal and cancers cells.19,20 Additionally, ZnO can be used as an antimicrobial agent.5,18Powder ZnO can be synthesised using various synthesis methods that are well established in the literature, such as zinc oxidation from metallic zinc vapour, through the French or American process,21 decomposition of salts containing zinc,22 spray pyrolysis,23 sol–gel24,25 and coprecipitation.26,27 Most of these methods employ high temperatures up to 1000 °C to crystallise the ZnO phase. In such cases, the high processing temperatures lead to the excessive formation of aggregates in the ZnO powder, which results in little control over the morphology and particle size distribution.10
In turn, the hydrothermal processing crystallises anhydrous materials directly from aqueous solutions at temperatures higher than room temperature, usually between 100 and 300 °C, and pressures higher than normal pressures to obtain a fine powder under the corresponding saturated water vapour pressures.28 Among the various physical and chemical material preparation methodologies (bottom-up), the chemical method for material preparation from an aqueous solution maintained at hydrothermal conditions offers numerous advantages to large-scale production such as: (i) the performance of single-stage synthesis, with no subsequent calcination and grinding; (ii) low aggregation level, (iii) narrow crystallite size distribution; and (iv) high purity with excellent control of morphology and particle size.6,29 This method offers many advantages over the conventional synthesis methods, such as the performance of single-stage synthesis, with no subsequent calcination and grinding, a low aggregation level and a narrow crystallite size distribution, as well as high purity and excellent control of the morphology and particle size.6,29 The hydrothermal processing conditions often result in chemical structures with unique structure defects that cannot be generated using the classical methods, which use very high processing temperatures; therefore, these conditions can result in materials with exclusive properties.30,31 The processing is called solvothermal when water is not used as the solvent and presents the same advantages as the hydrothermal processing method.32 Solvothermal synthesis of materials is normally used when there is the need for strict control of the particle size and shape and avoids premature agglomeration. However, from the economical viewpoint, the synthesis processes at hydrothermal conditions (water as the solvent) involve simpler equipment and fast and efficient residue removal compared with the process performed exclusively in organic solvents.
For instance, control nanomaterial size and morphology has been intensively investigated in terms of photocatalysis application. Among several materials for this purpose ZnO and TiO2 are two of the most popular photocatalysts used for organic pollutant degradation,33–35 water waste treatment,36–39 clean fuel production40–42 and so on. Adhikari et al., showed an effective degradation of methyl orange under visible light irradiation by using a quasi-fibrous morphology of ZnO powder synthesized by combustion process.43 Fang and coworkers44 compared the performance on methyl orange photodegradation using sphere and flower-like ZnO morphology obtained at temperature below 200 °C under hydrothermal condition. The spherical ZnO morphology resulted in a superior photocatalytic activity compared with flower-like ZnO and commercial ones, which was attributed to a higher specific area and existence of more available oxygen vacancies.44 More recently, Wolski et al.45 demonstrated that the high surface area provided by the spherical zinc oxide morphology is less important than crystallinity degree and defect density towards the photodegradation efficiency of rhodamine B. Therefore, a sufficient area should be required to guarantee the total photodegradation of the rhodamine B, otherwise only partial conversion of the pollutant can be reach in a short period of irradiation. Indeed, the photocatalytic activity is governates by a compromise in between synthetic method and final properties by a fine control of several parameters such as, size, morphology, surface area, defect density, etc. Based on the literature report history seems that the key factor for higher photocatalytic activity is not the same for the available materials, which open avenues for intensive and detailed investigation in this field to achieve a better method and material for this application.8–45
In the present study, surfactant-assisted hydrothermal processing was applied for the synthesis of ZnO microcrystals at mild temperatures. The N-cetyl-N,N,N-trimethylammonium bromide (CTAB) cationic tensioactive has been used in hydrothermal synthesis to favour the growth and orientation of ZnO crystals,46 and in this study, its effect on the morphology and size of ZnO microcrystals is investigated. The ZnO wurtzite phase is not centrosymmetric, as it exhibits polar crystalline faces,47 which is significant for crystal growth. For various applications, the structure of ZnO should be investigated, and its growth behaviour should be controlled. The growth pattern, size and morphology of the ZnO crystal structures obtained by the hydrothermal method are usually affected by the pH, presence of additives, processing temperature and concentration of reagents.48 We also evaluated the photocatalytic activity of ZnO in degradation of rhodamine B (RhB) and methyl orange (MO) under visible light irradiation.
2. Experimental
2.1. ZnO synthesis by the hydrothermal method
The ZnO crystals were synthesised by the hydrothermal method in alkaline medium. The starting materials were as follows: zinc acetate dihydrate (ZAD) [Zn(CH3COO)2·2H2O] (>98%, Vetec), sodium hydroxide [NaOH] (97%, Sigma-Aldrich), CTAB [C19H42BrN] (>99%, Vetec) and distilled water. All the reagents were of analytical grade and were used with no previous purification.Approximately 6.0 g of ZAD and 4.5 g of CTAB were weighed and transferred to stainless steel-coated polytetrafluoroethylene (PTFE) autoclaves with screw lids. Next, 100 mL of 0.3 M NaOH solution was added, and manual agitation was performed using a glass stirring rod for 10 min. Then, the autoclaves were sealed with proper lids and transferred to an oven (Quimis, Q819V), where they remained for 24 h at different temperatures (120, 150 and 180 °C). After the reaction period, the solutions were washed with distilled water and ethyl alcohol (95%, Vetec) in a centrifuge (Sigma, 3-16L) at 3000 rpm. The samples were dried in an oven (Odontobras, EL 1.1) at 75 °C for approximately 8 h.
2.2. Characterisation
The samples were characterised by X-ray diffraction (XRD) using a Shimadzu diffractometer, model XRD6000 (Japan) using Cu-Kα radiation (λ = 1.54056 Å) at 40 kV and 30 mA. The tests were performed with a step size of 0.02° between 10 and 110° (2θ) with a scan rate of 0.5° per minute in continuous mode. The XRD patterns of the samples were refined using the Rietveld method using the DBWSTools program. The refinement procedure consisted primarily of adjusting the displacement parameters of the sample relative to the crystal plane, background, scale factor, full-width at half-maximum of the diffraction peak (W), asymmetry factor, peak profile (NA and NB), lattice parameters (a, b, c; α, β, γ), possible preferential orientation, atomic positions (x, y, z), isotropic or anisotropic thermal parameters, and instrumental parameters (U and V). The special atomic positions were not refined as they are intrinsic parameters of the sample.The Raman spectra were collected using a Bruker Senterra monochromator (Germany) coupled to an Olympus BX50 microscope, connected to a CCD (charge-coupled device) detector, with automatic resolution adjustment at 0.1 cm−1. The readings were performed at room temperature from 35 to 1555 cm−1 using a laser with an excitation wavelength of 532 nm, with output power of 20 mW and an integration time of 10 s. The measurements in the infrared (IR) region were obtained using a Bruker spectrometer, model Vertex 70 (Germany) in the range from 4000 to 400 cm−1, with 32 scans for each measurement and a resolution of 4 cm−1.
The morphology of the ZnO particles was investigated using field-emission scanning electron microscopy (FE-SEM) using an FE-SEM-FEI microscope, model Inspec F-50. From the FE-SEM images, the particle size distribution was estimated, and the morphology was examined.
Diffuse reflectance (R) UV-Vis spectra were registered using a Varian spectrophotometer, model Cary 5G (United States), with wavelengths ranging between 200 and 800 nm. Magnesium oxide (MgO) was used as the reference material, and a special sample holder was adapted for powders. The photoluminescence (PL) measurements were performed in a Monospec 27 monochromator from Thermal Jarrel Ash (United States), coupled to a R446 photomultiplier from Hamamatsu Photonics (Japan), with an SR-530 lock-in acquisition system. A krypton ion laser of 350.7 nm from Coherent Innova 90 K (United States) was used as the excitation source, maintaining its maximum power at 200 mW.
2.3. Photocatalytic activity
The photocatalytic experiments were conducted using 100 mL of dye solution (RhB and MO) at a concentration of 1.0 × 10⁻⁵ mol L−1, added in a quartz reactor 600 mL under magnetic stirring and an average temperature of 25.0 ± 0.5 °C. Subsequently, inserted for each catalytic test, 100 mg of the catalyst, which remained under magnetic stirring for 5 minutes, followed by stirring in an ultrasound tub Cristófoli mark A52243ZZZ110V code, with a frequency of 42 kHz for 10 minutes in order to obtain the adsorption equilibrium in solution. The emulsion obtained was inserted in a photocatalytic system consisting of a wooden box with two coupled microfan (1.5 A and 12 V), six UVC lamps (Osram 15 W) with a wavelength of 253.7 nm, a magnetic stirrer and an aquarium pump with a flow rate of 1.8 L min−1. The monitoring of catalytic activity was carried out by removing 4 mL of the solution followed by centrifugation of 5000 rpm for 10 minutes, analyzing the wavelength of maximum absorption of the supernatant, the latter being 554 nm and 465 nm, corresponding to RhB dyes and MO, respectively. Operating a spectrophotometer brand Thermo Scientific GENESYS 10S model, conducting sweeps in the range of 200 nm to 900 nm, with 10 nm s−1 by adding solutions in quartz cuvettes.3. Results and discussion
3.1. XRD and Rietveld refinement
Fig. 1 presents the diffractograms of the ZnO microcrystals synthesised by the hydrothermal method for 24 h at 120, 150 and 180 °C, with and without the assistance of CTAB. The position of the peaks in all the diffractograms presented in Fig. 1 have the same pattern, regardless of the preparation conditions of the ZnO powder. This pattern confirms that the crystal structure of the samples is hexagonal (wurtzite), with C6ν4 or P63mc spatial group and crystallographic class 6 mm, according to the respective crystallographic card ICSD no. 34477 (ICSD = Inorganic Crystal Structure Database).49 Intermediate crystal phases were not observed, indicating the high purity of these materials obtained in a single stage at hydrothermal conditions. The presence of defined and intense peaks indicates that the ZnO powders exhibit high crystallinity (structural periodicity) and are structurally ordered at a long distance.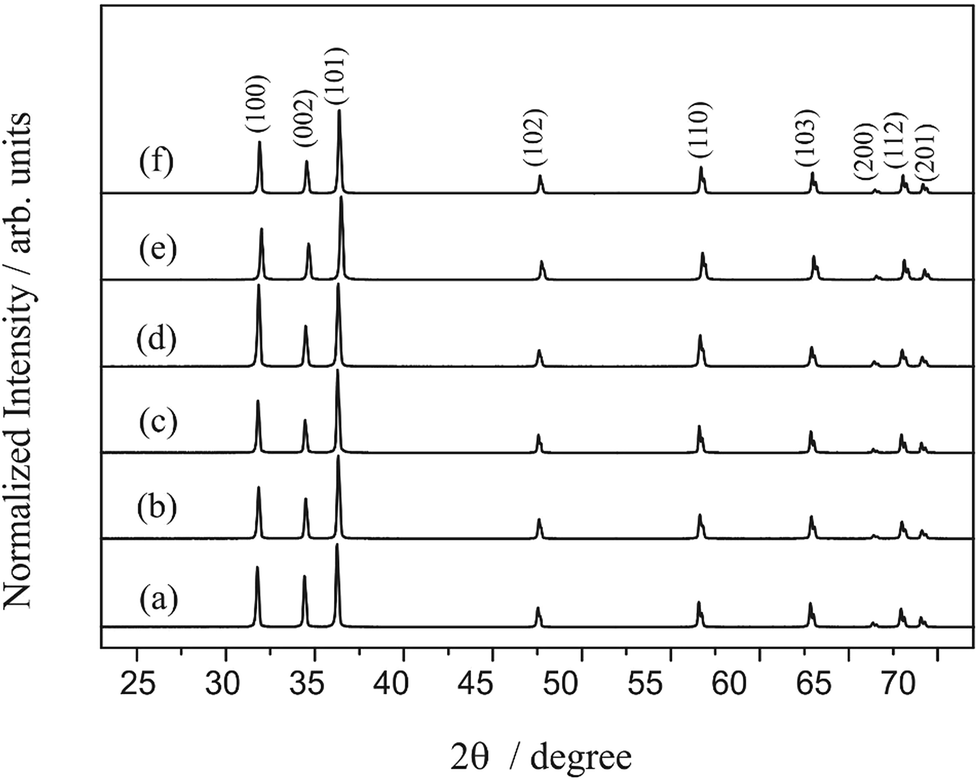 | ||
| Fig. 1 XRD patterns of ZnO synthesized hydrothermally for 24 h at 120 °C (a) without and (b) with CTAB, at 150 °C (c) without and (d) with CTAB, and at 180 °C without (e) and (f) with CTAB. | ||
Once the crystallography phase ZnO was confirmed, the XRD results underwent the refinement process by the Rietveld method using the DBWS Tools software interface. The data on crystallographic pattern profiles of the wurtzite phase is available on the Capes Research Website50 from the International Center for Diffraction Data (ICDD). The ICSD no. 34477 (ref. 49) card was used.
Table 1 presents the lattice parameters and the unit cell volume of the ZnO samples, which were calculated after the structural refinement and compared with the data reported in the literature.51–57 The slight variations on the experimental results may be related to the different types of synthesis methods and experimental conditions, such as the processing temperature, heating rate, reaction time, atmosphere, solvent, etc., which, consequently, may generate different levels of long-range structural organisation in the hexagonal lattice.
| T (°C) | t (h) | Lattice parameters (Å) | V (Å3) | JCPDS | Ref. | ||
|---|---|---|---|---|---|---|---|
| a = b | c | ||||||
| a T = temperature; t = processing time; a, b, c = lattice parameters; V = unit cell volume; JCPDS = Joint Committee on Powder Diffraction Standards; ICSD = Inorganic Crystal Structure Database; Ref. = reference; pH = pH value; CT = presence or absence of CTAB (cetyl trimethylammonium bromide); N = no; Y = yes; HT = hydrothermal; SG = sol–gel; CP = coprecipitation; BK = bulk. | |||||||
| Synthesis methods | |||||||
| HT | 140 | 24 | 0.3249 | 0.5206 | — | 36-1451 | 32 |
| HT | 150 | 24 | 0.3249 | 0.5206 | — | 36-1451 | 51 |
| HT | 140 | 12 | 0.3242 | 0.5188 | — | 79-0205 | 52 |
| SG | 80 | 24 | 0.324 | 0.519 | 54.5 | 36-1451 | 24 |
| HT | 140 | 12 | 0.3251 | 0.5206 | — | 79-2205 | 53 |
| HT | 180 | 24 | 0.3249 | 0.5205 | — | 75-0576 | 46 |
| HT | 120 | 5 | 0.32508 | 0.52069 | — | 36-1451 | 54 |
| CP | 60 | 2 | 0.3250 | 0.5207 | — | 36-1451 | 55 |
| T (°C) | t (h) | Lattice parameters (Å) | V (Å3) | JCPDS | CTAB | ||
|---|---|---|---|---|---|---|---|
| a = b | c | ||||||
| This study | |||||||
| HT | 120 | 24 | 0.3251 | 0.5207 | 47.66 | 36-1451 | No |
| HT | 120 | 24 | 0.3252 | 0.5207 | 47.70 | 36-1451 | Yes |
| HT | 150 | 24 | 0.3252 | 0.5209 | 47.70 | 36-1451 | No |
| HT | 150 | 24 | 0.3250 | 0.5208 | 47.65 | 36-1451 | Yes |
| HT | 180 | 24 | 0.2513 | 0.5209 | 47.69 | 36-1451 | No |
| HT | 180 | 24 | 0.3250 | 0.5207 | 47.64 | 36-1451 | Yes |
The complete results of the structural refinement by the Rietveld method are presented in Table 2, with the following Rietveld refinement results: density and unit cell volume, atomic positions (x, y, z) and refinement quality indexes (Rp, Rwp, Rexp, and S). Table 2 presents the numerical quality indicators of structural refinement using the Rietveld method. S parameter values smaller than 2 indicate satisfactory refinement;58 the samples maintained at 180 °C in hydrothermal conditions exhibited values of S = 1.88 and 1.95, with and without the assistance of CTAB, respectively.
| Atoms | Wyckoff | Sites | x | y | z |
|---|---|---|---|---|---|
| 120 °C, CTAB: no | |||||
| Zinc | 2b | 3m | 0.3333 | 0.6667 | 0 |
| Oxygen | 2b | 3m | 0.3333 | 0.6667 | 0.3917 |
| Density = 5.667 g cm−3; Rp = 9.56%; Rwp = 12.28%; Rexp = 5.14% and S = 2.39 | |||||
![[thin space (1/6-em)]](https://www.rsc.org/images/entities/char_2009.gif) |
|||||
| 120 °C, CTAB: yes | |||||
| Zinc | 2b | 3m | 0.3333 | 0.6667 | 0 |
| Oxygen | 2b | 3m | 0.3333 | 0.6667 | 0.3857 |
| Density = 5.674 g cm−3; Rp = 7.06%; Rwp = 10.15%; Rexp = 5.29% and S = 1.92 | |||||
|
|||||
| 150 °C, CTAB: no | |||||
| Zinc | 2b | 3m | 0.3333 | 0.6667 | 0 |
| Oxygen | 2b | 3m | 0.3333 | 0.6667 | 0.3818 |
| Density = 5.667 g cm−3; Rp = 7.45%; Rwp = 11.12%; Rexp = 5.28% and S = 2.10 | |||||
|
|||||
| 150 °C, CTAB: yes | |||||
| Zinc | 2b | 3m | 0.3333 | 0.6667 | 0 |
| Oxygen | 2b | 3m | 0.3333 | 0.6667 | 0.3960 |
| Density = 5.674 g cm−3; Rp = 12.37%; Rwp = 14.96%; Rexp = 5.04% and S = 2.96 | |||||
|
|||||
| 180 °C, CTAB: no | |||||
| Zinc | 2b | 3m | 0.3333 | 0.6667 | 0 |
| Oxygen | 2b | 3m | 0.3333 | 0.6667 | 0.3806 |
| Density = 5.669 g cm−3; Rp = 6.95%; Rwp = 10.53%; Rexp = 5.59% and S = 1.88 | |||||
|
|||||
| 180 °C, CTAB: yes | |||||
| Zinc | 2b | 3m | 0.3333 | 0.6667 | 0 |
| Oxygen | 2b | 3m | 0.3333 | 0.6667 | 0.3812 |
| Density = 5.674 g cm−3; Rp = 7.02%; Rwp = 10.42%; Rexp = 5.34% and S = 1.95 | |||||
The Rietveld refinement calculations for the ZnO microcrystals hydrothermally processed at 180 °C, with and without the assistance of CTAB, are presented in Fig. 2. The results indicate good agreement between the profiles of the experimental diffractograms and the theoretical data for the ZnO wurtzite structure. The differences between the diffractogram profiles (Yobserved − Ycalculated) are small on the scale of intensity.
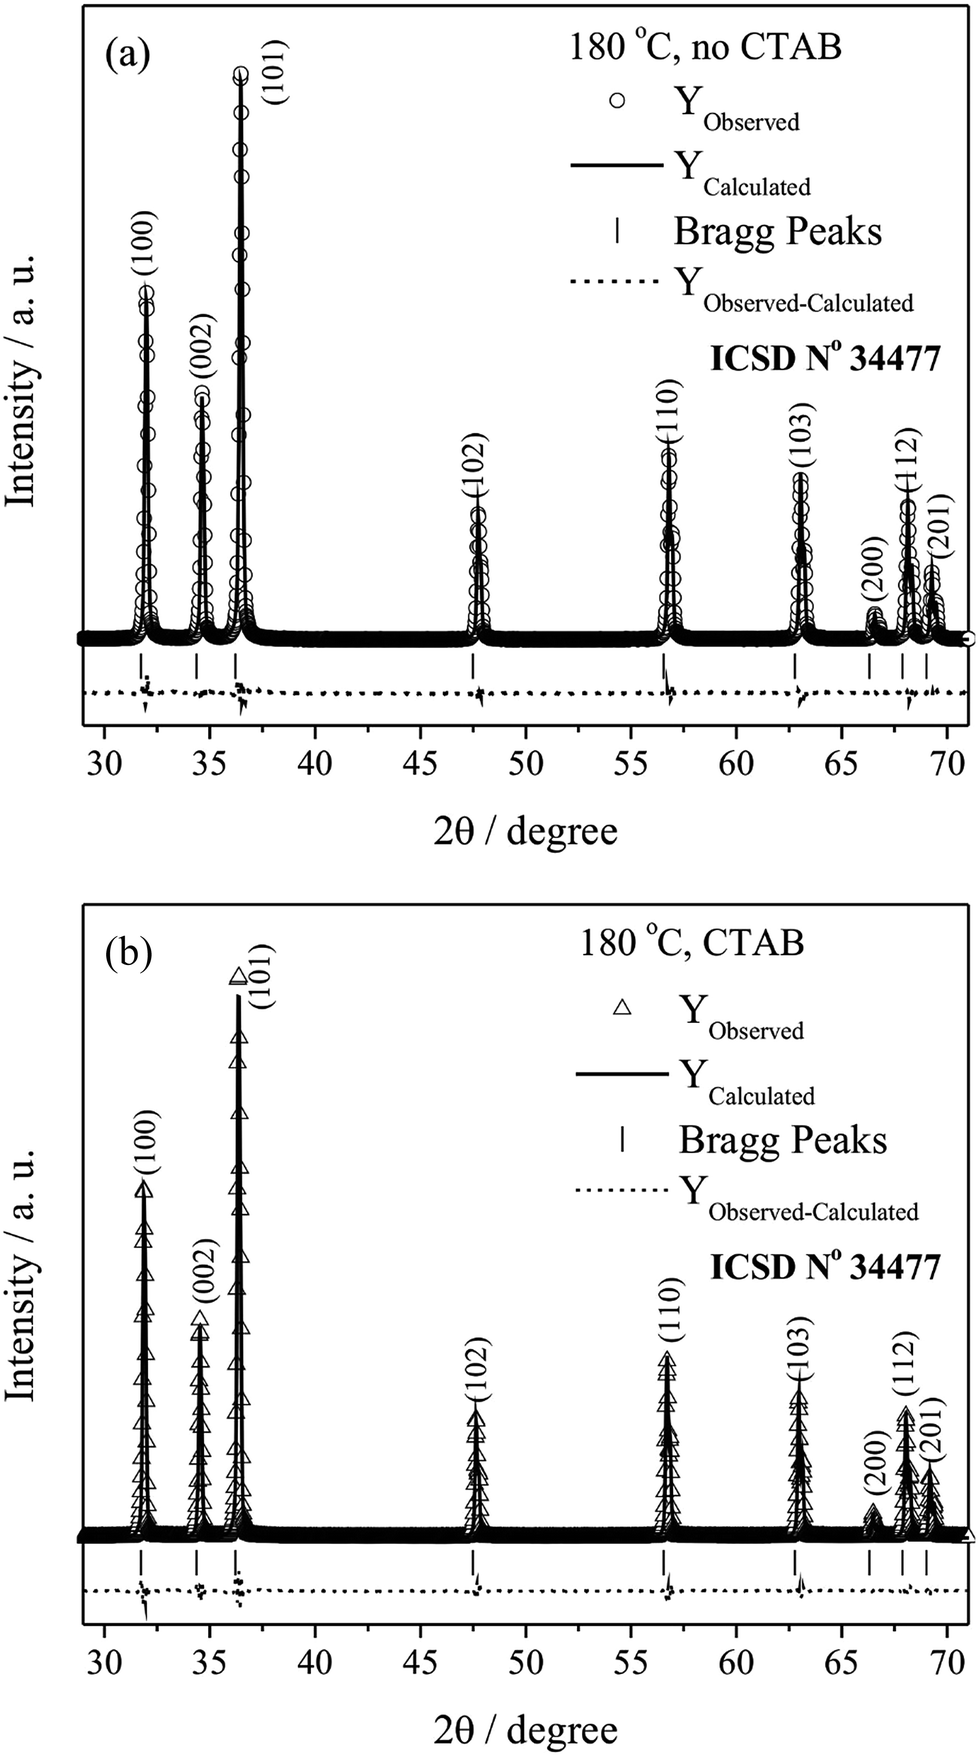 | ||
| Fig. 2 XRD pattern refinements using the Rietveld method of ZnO, (a) without and (b) with the assistance of CTAB, at 180 °C. | ||
In turn, the samples synthesised at 120 and 150 °C, in the presence and absence of CTAB, exhibited high S values because Rexp was smaller. Nevertheless, the refinements can be considered of good quality, as the value of Rexp is lower because of the high intensities. Consequently, the value of S becomes higher than 2 for such cases, which also has been reported in literature (ex.: S = 3.31).59
According to Young,60 although the numerical indicators are important for the refinements by maximum likelihood, it is vital to perform the graph fitting analysis by the line of differences between the observed and calculated data.
3.2. Unit cells representation
Fig. 3 presents schematic representations for the unit cells of the ZnO microcrystals hydrothermally processed at 180 °C for 24 h, with and without the assistance of CTAB, from the structural refinement data obtained using the Rietveld method. The unit cells were modelled using the Diamond Crystal and Molecular Structure Visualisation program, demo version 3.2f for Windows,61 using the atomic coordinates calculated by the Rietveld refinement, displayed in Table 2.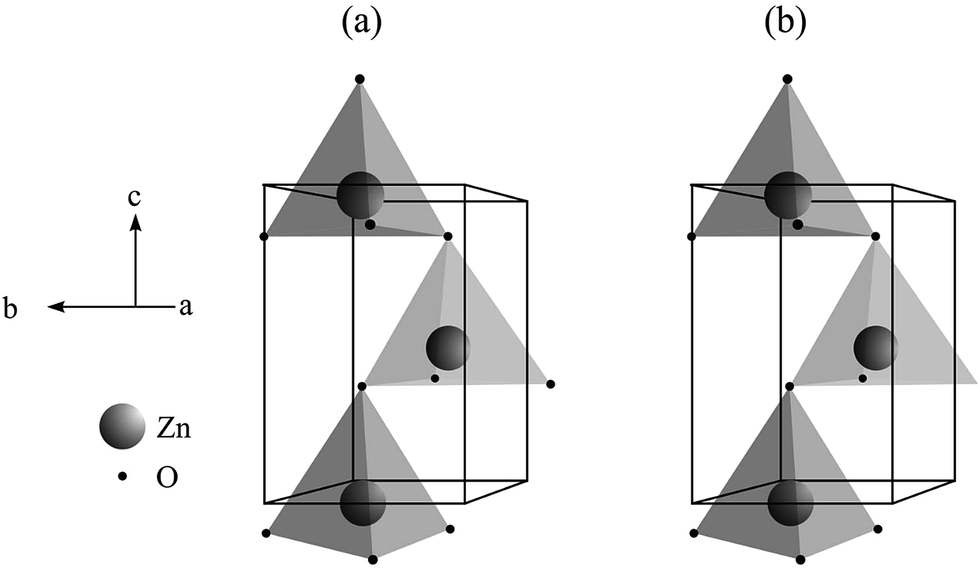 | ||
| Fig. 3 Modeling of unit cells of ZnO microcrystals synthesized hydrothermally at 180 °C, for 24 h (a) without and (b) with CTAB. | ||
Some interesting characteristics are observed in the unit cells presented in Fig. 3, such as: (i) the unit cell contains four atoms, two of each type (Zn and O); each atom is tetrahedrally coordinated in the crystal lattice, with hexagonal symmetry; and (ii) the two types of atoms occupy a sublattice throughout the c axis. In fact, this type of structure is composed by two compact hexagonal sublattices, where the layers occupied by Zn atoms alternate with the layers occupied by O atoms around the c axis. In every sublattice, four atoms are included per unit cell, for instance, each Zn atom is coordinated to four O atoms, or vice versa. Hence, half of the tetrahedral sites are occupied by Zn atoms.
The unit cell volume is approximately 47.6 Å3. Consequently, ZnO contains approximately 8.4 × 10²² atoms per cm3. The synthetically produced ZnO with the wurtzite structure may eventually exhibit a crystallographic arrangement different from the pattern established in the crystallographic records. A characteristic of this type of hexagonal crystalline arrangement is the c/a ratio between the unit cell parameters, which was determined to be 1.63 for the ideal arrangement, considering the atomic positions (x, y, z) and maximum packing.62 Generally, the main reasons that the synthetic materials differ from the ideal arrangement are related to the methodology of preparation, which depends on external factors such as the pressure and temperature, time, and presence of impurities, among others.62 In the real ZnO crystal, the wurtzite structure diverges from the ideal arrangement because the c/a ratio varies. Although the ideal wurtzite structure exhibits a c/a ratio of 1.63,62 the lattice constants of the real ZnO structure depend on impurities, external factors, temperature, etc.
3.3. Raman and IR spectroscopy
The structural lattice of the ZnO wurtzite phase consists of a basic unit of four atoms per unit cell (two Zn–O molecular units). Because of the number n = 4 atoms in the unit cell, the number of phonons is equivalent to 3n = 12, with 3 acoustic modes (1 × LA, 2 × TA) and 3n − 3 = 9 optical phonons (3 × LO, 6 × TO). In the Γ point of the Brillouin zone, the optical phonons have irreducible representation:| Γ(Raman + infrared) = 1A1 + 2B1 + 1E1 + 2E2, | (1) |
Fig. 4 presents the Raman spectra for the ZnO microcrystals synthesised for 24 h at 120, 150 and 180 °C, with and without the assistance of CTAB. The band position, attribution and main Raman modes reported in the literature of ZnO crystals obtained by different synthesis, bulk and theoretical methods are listed in Table 3.5,11,16,26,63–73
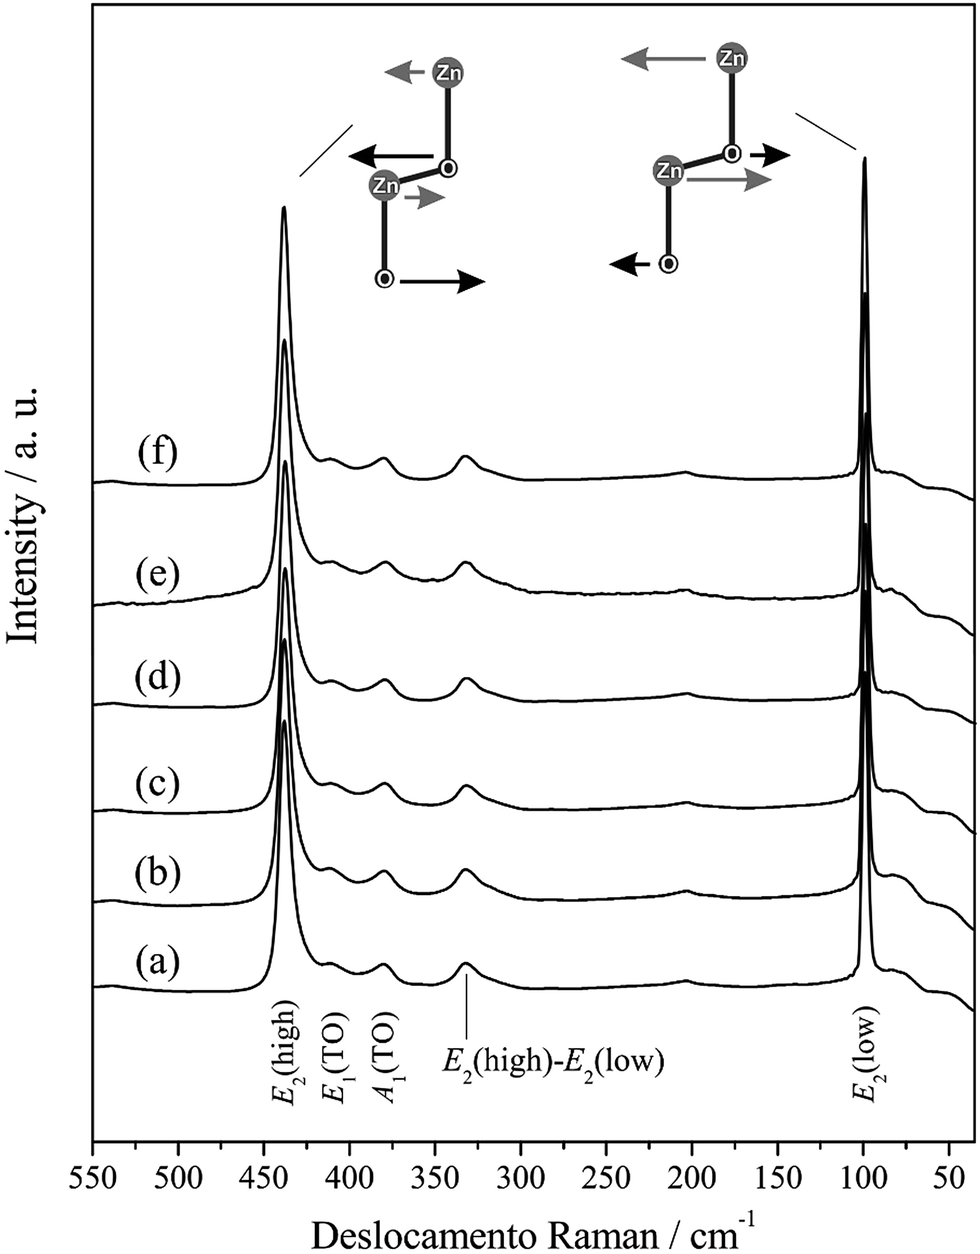 | ||
| Fig. 4 Raman spectra of ZnO processed hydrothermally for 24 h at 120 °C (a) without and (b) with CTAB, at 150 °C (c) without and (d) with CTAB and 180 °C without (e) and (f) CTAB. The E2 modes(low) and E2(high) are shown in figure. | ||
| T (°C) | t (h) | Modes* | Ref. | ||||
|---|---|---|---|---|---|---|---|
| A1(TO) | E1(TO) | E2(low) | E2(high) | ||||
| a T = temperature; t = time; *Raman modes = (cm−1); Ref. = reference; for all the syntheses performed in this study, the reaction time was 24 h; CTAB = presence of cetyl trimethylammonium bromide; CL = charged liquid cluster beam; ET = thermal evaporation; SG = sol–gel; CP = coprecipitation; HT = hydrothermal; MH = hydrothermal microwave; BK = bulk; TR = theoretical. | |||||||
| Synthesis methods | |||||||
| CL | 400 | 2 | 380 | — | 99 | 438 | 63 |
| ET | 900 | 1 | 380 | 407 | 101 | 437 | 64 |
| SG | 550 | 2 | 380 | 414 | — | 440 | 65 |
| SG | 750 | 2 | 380 | — | — | 435 | 66 |
| CP | 120 | 2 | 380 | 418 | — | 438 | 26 |
| HT | 120 | 72 | 382 | 409 | 102 | 440 | 5 |
| HT | 130 | 24 | 381 | — | — | 438 | 11 |
| HT | 80 | 20 | 385 | — | — | 439 | 67 |
| HT | 200 | 10 | 383 | — | — | 438 | 16 |
| MH | 130 | 3 | 378 | — | — | 437 | 68 |
|
|||||||
| Bulks | |||||||
| BK | — | — | 379 | 410 | 102 | 437 | 69 |
| BK | — | — | 380 | 407 | 101 | 437 | 70 |
| BK | — | — | 380 | 413 | 101 | 444 | 71 |
|
|||||||
| Theoretical | |||||||
| TR | — | — | 386 | 407 | 98 | 433 | 72 |
| TR | — | — | 382 | 316 | 126 | 335 | 73 |
| T (°C) | t (h) | Modes* | CTAB | ||||
|---|---|---|---|---|---|---|---|
| A1(TO) | E1(TO) | E2(low) | E2(high) | ||||
| This study | |||||||
| HT | 120 | 24 | 380 | 411 | 99 | 438 | No |
| HT | 120 | 24 | 380 | 412 | 99 | 438 | Yes |
| HT | 150 | 24 | 380 | 411 | 99 | 438 | No |
| HT | 150 | 24 | 379 | 411 | 99 | 437 | Yes |
| HT | 180 | 24 | 379 | 410 | 99 | 438 | No |
| HT | 180 | 24 | 380 | 411 | 99 | 438 | Yes |
The modes present in the Raman spectra of the ZnO samples investigated in this study were attributed to the wurtzite crystal structure. The intense E2(low) band, approaching 100 cm−1, is attributed to the vibrations of the Zn sublattice in the ZnO structure. The bands close to 330 and 380 cm−1 are attributed to modes E2(high) − E2(low) (second-order acoustic) and A1(TO), respectively. Almost unnoticeable, the weak band approaching 200 cm−1 refers to mode 2E2(low). An evident and strong peak is present in all the spectra at approximately 440 cm−1, which is characteristic of the scattering of the ZnO hexagonal wurtzite dominant mode E2(high) and is attributed to the vibration of the sublattice of O. Additionally, the literature reports that mode E2(high) exhibits excellent crystallinity74 and acts as a signature of the ZnO wurtzite phase, which demonstrates the good correlation with the XRD data for all the ZnO microcrystals synthesised at hydrothermal conditions.
The samples analysed in this study also presented other signals that are not displayed in Fig. 4, such as a wide band of low intensity that appears right above 550 cm−1, which can be attributed to modes A1(LO) and E1(LO). The appearance of bands A1(LO) and E1(LO) in the Raman spectra of ZnO is caused by the formation of structural faults (oxygen and interstitial zinc vacancies), where mode E1(LO) is more strongly affected by these effects.75 The wide band, which also appeared in the Raman spectra with peaks approaching 1100 and 1150 cm−1, corresponds to 2LO (mode A1).5 Zhao et al.76 reported the possibility of locating a peak at approximately 1350 cm−1, which would indicate three phonons from the Raman scattering processes, A1(TO) + A1(LO) + E2H; however, these peaks do not appear in the Raman spectra of this study.
The information in Table 3 indicates consonance between the Raman modes identified and attributed in this study and other studies published in the literature, although there is a slight displacement in the relative position of some peaks. The small changes observed in the characteristic positions of the Raman modes listed in Table 3 can be associated with the degree of crystallinity, grain size distribution and average crystal size, ionic interaction force, degree of structural order and disorder in the crystal lattice, and the presence of structural defects (oxygen vacancy, distortions and/or tensions in the structure). These alterations are confirmed by the PL spectra. The visible band in the PL spectrum only appears in the presence of defects such as Vo of O2 and interstitial Oi, among others.77,78 Special attention is given to the efficiency of the hydrothermal method used in this study, as the main characteristic Raman modes for the ZnO wurtzite phase were observed as well as peaks that were not exhibited in other studies in the literature, where less energetic and drastic reaction conditions were applied.
IR spectroscopy is a useful and powerful technique adopted for the analysis, confirmation and elucidation of structures of compounds and to identify the functional groups present in the compounds,79 complementing the information obtained from Raman spectroscopy. IR analyses using KBr pellets in transmission mode are displayed in Fig. 5 for the samples hydrothermally processed for 24 h at 180 °C, with and without CTAB.
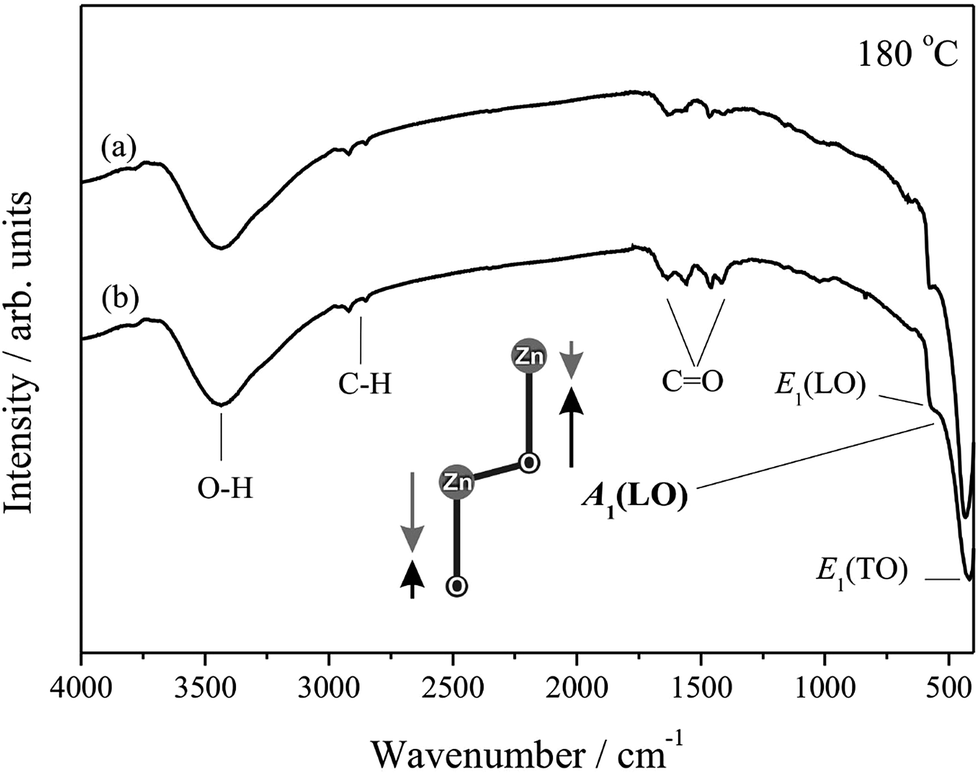 | ||
| Fig. 5 Infrared spectra of samples of ZnO hydrothermally processed for 24 h at 180 °C in the absence (a) and presence (b) CTAB. The A1 mode(LO) is shown. | ||
The IR spectra displayed absorption bands between 3400 and 2900 cm−1, which refer to O–H and C–H vibrations, respectively, where the O–H absorption most likely originates from the atmospheric mixture where the analyses are performed, which adsorbs on the surface of the samples and on the KBr pellets.80 The modes close to 1400 and 1600 cm−1 represent C![[double bond, length as m-dash]](https://www.rsc.org/images/entities/char_e001.gif) O asymmetrical and symmetrical stretching, respectively, and may be associated with the residue from the starting material, Zn(CH3COO)2·2H2O, still present in the final product.81 Nevertheless, emphasis is given to the superposition of bands at approximately 500 cm−1, referent to the Zn–O stretching frequency, which is present in all the samples analysed by IR and is indicative of the high orientation of the ZnO wurtzite crystal structure.79
O asymmetrical and symmetrical stretching, respectively, and may be associated with the residue from the starting material, Zn(CH3COO)2·2H2O, still present in the final product.81 Nevertheless, emphasis is given to the superposition of bands at approximately 500 cm−1, referent to the Zn–O stretching frequency, which is present in all the samples analysed by IR and is indicative of the high orientation of the ZnO wurtzite crystal structure.79
The superposed bands located at approximately 420, 580 and 590 cm−1 are attributed to modes E1(TO), A1(LO) and E1(LO), respectively.82 Another characteristic band of the ZnO wurtzite phase should appear at approximately 380 cm−1, referent to mode A1(TO); however, because of the limitations of the equipment used for the analyses, measurements below 400 cm−1 could not be performed using KBr pellets in transmission mode.
3.4. FE-SEM analyses
The FE-SEM micrographs presented in Fig. 6(a–f) show the morphology of the ZnO microcrystals prepared at 120, 150 and 180 °C for 24 h, with and without CTAB. The FE-SEM micrographs demonstrate the predominance of ZnO microcrystals in the form of hexagonal columns in the absence of CTAB and of double hexagonal columns in the presence of CTAB. Similarly, for the samples synthesised at 180 °C in the presence or absence of CTAB, the shape of the hexagonal columns is different, as the (001) crystal face exhibits a smaller diameter in relation to face (00![[1 with combining macron]](https://www.rsc.org/images/entities/char_0031_0304.gif) ). Hence, these ZnO samples synthesised at 180 °C were analysed using energy dispersive spectroscopy (EDS) to evaluate the chemical composition. The insert in Fig. 6(e and f) shows a typical EDS spectrum of ZnO crystals.16 The result confirms that each crystal is composed of Zn and O (the Au and C peaks originate from elements in the sample holder).
). Hence, these ZnO samples synthesised at 180 °C were analysed using energy dispersive spectroscopy (EDS) to evaluate the chemical composition. The insert in Fig. 6(e and f) shows a typical EDS spectrum of ZnO crystals.16 The result confirms that each crystal is composed of Zn and O (the Au and C peaks originate from elements in the sample holder).
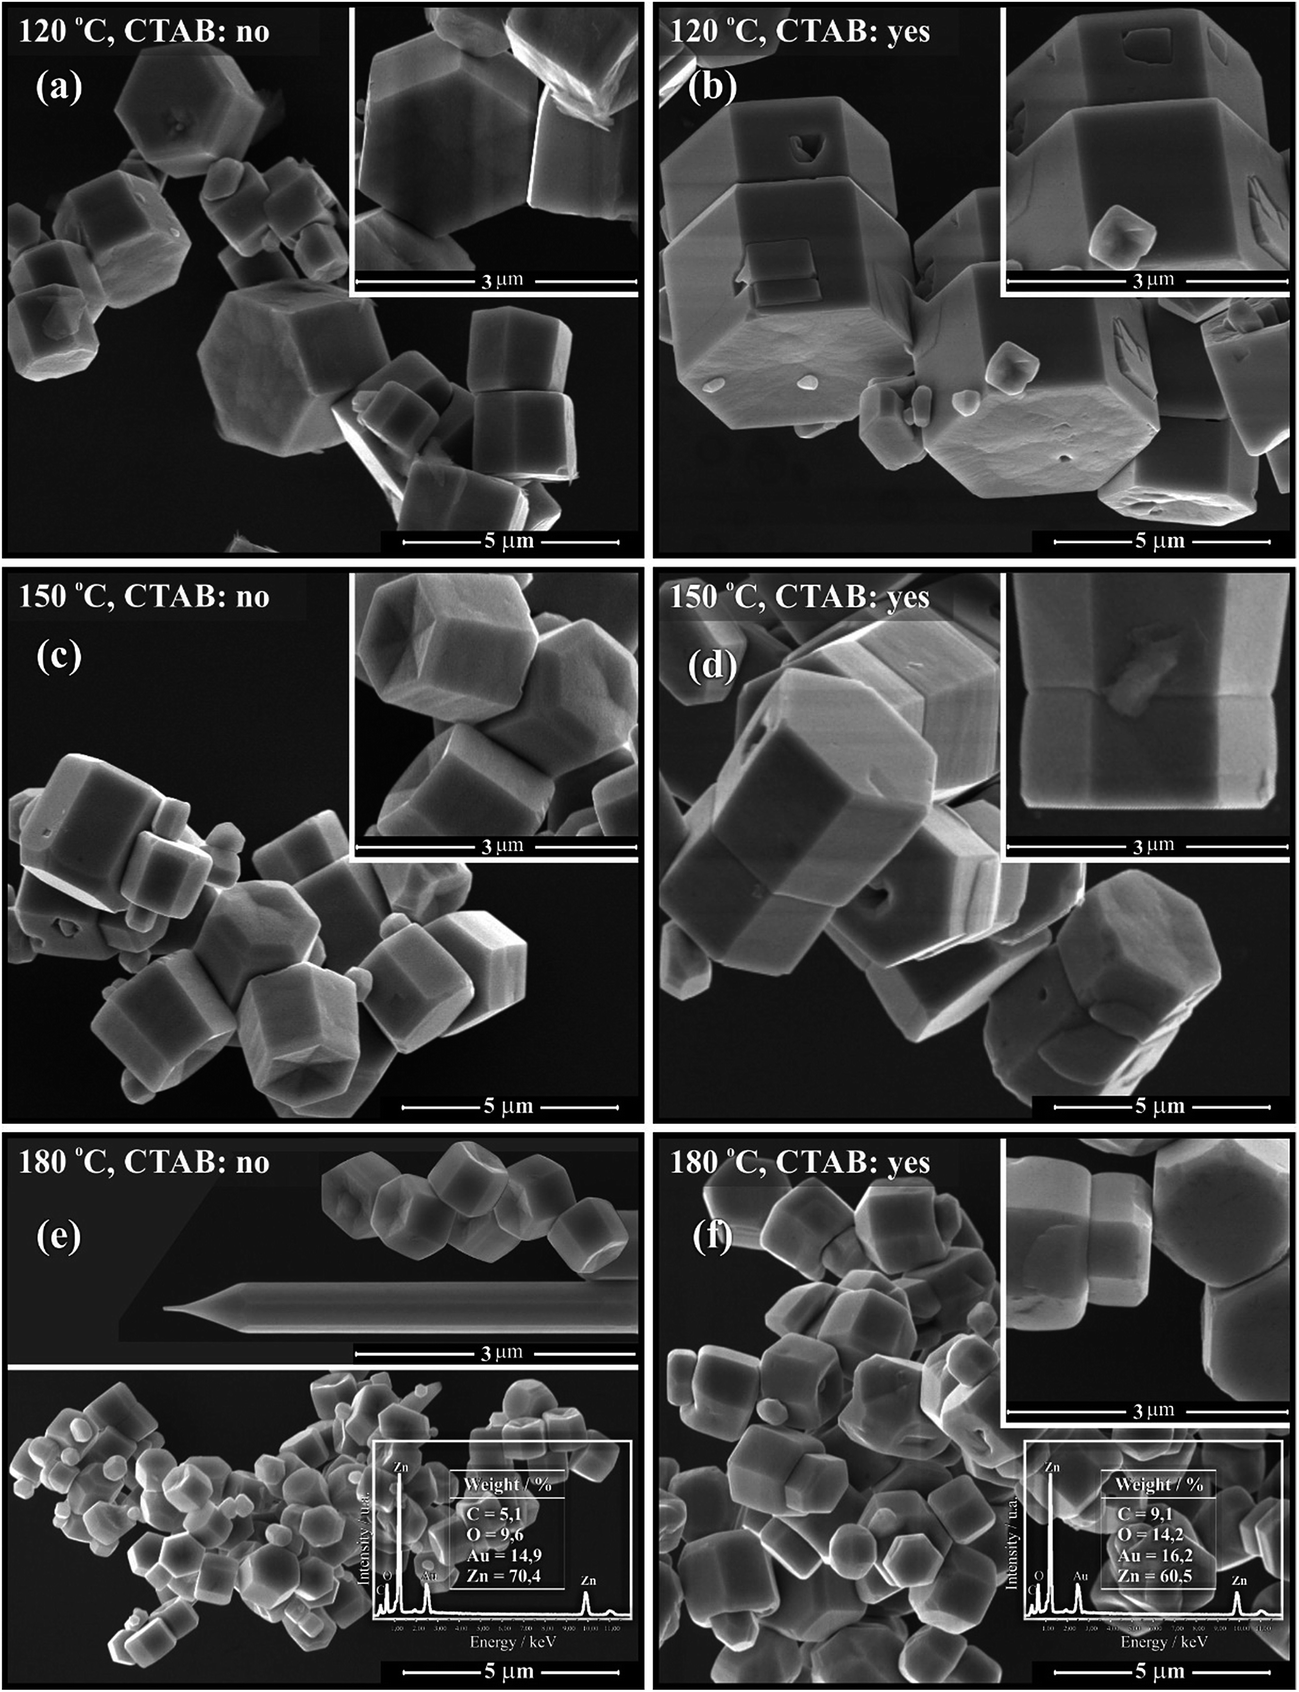 | ||
| Fig. 6 FE-SEM micrographs of ZnO microstructures obtained by hydrothermal processing at 120 °C (a) without and (b) with the assistance of CTAB; at 150 °C (c) without and (d) the assistance of CTAB; and at 180 °C (e) without and (f) with the assistance of CTAB. The energy dispersive spectroscopy (EDS) elemental analysis is displayed as an insertion for the samples obtained at 180 °C (e and f). | ||
Based on the FE-SEM images, the crystal size distribution was estimated considering the average of 100 particles (N = 100) for every one of the synthesised samples in this study, as illustrated in Fig. 7. The size estimations were performed considering each particle individually, including those that exhibited the form of a double hexagonal column, as observed for the samples processed in the presence of CTAB.
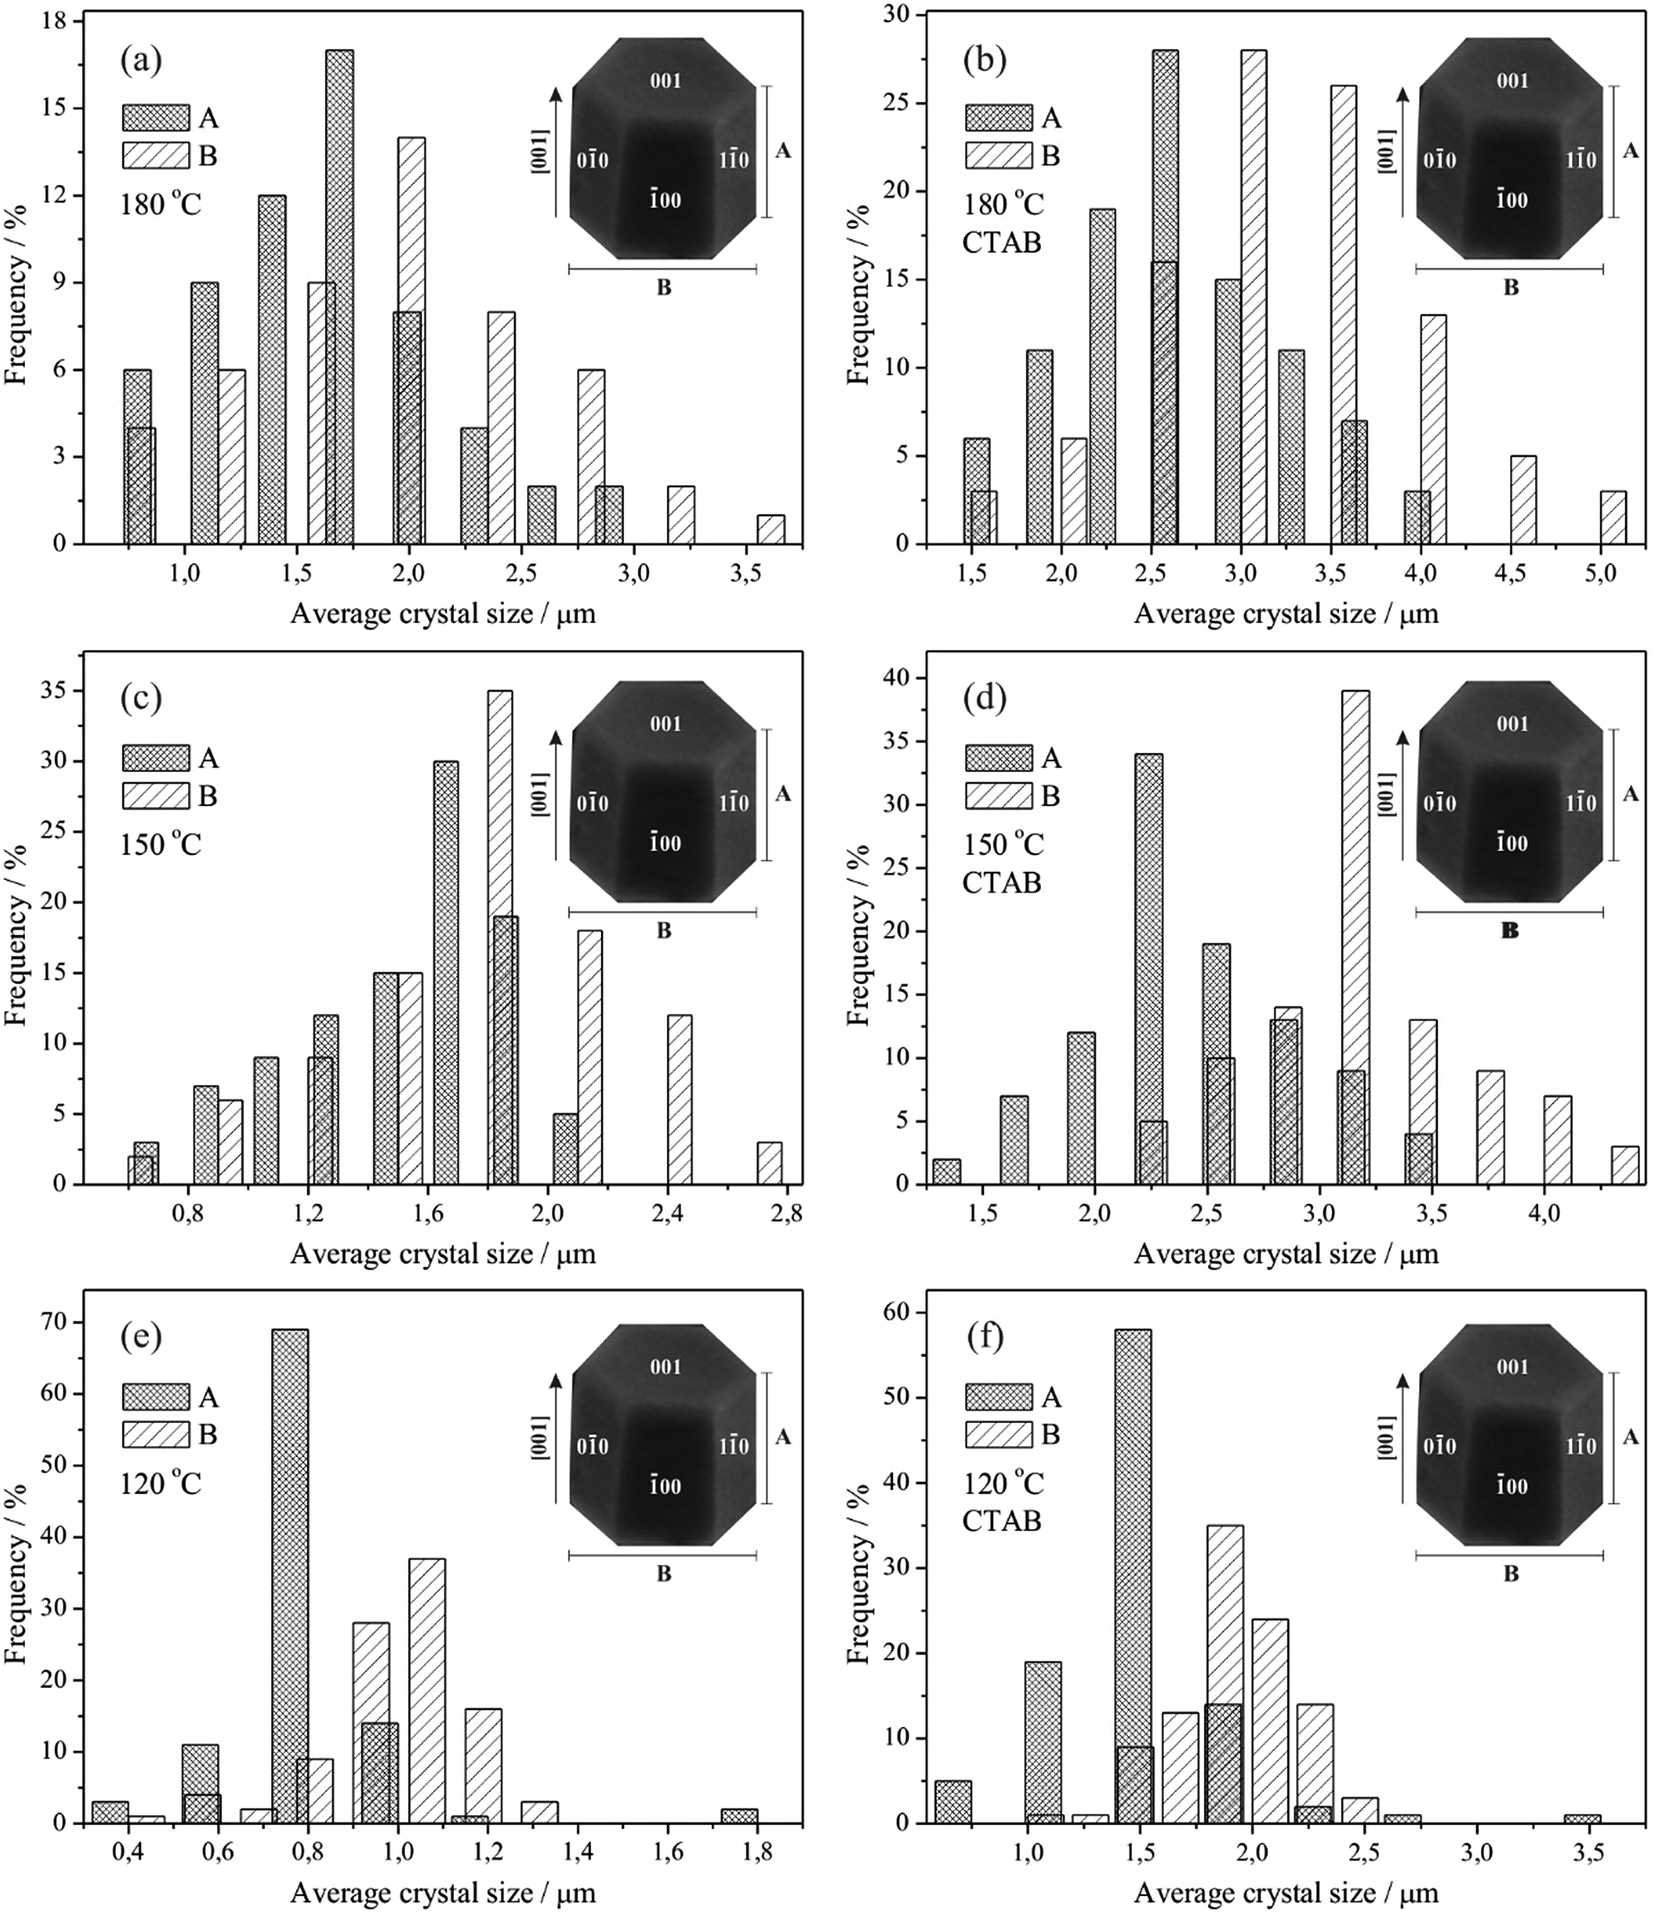 | ||
| Fig. 7 Size distribution of ZnO microcrystals obtained by hydrothermal processing with N = 100 at 120 °C (a) in the absence and (b) presence of CTAB; at 150 °C (c) in the absence and (d) presence of CTAB; and at 180 °C (e) in the absence and (f) presence of CTAB. | ||
The ZnO microcrystals exhibit a polydisperse particle size distribution. Fig. 7 shows the tendency of reduction in the average size of individual microcrystals with an increase in temperature from 95 to 97% (without CTAB) and from 74 to 77% (with CTAB). The reduction of the average size is more evident in the samples prepared at 180 °C. Additionally, the presence of CTAB affects the growth of the ZnO microcrystals, where, for the same processing conditions, the average size of individual microcrystals was between 46 and 93% larger.
Recently, different ZnO morphologies, such as rods, flowers, spheres, disks, and hexagonal columns, have been synthesised using different methods, as displayed in Table 4.2,5,11,16,27,46,68,83–96 Various methods can be used to obtain ZnO crystal structures; however, the hydrothermal approach from aqueous solutions offers advantages, such as the low processing temperature and the use of simple material, its appropriateness for large-scale application and economic advantages.83
| Reagents | M | T (°C) | t (h) | Form | Size (μm) | Ref. |
|---|---|---|---|---|---|---|
| a M = method; T = temperature; t = time; size = size; Ref. = reference; CC = calcination; SG = sol–gel; TM = thermolysis; ST = solvothermal; HT = hydrothermal; HM = hydrothermal microwave; CP = coprecipitation; Zn(NO3)2 = zinc nitrate; Zn(CH3COO)2 = zinc acetate; ED = ethylenediamine; HMT = hexamethylenetetramine; (NH4)2CO3 = ammonium carbonate; CTAB = cetyl trimethylammonium bromide; C2H6O = ethanol; NaOH = sodium hydroxide; KOH = potassium hydroxide; Zn = zinc powder; (NH4)2S2O8 = ammonium peroxodisulphate; C6H12 = cyclohexane; C4H10O = n-butanol; (CH2)6N4 = methenamine; ZnCl2 = zinc chloride; PVP = polyvinylpyrrolidone; SDS = sodium dodecyl sulphate; IBA = isobutanol; NH4OH = ammonium hydroxide; U = urea; EG = ethylene glycol. | ||||||
| Zn(NO3)2 | CC | 500 | 0.08 | Mushroom | 60 | 84 |
| Zn(CH3COO)2 + ED | SG | 500 | 2 | Rod | 1.5 | 85 |
| ZnSO4 + HMT + ED | TM | 240 | 1 | Flower | >1 | 86 |
| Zn(NO3)2 + (NH4)2CO3 + CTAB + C2H6O | ST | 220 | 18 | Rod | 0.8 | 45 |
| Zn(CH3COO)2 + NaOH + CTAB | HT | 200 | 20 | Rod | >20 | 87 |
| Zn(CH3COO)2 + NaOH | HT | 200 | 20 | Flower | >4 | 88 |
| Zn(NO3)2 + CTAB | HT | 200 | 10 | Rod | 1 | 16 |
| Zn(CH3COO)2 + KOH + CTAB | HT | 180 | 24 | Kale | 3 | 89 |
| Zinc powder + CTAB | HT | 180 | 24 | Rod | 1 | 46 |
| Zn(CH3COO)2 + NaOH + CTAB | HT | 180 | 20 | Flower | 4 | 90 |
| Zn + (NH4)2S2O8 + KOH + CTAB | HT | 160 | 15 | Rod | 10 | 91 |
| Zn(CH3COO)2 + CTAB + C6H12 + C4H10O + (CH2)6N4 | ST | 140 | 14 | Dumbbell | 8 | 92 |
| ZnCl2 + NaOH + CTAB | HT | 130 | 24 | Rod | >5 | 11 |
| Zn(CH3COO)2 + NaOH + CTAB | HM | 130 | 3 | Threads | >15 | 68 |
| Zn(CH3COO)2 + NaOH + PVP | HT | 120 | 72 | Sphere | 0.04 | 5 |
| ZnCl2 + NaOH + SDS + IBA | HT | 120 | 12 | Disk | >5 | 2 |
| Zn(CH3COO)2 + KOH + CTAB | HT | 120 | 5 | Column | 1.4 | 93 |
| Zn(NO3)2 + NaOH + CTAB | HT | 120 | 0.5 | Sisal | 6 | 94 |
| Zn(NO3)2 + NH4OH | HT | 100 | 10 | Rotor | 3 | 95 |
| Zn(NO3)2 + U + EG | HT | 90 | 0.5 | Dumbbell | >0.5 | 96 |
| Zn(NO3)2 + NH4OH + CTAB | CP | 25 | 10 | Leaf | 1 | 27 |
3.5. Growth process
Based on the experimental results and orientation type of crystal growth, the possible growth mechanism of ZnO crystals of hexagonal column form belongs to the Ostwald ripening mechanism and is also involved in the selective adsorption of zincate growth units [Zn(OH)4]2− along the polar axis [001] of the ZnO crystal structure.92 This process is considered simple and innovative.87The crystal formation process includes nucleation and growth. Initially, because of the decomposition of ZAD at high temperature, the concentrations of Zn2+ and OH− increase correspondingly. When the supersaturation degree exceeds the critical value, the ZnO nuclei start to form. The mechanism suggested in this study for the formation of ZnO microcrystals hydrothermally processed at 120, 150 and 180 °C, with and without the assistance of CTAB, is proposed in Fig. 8.
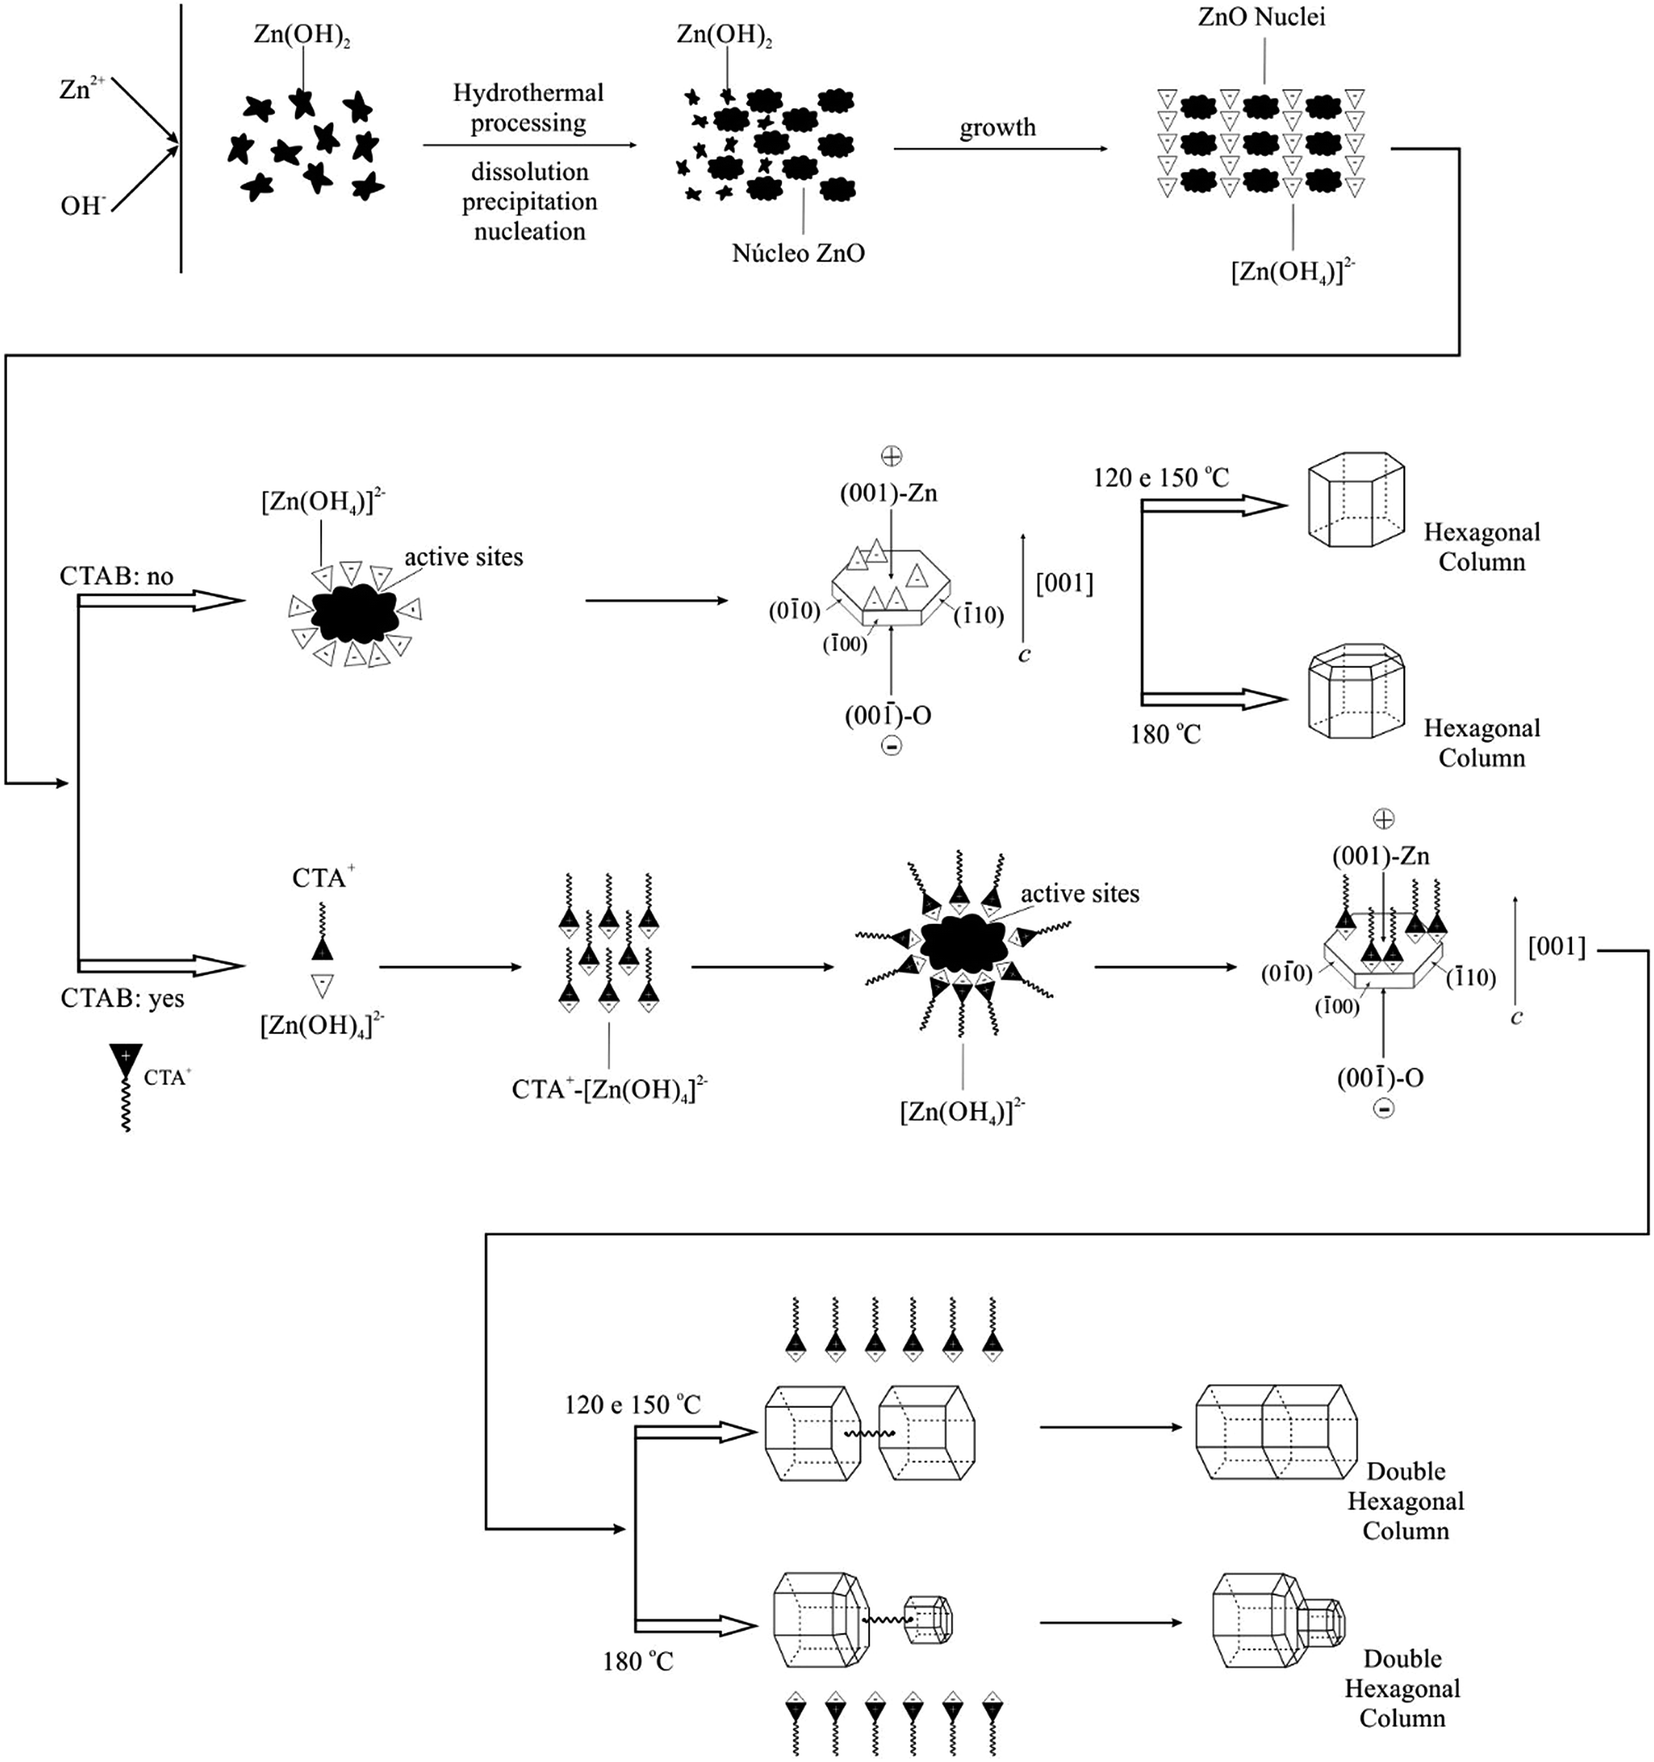 | ||
| Fig. 8 Schematic diagram of the mechanism proposed for the growth of ZnO microstructures in the form of simple and double hexagonal columns, obtained by hydrothermal processing at 120, 150 and 180 °C, with and without the assistance of CTAB. | ||
The ZnO synthesis without surfactant addition is classified as “organic-free”.88 Under hydrothermal conditions, the possible involved reactions are
| Zn2+ + 4OH− → [Zn(OH)4]2− | (2) |
| [Zn(OH)4]2− ↔ Zn(OH)2 + 2OH− | (3) |
| Zn(OH)2 ↔ ZnO + H2O | (4) |
| [Zn(OH)4]2− ↔ ZnO + 2H2O + 2OH− | (5) |
The experimental results revealed that the hydrothermal conditions, particularly the basic concentration of the solution and the temperature, affect the morphology and size of the crystallite. The modification of the physico-chemical conditions during the growth process is considered to essentially alter the solution structure, i.e., the structural form of the growth units and the nature of the growth interfaces. Therefore, an approach could be performed in relation to the incorporation of growth units in the different faces and the nature of the crystal growth interfaces under the effect of the addition of OH− ions to interpret the formation mechanism of the observed morphology.
The ZAD precursor undergoes hydrolysis, which induces the formation of Zn(OH)2. The Zn(OH)2 is a hydroxide of amphoteric character, and its solubility is particularly related to the alkalinity of the solution and the temperature.97 Thus, the solubility increases with the increase of temperature. Zn(OH)2 is dissolved in the solution to form the zincate complex [Zn(OH)4]2− in the basic solution; these complex groups are called crystal growth units, where these growth units dehydrate when they are incorporated in the crystal.46 Furthermore, the complexes (growth units) exhibit polaron behaviour because of the tetrahedron structure characteristic, i.e., the asymmetrical position of the Zn atom. The vertex of the tetrahedral exhibits a negative charge, whereas the base exhibits a positive charge and, similarly, the structured units, i.e., the Zn–O4 crystal tetrahedron. In turn, the amount of OH− in the solution has a significant effect on the nature of the growth interface, particularly on the two polar faces, and therefore on the rate of incorporation in these faces.
The detailed analyses of the incorporation of [Zn(OH)4]2− (zincate) growth units on the positive and negative faces are described next. In a solution with high pH under hydrothermal conditions, the starting material is completely dissolved, and all that is dissolved in the form of Zn(OH)2 is complexed with OH− to form zincate [Zn(OH)4]2−, which exhibits a negative charge. In turn, reminiscent OH− remains in the solution, which can affect the growth interface. Once the positive crystal face (001) is occupied by Zn atoms, the OH− ions in solution can be adsorbed on the face and modify the nature of the interface.16 Therefore, it becomes more difficult to incorporate the growth units on the positive and negative faces. The polar faces grow slowly and are developed with larger size, resulting into a regular morphology, such as hexagonal columns. According to observations, the temperature accelerates the reaction process, and at 180 °C, the (001) face tends to be smaller in the final stage.
Wang et al.46 reported that Zn(OH)2 not only contributes to the nucleation of ZnO as previously mentioned but also transforms into zincate [Zn(OH)4]2−, increasing the growth rate of ZnO. Furthermore, in the reaction at high temperature, active sites can be generated around the circumference of the ZnO nucleus, causing the ZnO to grow preferentially in the active known to be a polar crystal whose positive plane is rich in Zn and whose negative plane is rich in O. In the hydrothermal process, the growth unit [Zn(OH)4]2− leads to different growth rates of the planes: V(001) > V(10) > V(00) > V(00) > V(00).88 Generally, a faster growth rate corresponds to faster disappearance of the place. Therefore, the (001) plane of ZnO, with a fast growth rate associated with the high temperature, tends to disappear at the end of the hydrothermal process, which generates the point at the end of the c axis. In turn, the (00) plane, the slower growth rate plane, is maintained during the hydrothermal process. Hence, at 180 °C, at higher temperature, the form of the hexagonal columns can be altered, with a thinner (001) crystal face.
A possible growth mechanism for the ZnO microstructures at different temperatures and in the presence of CTAB is described next. The following chemical reactions are involved in the process:
| Zn2+ + 2OH− → Zn(OH)2 | (6) |
| Zn(OH)2 ↔ ZnO + H2O | (7) |
| Zn(OH)2 + 2OH− ↔ [Zn(OH)4]2− | (8) |
| CTAB ↔ CTA+ + Br− | (9) |
| [Zn(OH)4]2− + CTA+ ↔ CTA+–[Zn(OH)4]2− | (10) |
| CTA+–[Zn(OH)4]2− ↔ ZnO + H2O + CTA+ | (11) |
The presence of CTAB, which is a cationic surfactant, reduces the surface tension of the solution, which decreases the energy necessary to form a new phase, and therefore, the ZnO crystals can be formed at a temperature lower than supersaturation. As previously mentioned, the ZnO crystal growth unit is zincate [Zn(OH)4]2−; therefore, in aqueous solutions, the [Zn(OH)4]2− anions and CTA+ cations in solution during the hydrothermal process interact electrostatically to form complexing agents that are adsorbed on the surface of ZnO nuclei. Because of this adsorption, the surface energy of the ZnO nucleus decreases, resulting in active sites generated on the surface. Additionally, the temperature acts directly on the permanent dipole of water and increases the kinetic behaviour of crystallisation by one or two orders of magnitude.68
During the hydrothermal process, the CTAB acts as a transportation mode for the [Zn(OH)4]2− growth units. According to the internal structure and crystal growth cell, the ZnO exhibits a preferential growth behaviour along the c axis. These growth units are combined among themselves and decompose into ZnO nuclei simultaneously from the tetrahedral face of Zn–O4 and auto-organise to form microstructures in the form of hexagonal columns. The number of [Zn(OH)4]2− growth units increases at 180 °C, most likely because the high temperature accelerates the microcrystal growth reaction; consequently, the number of ZnO nuclei also decreases, reducing the surface potential.89
For hydrothermal processing with the assistance of CTAB, the same previously mentioned comments are valid. The ZnO microcrystal formation process under hydrothermal conditions can be represented as follows: the ZAD precursor undergoes hydrolysis, which induces the formation of Zn(OH)2. During the hydrothermal process, some of the Zn(OH)2 colloids are dissolved into Zn2+ and OH−. When the concentrations of Zn2+ and OH− reach the ZnO supersaturation degree, the ZnO nucleus is formed. The [Zn(OH)4]2− growth units exhibit a tetrahedral geometry.98–100
The CTAB is completely ionised in water. The CTA+ is positively charged with a tetrahedral head and a long hydrophobic tail. The resulting cation is also a tetrahedron with a long hydrophobic tail. Therefore, ion pairs can be formed between [Zn(OH)4]2− and CTA+ because of the electrostatic interaction. The critical micelle concentration (CMC) of the pure CTAB in aqueous solution at 25 °C is 0.0009 M,45 and the CTAB concentration used in this study is approximately 0.1 M, and, in this case, the CTAB aggregation in aqueous solution forms spherical micelles. Only the micelles in aqueous solutions are in dynamic equilibrium; the [Zn(OH)4]2− and CTA+ ion pairs are constantly adsorbed and separated at the surface of the formed micelle. The complementarity between [Zn(OH)4]2− and CTA+ enables the surfactant to act as an ionic carrier. It should also be highlighted that the CMC of CTAB increases as the temperature increases.45
According to Sun et al.,46 in the presence of CTAB, a fluctuating film is formed. When the surfactant agent molecules exit, zincate is transported in the form of an ionic pair, such that the boundary layer becomes finer, which facilitates the interaction process of the active sites. In the crystallisation process, the surfactant molecules can act as growth controllers as well as agglomeration inhibitors by forming a film on the newly formed ZnO crystal.
The adsorption of growth units at the crystal surface strongly affects the rate of formation and orientation of crystals. When a ZnO crystal grows, a surfactant film can be formed at the interface between the solution and ZnO crystal, reducing the interface energy. The floating film and surfactant molecules that transport the growth units will release them on the surface of the ZnO crystal. As the CTAB favours the formation of a film where the molecules tend to be perpendicular to the adsorbed surface, the growth units tend to fit in the face at the growth interface. Thus, this type of fit and the dehydration result in three Zn–O–Zn bonds, making this fit mode predominant and competing with others as the fitting in the vertex and edge. The ZnO crystal grows preferentially along the c axis ([001] direction) due to this fitting type in the (001) crystal face and the repeated dehydration steps. According to the previously mentioned process, it is supposed that CTAB not only accelerates the reaction as a growth unit transporter but also leads to the oriented growth of the ZnO microcrystals.27
Liu et al.92 reported that in the initial hydrothermal process, the growth unit of negative nature [Zn(OH)4]2− leads to different growth rates of ZnO particle planes and lamellas, which will be easily developed because of the Ostwald ripening process.96 As the reaction occurs, initially, the large surface areas of the lamellar crystals are dissolved and re-precipitate to form larger crystals of low energy and hexagonal morphology of double hexagonal columns. Recent studies with similar morphologies identified defects at the basal plane with inversion domain boundaries (IDBs). When the boundary inversion is formed in the ZnO, the head-to-head configuration appears predominantly along the polar axis c, i.e., planes with oxygen terminations oriented towards the other plane interface (001). In fact, the formation of double microstructures involves structural and energetic factors; however, the driving force behind the formation of this type of morphology remains under discussion in the literature.92 Gao et al.86 believe that the formation of double crystals in ZnO samples prepared under hydrothermal conditions is linked to the presence of organic additives, which provide models for the nucleation and orientation of ZnO crystal growth and, consequently, results in units in the form of fuse (axis), with half of the interface. Wang et al.101 reported the synthesis of ZnO in the form of dumbbells (double crystal) by the hydrothermal process using K+ as a mineraliser. In this hydrothermally process, K+ can act as a bond unit between tetrahedral [ZnO4]6− and leads to the initial formation of a double crystal nucleus, with head-to-head or tetrahedral tail-to-tail orientation depending on the conditions of preparation. In turn, in the present study, the majority of Zn2+ ions were precipitated as Zn(OH)2. Under hydrothermal conditions, the Zn(OH)2 precipitates were transformed into [Zn(OH)4]2− growth units. In the presence of CTAB, the growth units can be bonded by CTAB in the (001) composition plane to form the crystal nuclei in the form of double hexagonal columns. To reduce the surface energy, the individual crystallite growth in the double crystal occurs along the c polar axis by incorporating units in the (001) growth interfaces, and therefore, ZnO crystals in the form of double hexagonal columns are ultimately formed.
3.6. Diffuse reflectance
The direct optical band gap energy (Eg) was calculated using the method proposed by Kubelka and Munk.102 This methodology is based on the transformation of the diffuse reflectance measurements (R) to estimate the optical Eg values with good precision. The equation by Kubelka–Munk (12) for any wavelength is described as
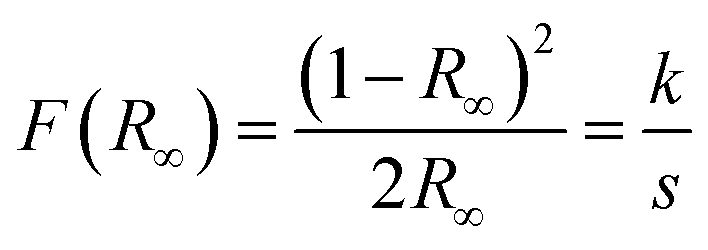 | (12) |
The analyses were performed using magnesium oxide (MgO) as the reference standard, where R∞ = Rsample/RMgO (R∞ is the reflectance when the sample has infinite thickness), k is the coefficient of molar absorption and s is the scattering coefficient. In a parabolic band structure, the optical Eg and absorption coefficient of semiconducting oxides can be calculated using eqn (13):
| αhν = C1(hν − Eg)n | (13) |
| [F(R∞)hν]2 = C2(hν − Eg) | (14) |
Consequently, after determining the value of F(R∞) from eqn (14) and plotting a graph of [F(R∞)hν]2 versus hν and C2, the Eg of the ZnO crystals was determined by extrapolation of the linear region of the curves, making [F(R)hν]2 = 0, as shown in Fig. 9.
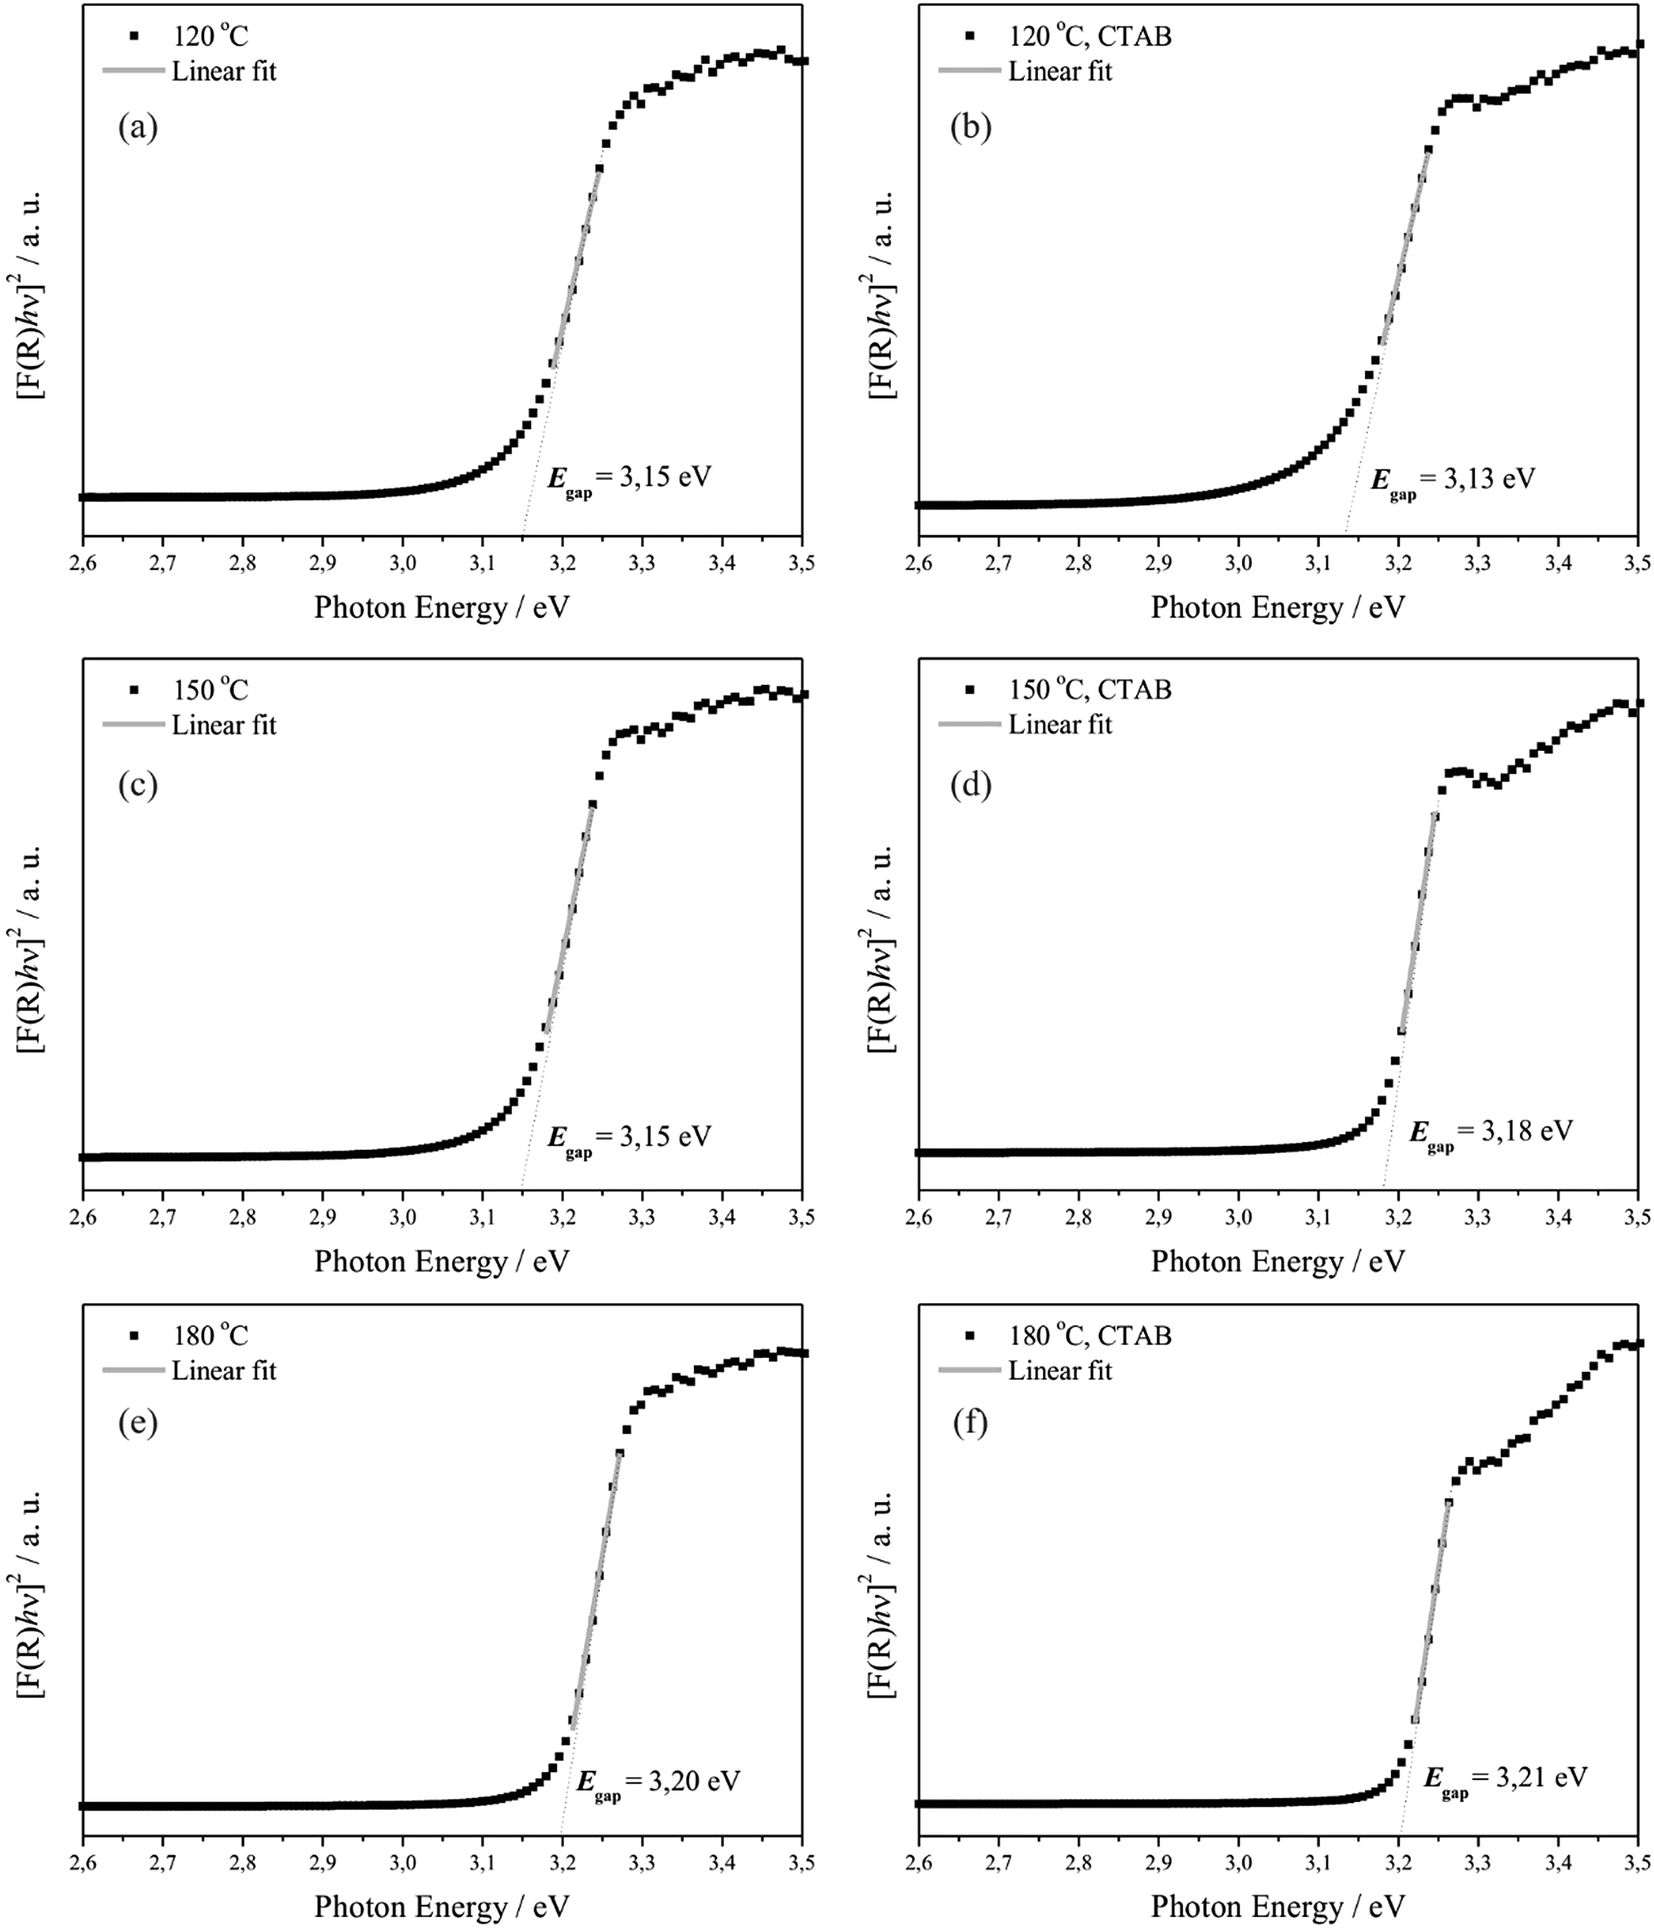 | ||
| Fig. 9 Kubelka–Munk curves ([F(R)hν]2 versus hν in eV) of the ZnO samples hydrothermally processed for 24 h at 120 °C (a) without and (b) with the assistance of CTAB; at 150 °C (c) without and (d) with the assistance of CTAB; and at 180 °C (e) without and (f) with the assistance of CTAB. | ||
Fig. 9 shows that the optical Eg values of ZnO crystals hydrothermally synthesised without CTAB varied from 3.15 to 3.20 eV, and those synthesised with CTAB varied from 3.13 to 3.21 eV. In this case, it was verified that the optical Eg values increase with decreasing particle size and increasing temperature for the samples synthesised with or without CTAB, which may suggest that ZnO crystals prepared at 120 and 150 °C absorb more visible light and that at 180 °C, this absorption is smaller.5
Table 5 presents the experimental values of optical Eg for ZnO crystals reported in the literature, which were obtained using different synthesis and bulk methods. The optical Eg values for the ZnO crystals (Fig. 9) differ slightly from the values reported in the literature for pure ZnO crystals. These discrepancies can be attributed to the fact that optical Eg is strongly dependent on the synthesis method, defect levels in the optical band gap, morphology and average crystal size, structural orientation and distortions.103 Next, some considerations are made regarding these effects.79,103–110
| T (°C) | t (h) | Eg (eV) | Ref. | |
|---|---|---|---|---|
| a M = method; T = temperature; t = time; Eg = band gap; Ref. = reference; CC = calcination; PC = Pechini; PT = precipitation; GR = grinding; SG = sol–gel; PM = precipitation and microwave; HT = hydrothermal; BK = bulk. | ||||
| Synthesis methods | ||||
| CC | 1000 | 4 | 3.12 | 87 |
| PC | 700 | 1 | 3.25 | 105 |
| PT | 600 | 1 | 3.17 | 106 |
| GR | 600 | 1 | 3.14 | 103 |
| SG | 400 | 1 | 3.20 | 107 |
| PM | 200 | 2 | 3.26 | 79 |
| HT | 90 | 6 | 3.36 | 108 |
|
||||
| Bulks | ||||
| BK | — | — | 3.35 | 109 |
| BK | — | — | 3.36 | 110 |
As previously stated, Eg can be affected by various factors, including crystal defects111–113 and sizes.114,115 Huo and Hu104 demonstrated a linear correlation between the Eg of ZnO and the size of the crystal nanoparticles, which indicates that the increase of Eg can be attributed to the decrease of the crystal size. It is also known that when the crystal size is very small (nanometric scale), Eg increases as the crystal size decreases.116,117 However, the dependence of Eg on size has not yet been reported for crystal particles larger than 100 nm.104 The results of this study demonstrate that the dependence of Eg in relation to size occurs even at the micrometric scale.
Considering the molecular orbitals, two factors can determine the changes of Eg with the increase of crystal size: the Coulomb interaction displaces Eg to lower values, whereas the quantum location displaces Eg to higher energies.105,118 Hence, the apparent Eg tends to increase for a small crystal size, where the change in Eg is determined especially for the quantum location. In effect, the dependency of Eg with size is demonstrated in the literature for ZnO nanoparticles.116,117 In contrast, when the crystal size is large, Eg tends to decrease because the Coulomb interaction plays a critical role in the change of Eg for crystals of larger sizes, which can explain the dependency of size on the Eg of large particles (>100 nm), which is the case in the present study.
3.7. PL emission
The PL property has always drawn attention from the scientific community, especially for the discovery of PL at room temperature, which favours its technological applications such as in LEDs, lasers in the visible light region and fibre optic components.119The literature presents various models that explain this optical property, and among them, there is consensus that structural disorder is responsible for PL emission. A completely ordered or disordered material does not exhibit PL. Hence, a minimum order is necessary in a disordered system for the material to exhibit PL.120
All the synthesised samples (figure not shown) exhibit very similar band profiles and positions in the non-standardised PL emission spectra. One emission band is observed in the violet range, located at approximately 400 nm, with a small peak in the UV range approaching 380 nm, and intense and highly superposed emission bands that range from 440 to 750 nm (blue to red emission), with a maximum at approximately 610 nm.
PL is associated with the presence of structural disorder and is responsible for the formation of electronic levels within the band gap, i.e., the formation of energy levels between the valence band (VB) and conduction band (CB). The energy levels between the VB and CB can act as recombination centres for the electron-gap pair, promoting luminescence emission. Generally, ZnO crystals with the wurtzite structure of macroscopic dimensions (bulk) and crystal organisation approaching the ideal exhibit strong UV emission, whereas smaller crystals (micro and nanostructures) associated with the abundance of defects exhibit strong emissions in the visible region, where the modifications at the ZnO structure surface can increase or suppress the intensity and emission in the visible range.116
The ratio of UV and visible emission intensities can be used to evaluate the quality of ZnO.121 Generally, it is accepted that smaller ZnO crystal sizes are associated with PL emissions of low UV band ratios in relation to the visible band, caused by the large surface area and more surface defects.122 However, this tendency was not verified in the present study. Possibly, there is the formation of steps with crystal side surfaces larger than ZnO, which may increase the surface/interface defects. Additionally, Zhou et al. (2002) suggest that for ZnO, intense emission bands in the visible range, more precisely above 500 nm, can be attributed to the presence of Zn(OH)2 or OH− groups at the crystal surface level, which could also play the role of interstitial oxygen (Oi). In other words, the excess of oxygen could lead to an increase of the number of defects in the crystal structure, elevating the intensity of the bands in the visible region. For the present study, where hydrothermal processing in alkaline pH is applied, this explanation is plausible for the observation of intense bands in the visible range, where hydroxyl groups or water at the surface can easily be present.123 This explanation would not necessarily be applicable to ZnO samples produced by other methods. Hence, the presence of the emission band in the visible region of the PL spectra for the samples produced in this study corroborates the Raman results. In the Raman spectra, a slight variation was observed in the characteristic positions of the vibration modes that could be related to a series of factors including the crystallinity degree, grain size distribution and average crystal size, ionic interaction force, degree of structural order and disorder in the crystal lattice, and presence of structural defects (oxygen vacancies, distortions or tensions in the structure). Thus, the size distribution in all the samples had a direct effect on the intensity of the emission bands and not on its appearance. This type of study involving the variation of the particle size and intensity of the emission band in the visible region of the PL spectrum has already been reported for ZnO samples on the micrometric scale synthesised at hydrothermal conditions in the absence of CTAB.124 The variations of the positions observed in the Raman modes and the appearance of the emission band in the PL spectra are observed in this study, which is intimately related to the presence of defects created during the sample processing. Although there are many studies in the literature on the types of defects that cause such effects on different types of materials, a more detailed investigation is necessary to properly correlate the defect type and effect that are susceptible to the preparation conditions. Further studies are being performed to evaluate whether the defects in the samples produced in this study could be related to the presence of the Zn(OH)2 species or whether OH− groups could take the role of interstitial oxygen or whether the excess of oxygen in the reaction medium could be responsible for these changes of the ZnO characteristics.
3.8. Catalytic activity
Fig. 10 shows the photocatalytic activities of all samples for the degradation of RhB and MO aqueous solution under the simulative sunlight irradiation. The photocatalytic degradation of RhB as a function of time (Fig. 10a) was controlled of the ZnO samples obtained at different temperatures in the presence and absence of CTBA. The photolysis efficiency in absence of ZnO was less than 10% with irradiation for 90 minutes. The decolorization efficiencies of RhB degradation were 97%, 92% and 96% to ZnO obtained at 120, 150 and 180 °C in absence of CTBA, and 97%, 80% and 82% to ZnO obtained at 120, 150 and 180 °C with CTBA. Comparing to ZnO obtained without CTBA with ZnO obtained in presence of CTBA, it showed the RhB decolorization of 97%. Thus, the photocatalytic performance of the ZnO obtained at 120 °C in absence of CTAB is the highest, decolorizing RhB at 40 minutes.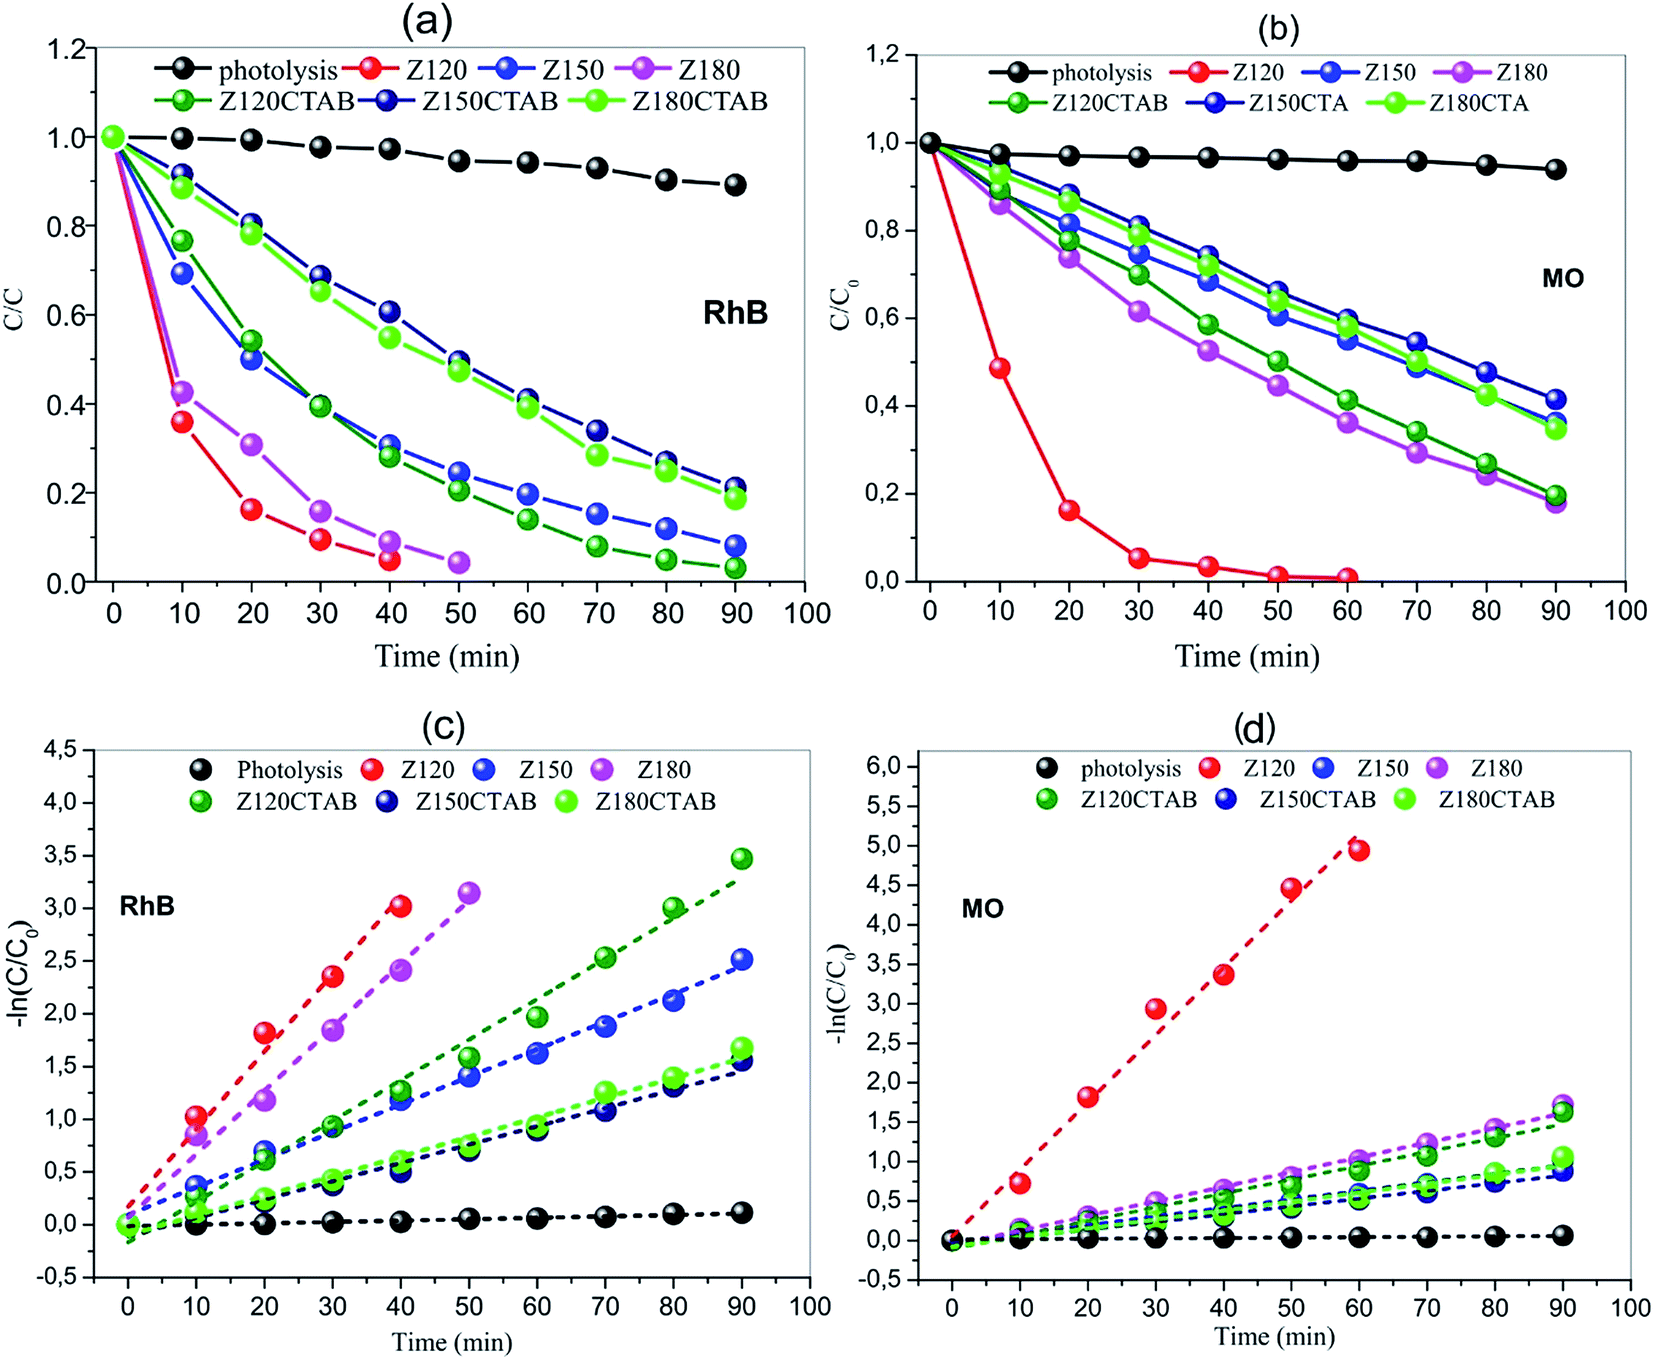 | ||
| Fig. 10 Photocatalytic degradation of RhB and MO ((a) and (b), respectively) and kinetic data fitting for the degradation of RhB and MO ((c) and (d), respectively), using ZnO as catalyst. | ||
The photocatalytic degradation of MO as a function of time (Fig. 10b) was controlled of the ZnO samples obtained at different temperatures in the presence or absence of CTBA. The photolysis efficiency in absence of ZnO was less than 5% with irradiation for 90 minutes. The decolorization efficiencies of MB degradation were 99%, 63% and 82% to ZnO obtained at 120, 150 and 180 °C in absence of CTBA, and 81%, 58% and 65% to ZnO obtained at 120, 150 and 180 °C with CTBA. Comparing to ZnO obtained without and with CTBA, it is showed the MO decolorization of 99%. Thus, the photocatalytic performance of the ZnO obtained at 120 °C in presence of CTAB is the highest, decolorizing MO at 50 minutes.
The rate constant k (Fig. 10c and d) can be calculated by the gradient of lnCt/C0 = f(t) because the degradation follows a pseudo-first order kinetics. The k value without catalyst equals 1.33 × 10⁻³ min−1 and 0.51 × 10⁻³ min−1 for degradation of RhB and MO, respectively. ZnO obtained without CTAB have k values of 73.68 × 10⁻³ (RhB degradation) and 85.16 × 10⁻³ (MO degradation), using ZnO obtained at 120 °C (Z120, Fig. 10) as catalysts (Fig. 10c and d). Degradation with as little as 100 mg of ZnO is more than 55 (RhB degradation) and more than 167 (MO degradation) times faster as without a catalyst. Compared to ZnO obtained in presence of CTAB, the catalyst obtained in absence (Zn120) are 2.0 times more efficient for degradation of RhB, and 4.8 times more efficient for degradation of MO. From the kinetic analysis, it has been established that the degradation of RhB and MO follows first order kinetics with trends being displayed in Fig. 10 and the obtained values of kinetic rate constants given in Table 6.
| Sample | RhB | MO | ||
|---|---|---|---|---|
| kap × 10−3 (min−1) | t1/2 (min) | kap × 10−3 (min−1) | t1/2 (min) | |
| Photolysis | 1.33 | 521.16 | 0.511 | 1356.4 |
| Z120 | 73.68 | 9.40 | 85.16 | 8.1393 |
| Z150 | 26.19 | 26.46 | 10.84 | 63.943 |
| Z180 | 60.19 | 11.51 | 18.57 | 37.326 |
| Z120CTAB | 38.43 | 18.03 | 17.53 | 39.547 |
| Z150CTAB | 17.37 | 39.90 | 9.796 | 70.806 |
| Z180CTAB | 18.62 | 37.22 | 11.35 | 61.078 |
Intensive research work is being undertaken globally to effectively use the process of photocatalysis for the degradation of organic pollutants from industrial effluents. Many photocatalysts such as TiO2, MoO3, SnO2, WO3, Fe2O3, Fe3O4, Ag2WO4, Ag2MO4, etc. and combinations thereof, have been extensively investigated as suitable materials for pollutant degradation under UV/visible/solar light.125–133 In general, several authors clearly show that morphology, and principally, both a high degree of crystallinity and moderate surface area are necessary to obtain highly active materials for organic pollutants degradation. The results obtained in this work are in good agreement with previous reports.134–136 ZnO formed by the hydrothermal method exhibit high catalytic activity (Fig. 10).
4. Conclusion
The present study demonstrated that ZnO microcrystals with narrow size distributions can be successfully synthesised with chemical reproducibility in the wurtzite phase with the form of hexagonal columns starting from zinc acetate in alkaline medium at 120, 150 and 180 °C with and without the assistance of CTAB. The developed method is simple, allows for the production of ZnO microstructures in just 24 h of processing and uses common low-cost experimental apparatus, which is promising for industrial-scale application. Furthermore, the method offers control of the structural properties of the ZnO microcrystals by the appropriate selection of the reaction temperature, pH and the presence or absence of CTAB. These variables allow differentiated ZnO microcrystals to be prepared to meet the requirements of different technological applications. Photocatalytic degradation under UV irradiation reduced effectively the RhB and MO, with the best degradation results obtained for ZnO obtained at 120 °C and absence of CTAB. The differential of this work is the ZnO obtained from hydrothermal method, which can be easily separated from the solution using a simple filtration system with common filter paper, thus contributing to sustainable development and economically viable for industrial application, maintaining the high photocatalytic activity.Acknowledgements
The authors would like to acknowledge the support provided by the Federal University of Piauí (Universidade Federal do Piauí – UFPI), the Laboratory of Nanocharacterisation of the Federal University of São Carlos (Universidade Federal de São Carlos – UFSCar), the São Paulo Research Foundation (Fundação de Amparo à Pesquisa do Estado de São Paulo – FAPESP) 2012/19926-8, the National Council for Scientific and Technological Development (Conselho Nacional de Desenvolvimento Científico e Tecnológico – CNPq) 473669/2012-9 and the Northeast Centre for Strategic Technologies (Centro de Tecnologias Estratégicas do Nordeste – CETENE).References
- Z. L. Wang, J. Phys.: Condens. Matter, 2004, 16, R829–R858 CrossRef CAS
.
- K. Choi, T. Kang and S. G. Oh, Mater. Lett., 2012, 75, 240–243 CrossRef CAS
- Y. Masuda, N. Kinoshita, F. Sato and K. Koumoto, Cryst. Growth Des., 2006, 6, 75–78 CAS
- P. F. Carcia, R. S. Mclean and M. H. Reilly, Appl. Phys. Lett., 2006, 88, 1235091–1235093 CrossRef
- A. Stankovic, Z. Stojanovic, L. Veselinovic, S. D. Skapin, I. Bracko, S. Markovic and D. Uskokovic, Mater. Sci. Eng., B, 2012, 177, 1038–1104 CrossRef CAS
- S. Baruah and J. Dutta, Sci. Technol. Adv. Mater., 2009, 10, 013001 CrossRef PubMed
- R. Zhang, S. Kumar, S. Zou and L. L. Kerr, Cryst. Growth Des., 2008, 8, 381–383 CAS
- X. Zhao, W. Liu, R. Chen, Y. Gao, B. Zhu, H. V. Demir, S. Wang and H. Sun, Nanoscale, 2016, 8(11), 5835–5841 RSC
- X. Zhang, S. Yang, S. Bi, A. Kumaresan, J. Zhou, J. Seifter, H. Mi, Y. Xu, Y. Zhang and H. Zhou, RSC Adv., 2017, 7, 12400–12406 RSC
- W. L. Suchanek, J. Cryst. Growth, 2009, 312, 100–108 CrossRef CAS
- Y. Yang, G. Du, X. Xin and B. Xu, Appl. Phys. A, 2011, 104, 1229–1235 CrossRef CAS
- S. Ekambaram, J. Alloys Compd., 2005, 390, L4–L6 CrossRef CAS
- K. Byrappa, A. K. Subramani, S. Ananda, K. M. L. Rai, R. Dinesh and M. Yoshimura, Bull. Mater. Sci., 2006, 29, 433–438 CrossRef CAS
- Y. Sun, L. Chen, Y. Bao, Y. Zhang, J. Wang, M. Fu, J. Wu and D. Ye, Catalysts, 2016, 6(12), 18891–18944 CrossRef
- K. Schilling, B. Bradford, D. Castelli, E. Dufour, J. F. Nash, W. Pape, S. Schulte, I. Tooley, J. V. D. Boschi and F. Schellauf, Photochem. Photobiol. Sci., 2010, 9, 495–509 CAS
- P. Rai, S. K. Tripathy, N. H. Park, O. Kwang-Joong, I. H. Lee and Y. T. Yu, J. Mater. Sci.: Mater. Electron., 2009, 20, 967–971 CrossRef CAS
- A. Ammala, A. J. Hill, P. Meakin, S. J. Pas and T. W. J. Turney, J. Nanopart. Res., 2002, 4, 167–174 CrossRef CAS
- M. H. Lai, A. Tubtimtae, M. W. Lee and G. J. Wang, Int. J. Photoenergy, 2010, 497095 Search PubMed
- A. K. Barui, V. Veeriah, S. Mukherjee, J. Manna, A. K. Patel, S. Patra, K. Pal, S. Murali, R. K. Rana, S. Chatterjee and C. R. Patra, Nanoscale, 2012, 4, 7861–7869 RSC
- I. M. M. Paino, F. J. Gonçalves, F. L. Souza and V. Zucolotto, ACS Appl. Mater. Interfaces, 2016, 8, 32699–32705 CAS
- A. Moezzi, A. M. Mcdonagh and M. B. Cortie, Chem. Eng. J., 2012, 185–186, 1–22 CrossRef CAS
- S. Bhushan, ed. D. R. Vij and N. Singh, Materials Letters, Zinc oxide Nova Science Publishers Inc., Commack Ny, 1998 Search PubMed
- M. J. Height, L. Madler, S. E. Pratsinis and F. Krumeich, Chem. Mater., 2006, 18, 572–578 CrossRef CAS
- M. A. Tshabalala, B. F. Dejene and H. C. Swart, Physica B, 2012, 407, 1668–1671 CrossRef CAS
- Y. W. Chen, Q. Qiao, Y. C. Liu and G. L. Yang, J. Phys. Chem. C, 2009, 113, 7497–7502 CAS
- S. Music, D. Dragcevic and S. Popovic, Mater. Lett., 2005, 59, 2388–2393 CrossRef CAS
- H. Tang, J. C. Chang, Y. Shan and S. T. Lee, J. Phys. Chem. B, 2008, 112, 4016–4021 CrossRef CAS PubMed
- M. Yoshimura and K. Byrappa, J. Mater. Sci., 2008, 43, 2085–2103 CrossRef CAS
- K. Byrappa and T. Adschiri, Prog. Cryst. Growth Charact. Mater., 2007, 53, 117–166 CrossRef CAS
- N. Tiwale, Sens. Actuators, B, 2014, 204, 250–272 CrossRef CAS
- N. Tiwale, Mater. Sci. Technol., 2015, 31(14), 1681–1697 CrossRef CAS
- K. F. Cai, X. R. He and L. C. Zhang, Mater. Lett., 2008, 62, 1223–1225 CrossRef CAS
- J. Zhan, H. Dong, Y. Liu, Y. Wang, Z. Chen and L. Zhang, CrystEngComm, 2013, 15, 10272–10277 RSC
- J. Wang, R. Chen, Y. Xia, G. Wang, H. Zhao, L. Xiang and S. Komarneni, Ceram. Int., 2017, 43, 1870–1879 CrossRef CAS
- K. N. Abbas and N. Bidin, Appl. Surf. Sci., 2017, 394, 498–508 CrossRef CAS
- X. Zheng, R. Wu and Y. Chen, Environ. Sci. Technol., 2011, 45, 2826–2832 CrossRef CAS PubMed
- N.-Q. Puay, G. Qiu and Y.-P. Ting, J. Cleaner Prod., 2015, 88, 139–145 CrossRef CAS
- J. Choi, S. Chan, H. Joo, H. Yang and F. K. Ko, Water Res., 2016, 101, 362–369 CrossRef CAS PubMed
- B. G. Wang, E. W. Shi and W. Z. Zhong, Cryst. Res. Technol., 1998, 33, 937–941 CrossRef CAS
- C. Y. Toe, H. L. Tan, C. Boyer, A. Rawal, S. C. Thickett, J. Scott, R. Amal and Y. H. Ng, J. Mater. Chem. A, 2017, 5, 4568–4575 CAS
- Y. Liu, X. Yan, Z. Kang, Y. Li, Y. Shen, Y. Sun, L. Wang and Y. Zhang, Sci. Rep., 2016, 6, 1–7 CrossRef PubMed
- J. S. Souza, W. M. Carvalho, F. L. Souza, C. Ponce-de-Leon, D. V. Bavykin and W. A. Alves, J. Mater. Chem. A, 2016, 4, 944–952 CAS
- S. Adhikari, D. Sarkar and G. Madras, RSC Adv., 2014, 4, 55807–55814 RSC
- Y. Fang, Z. Li, S. Xu, D. Han and D. Lu, J. Alloys Compd., 2013, 575, 359–363 CrossRef CAS
- L. Wolski, J. E. Whitten, I. Sobczak and M. Ziolek, Mater. Res. Bull., 2017, 85, 35–46 CrossRef CAS
- Y. X. Wang, J. Sun, X. A. Fan and X. Yu, Ceram. Int., 2011, 37, 3431–3436 CrossRef CAS
- H. Kato, K. Miyamoto and M. Sano, Appl. Phys. Lett., 2004, 4, 4562–4564 CrossRef
- M. Anbuvannan, M. Ramesh, G. Viruthagiri, N. Shanmugam and N. Kannadasan, Spectrochim. Acta, Part A, 2015, 143, 304–308 CrossRef CAS PubMed
- H. Schulz and K. H. Thiemann, Solid State Commun., 1979, 32, 783–785 CrossRef CAS
- http://www.portaldapesquisa.com.br, accessed in 11-06-2016.
- Y. Chen, R. Yu, Q. Shi, J. Qina and F. Zheng, Mater. Lett., 2007, 61, 4438–4441 CrossRef CAS
- G. Sun, M. Cao, Y. Wang, C. Hu, Y. Liu, L. Ren and Z. Pu, Mater. Lett., 2006, 60, 2777–2782 CrossRef CAS
- C. Jiang, W. Zhang, G. Zou, W. Yu and Y. Qian, J. Phys. Chem. B, 2005, 109, 1361–1361 CrossRef CAS PubMed
- Y. H. Ni, X. W. Wei, J. M. Hong and Y. Ye, Mater. Sci. Eng., B, 2005, 121, 42–47 CrossRef
- A. P. A. Oliveira, J. F. Hochepied, F. Grillon and M. H. Berger, Chem. Mater., 2003, 15, 3202–3207 CrossRef CAS
- S. C. Abrahams and J. L. Bernstein, Acta Crystallogr., Sect. B: Struct. Sci., 1969, 25, 1233–1236 CrossRef CAS
- K. Kiharai and G. Donnay, Can. Mineral., 1985, 23, 647–654 Search PubMed
- L. B. Mccusker, R. B. V. Dreele, D. E. Cox, D. Louër and P. Scardi, J. Appl. Crystallogr., 1999, 32, 36–50 CrossRef CAS
- J. M. A. Almeida, C. T. Meneses, A. S. Menezes, R. F. Jardim and J. M. Sasaki, Magn. Magn. Mater., 2008, 320, 304–307 CrossRef
- R. A. Young, The Rietveld Method, Oxford University Press, New York, 1995 Search PubMed
- http://www.crystalimpact.com/diamond, accessed in in 13-09-2016.
- Ü. Özgür, Y. I. Alivov, C. Liu, A. Tekeb, M. A. Reshchikov, S. Doğan, V. Avrutin, S.-J. Cho and H. Morkoç, J. Appl. Phys., 2005, 98, 041301 CrossRef
- M. Koyano, P. Quocbao, L. T. Thanhbinh, L. Hongha, N. Ngoclong and S. Katayama, Phys. Status Solidi A, 2002, 193, 125–131 CrossRef CAS
- K. Mcguire, Z. W. Pan, Z. L. Wang, D. Milkie, J. Menéndez and A. M. Rao, J. Nanosci. Nanotechnol., 2002, 2, 499–502 CrossRef CAS PubMed
- S. B. Yahia, L. Znaidi, A. Kanaev and J. P. Petitet, Spectrochim. Acta, Part A, 2008, 71, 1234–1238 CrossRef PubMed
- Y. Huang, M. Liu, Z. Li, Y. Zeng and S. Liu, J. Mater. Sci. Eng. B, 2003, 97, 111–116 CrossRef
- R. S. Yadav and A. C. Pandey, Struct. Chem., 2009, 20, 1093–1097 CrossRef CAS
- A. P. Moura, R. C. Lima, M. L. Moreira, D. P. Volanti, J. W. M. Espinosa, M. O. Orlandi, P. S. Pizani, J. A. Varela and E. Longo, Solid State Ionics, 2010, 181, 775–780 CrossRef
- N. Ashkenov, B. N. Mbenkum, C. Bundesmann, V. Riede, M. Lorenz, D. Spemann, E. M. Kaidashev, A. Kasic, M. Schubert, M. Grundmann, G. Wagner, H. Neumann, V. Darakchieva, H. Arwin and B. Monemar, J. Appl. Phys., 2003, 93, 126–133 CrossRef CAS
- T. C. Damen, S. P. S. Porto and B. Tell, Phys. Rev., 1966, 142, 570–574 CrossRef CAS
- C. A. Arguello, D. L. Rousseau and S. P. S. Porto, Phys. Rev., 1969, 181, 1351–1363 CrossRef CAS
- M. Tsuboi and A. Wada, J. Chem. Phys., 1968, 48, 2615–2618 CrossRef CAS
- A. Zaoui and W. Sekkal, Phys. Rev. B: Condens. Matter Mater. Phys., 2002, 66, 1741061–1741066 CrossRef
- R. Jothilakshmi, V. Ramakrishnan, R. Thangavel, J. Kumar, A. Sarua and M. Kuball, J. Raman Spectrosc., 2009, 40, 556–561 CrossRef CAS
- R. Cuscó, E. Alarcón-Lladó, J. Ibáñez, L. Artús, J. Jiménez, B. Wang and M. Callahan, J. Phys. Rev. B, 2007, 75, 165202–165207 CrossRef
- J. Zhao, X. Yan, Y. Yang, Y. Huang and Y. Zhang, Mater. Lett., 2010, 64, 569–572 CrossRef CAS
- L. N. Dem'yanets, D. V. Kostomarov and I. P. Kuz'mina, Inorg. Mater., 2002, 38, 124–131 CrossRef
- X. Liu, X. Wu, H. Cao and R. P. H. Chang, J. Appl. Phys., 2004, 95, 3141–3147 CrossRef CAS
- N. U. Sangari and S. C. Devi, J. Solid State Chem., 2013, 197, 483–488 CrossRef
- A. Becheri, M. Durr, P. L. Nostro and P. Baglioni, J. Nanopart. Res., 2008, 10, 679–689 CrossRef CAS
- S. Maensiria, P. Laokula and V. Promarak, J. Cryst. Growth, 2006, 289, 102–106 CrossRef
- E. F. Venger, A. V. Melnichuk, L. Y. Melnichuk and Y. A. Pasechnik, Phys. Status Solidi B, 1995, 188, 823–831 CrossRef CAS
- F. Li, L. Hu, Z. Li and X. Huang, J. Alloys Compd., 2008, 465, l14–l19 CrossRef CAS
- H. X. Niu, Q. Yang, F. Yu, K. B. Tang and Y. Xie, Mater. Lett., 2007, 61, 137–140 CrossRef CAS
- X. Jiang, Y. Liu, Y. Gao, X. Zhang and L. Shi, Particuology, 2010, 8, 383–385 CrossRef CAS
- X. Gao, X. Li and W. Yu, J. Phys. Chem. B, 2005, 109, 1155–1161 CrossRef CAS PubMed
- S. D. Shinde, G. E. Patil, D. D. Kajale, D. V. Ahire, V. B. Gaikwad and G. H. Jain, Int. J. Smart Sensing and Intell. Systems, 2012, 5, 57–70 CAS
- H. Zhang, D. Yang, X. Ma, Y. Ji, J. Xu and D. Que, J. Nanotechnol., 2004, 15, 622–626 CrossRef CAS
- X. M. Sun, X. Chen, Z. X. Deng and Y. D. Li, Mater. Chem. Phys., 2002, 78, 99–103 CrossRef CAS
- H. Zhang, D. Yang, Y. Ji, X. Ma, J. Xu and D. Que, J. Phys. Chem. B, 2004, 108, 3955–3958 CrossRef CAS
- U. N. Maiti, S. Nandy, S. Karan, B. Mallik and K. K. Chattopadhyay, Appl. Surf. Sci., 2008, 254, 7266–7271 CrossRef CAS
- Y. Liu, H. Lv, S. Li, G. Xi and X. Xing, Adv. Powder Technol., 2011, 22, 784–788 CrossRef CAS
- Y. H. Ni, X. W. Wei, X. Ma and J. M. Hong, J. Cryst. Growth, 2005, 283, 48–56 CrossRef CAS
- J. Ge, B. Tang, L. Zhuo and Z. Shi, J. Nanotechnol., 2006, 17, 1316–1322 CrossRef CAS
- X. P. Gao, Z. F. Zheng, H. Y. Zhu, G. L. Pan, J. L. Bao, F. Wu and D. Y. Song, Chem. Commun., 2004, 1428–1429 RSC
- M. Bitenc, G. Drazic and Z. C. Orel, Cryst. Growth Des., 2010, 10, 830–837 CAS
- B. G. Wang, E. W. Shi and W. Z. Zhong, Cryst. Res. Technol., 1997, 32, 659–667 CrossRef CAS
- S. C. Zhang and X. G. Li, Colloids Surf., 2003, 35–44 CrossRef
- L. N. Dem'yanets, D. V. Kostomarov and I. P. Kuz'mina, Inorg. Mater., 2002, 38, 124–131 CrossRef
- C. L. Kuo, T. J. Kuo and M. H. Huang, J. Phys. Chem. B, 2005, 109, 20115–20121 CrossRef CAS PubMed
- B. G. Wang, E. W. Shi and W. Z. Zhong, Cryst. Res. Technol., 1998, 33, 937–941 CrossRef CAS
- P. Kubelka and F. Munk-Aussig, Zeit. Fur. Tech. Physik., 1931, 12, 593–599 Search PubMed
- P. J. A. Porn, S. Suwanboon and P. J. Amornpitoksuk, J. Ceram. Process. Res., 2011, 12, 85–89 Search PubMed
- Y. Huo and Y. H. Hu, Ind. Eng. Chem. Res., 2012, 51, 1083–1085 CrossRef CAS
- R. Rusdi, A. A. Rahman, N. S. Mohamed, N. Kamarudin and N. Kamarulzaman, Powder Technol., 2011, 210, 18–22 CrossRef CAS
- S. Suwanboon, P. Amornpitoksuk and S. Muensit, J. Ceram. Process. Res., 2010, 11, 419–424 Search PubMed
- T. V. Kolekar, H. M. Y. Adav, S. S. A. Bandgar, A. C. Raskar, S. G. Rawal and G. M. Mishra, Indian Streams Res. J., 2011, 2, 1–3 Search PubMed
- Y. Tong, L. Dong, Y. Liu, D. Zhao, J. Zhang, Y. Lu, D. Shen and X. Fan, Mater. Lett., 2007, 61, 3578–3581 CrossRef CAS
- K. F. Lin, H. M. Cheng, H. C. Hsu, L. J. Lin and H. F. Hsieh, Chem. Phys. Lett., 2005, 409, 208–211 CrossRef CAS
- D. C. Look, C. R. Donald, J. R. Sizelove, R. L. Jones, C. W. Litton, G. Cantwell and W. C. Harsch, Solid State Commun., 1998, 105, 399–401 CrossRef CAS
- A. J. Hauser, J. Zhang, L. Mier, R. A. Ricciardo, P. M. Woodward, T. L. Gustafson, L. J. Brillson and F. Y. Yang, Appl. Phys. Lett., 2008, 92, 22290 Search PubMed
- J. J. Thevaril and S. K. O’leary, Solid State Commun., 2010, 150, 1851–18555 CrossRef CAS
- K. Sakai, T. Kakeno, T. Ikari, S. Shirakata, T. Sakemi, K. Awai and T. Yamamoto, J. Appl. Phys., 2006, 99, 043508 CrossRef
- R. E. Marotti, P. Giorgi, G. Machado and E. A. Dalchiele, Sol. Energy Mater. Sol. Cells, 2006, 90, 2356–2361 CrossRef CAS
- J. Y. Kang, S. Tsunekawa and A. Kasuya, Acta Phys. Sinica, 2001, 50, 2198–2205 CAS
- L. Zhang, L. Yin, C. Wang, N. Lun, Y. Qi and D. Xiang, J. Phys. Chem. C, 2010, 114, 9651–9658 CAS
- U. Koch, A. Fojtik, H. Weller and A. Henglein, Chem. Phys. Lett., 1985, 122, 507–510 CrossRef CAS
- L. Brus, J. Phys. Chem., 1986, 90, 2555–2560 CrossRef CAS
- P. R. Lucena, F. M. Pontes, C. D. Pinheiro, E. Longo, P. S. Pizani, S. Lázaro, A. G. Souza and I. M. G. Santos, Ceramica, 2004, 50, 138–144 CrossRef
- G. Blasse and B. C. Grabmaier, Luminescent Materials, Springer-Verlag, Berlin, 1994 Search PubMed
- M. Izaki, T. Shinagawa and H. Takahashi, J. Phys. D: Appl. Phys., 2006, 39, 1481–1484 CrossRef CAS
- B. D. Yao, Y. F. Chan and N. Wang, Appl. Phys. Lett., 2002, 81, 757–759 CrossRef CAS
- A. B. Djurisic, Y. H. Leung, K. H. Tam, Y. F. Hsu, L. Ding, W. K. Ge, Y. C. Zhong, K. S. Wong, W. K. Chan, H. L. Tam, K. W. Cheah, W. M. Kwok and D. L. Phillips, J. Nanotechnol., 2007, 18, 095702 CrossRef
- S. Duo, Y. Li, Z. Liu, R. Zhong and T. Liu, J. Alloys Compd., 2017, 695, 2563–2579 CrossRef CAS
- L. V. Bora and R. K. Mewada, Renewable Sustainable Energy Rev., 2017, 76, 1393–1421 CrossRef CAS
- J. Ni, J. Gao, X. Geng, D. He and X. Guo, Appl. Phys. A: Mater. Sci. Process., 2017, 123, 186 CrossRef
- H. Liu, T. Lv, C. Zhu and Zh. Zhu, Sol. Energy Mater. Sol. Cells, 2016, 153, 1–8 CrossRef CAS
- E. Pervaiz, H. Liu and M. Yang, Nanotechnology, 2017, 28, 105701 CrossRef PubMed
- S. Garcia-Segura and E. Brillas, J. Photochem. Photobiol., C, 2017, 31, 1–35 CrossRef CAS
- S. G. Kumar and K. S. R. K. Rao, Appl. Surf. Sci., 2017, 391, 124–148 CrossRef CAS
- J. Wang, Y. Chen, G. Liu and Y. Cao, Composites, Part B, 2017, 114, 211–222 CrossRef CAS
- Z. Wang, K. Dai, C. Liang, J. Zhang and G. Zhu, Mater. Lett., 2017, 196, 373–376 CrossRef CAS
- Z. Lin, J. Li, Z. Zheng, J. Yan, P. Liu, Ch. Wang and G. W. Yang, ACS Nano, 2015, 9, 7256–7265 CrossRef CAS PubMed
- L. V. Bora and R. K. Mewada, Renewable Sustainable Energy Rev., 2017, 76, 1393–1421 CrossRef CAS
- M. Pelaez, N. T. Nolan, S. C. Pillai, M. K. Seery, P. Falaras, A. G. Kontos, P. S. M. Dunlop, J. W. J. Hamilton, J. A. Byrne, K. O'Shea, M. H. Entezari and D. D. Dionysiou, Appl. Catal., B, 2012, 125, 331–349 CrossRef CAS
- J. G. McEvoy and Z. Zhang, J. Photochem. Photobiol., C, 2014, 19, 62–75 CrossRef
Footnote |
| † These authors contributed equally to this work. |
| This journal is © The Royal Society of Chemistry 2017 |