DOI:
10.1039/C7RA03227G
(Paper)
RSC Adv., 2017,
7, 22892-22899
High-performance removal of methyl mercaptan by nitrogen-rich coconut shell activated carbon
Received
19th March 2017
, Accepted 18th April 2017
First published on 25th April 2017
Abstract
A series of nitrogen-doped coconut shell activated carbon catalysts were prepared by urea or melamine impregnation followed by heat treatment and used for the removal of methyl mercaptan (CH3SH). The physical and chemical properties of the nitrogen-doped coconut shell activated carbons were evaluated by nitrogen adsorption/desorption, scanning electron microscopy, X-ray photoelectron spectroscopy, elemental analysis, Boehm titration, and thermal analysis. The results show that CH3SH capacity depends on the nitrogen content. Further research indicates that pyridinic nitrogen and quaternary nitrogen are the active sites. Due to the metal-free property of the nitrogen-rich coconut shell activated carbon, the regeneration process can be easily performed and dimethyl disulfide (CH3SSCH3) can be recovered as the main product. Our study indicates that there is a promising prospect for nitrogen-rich coconut shell activated carbon for CH3SH removal because of its high capacity, mild conditions, and easy regeneration.
1. Introduction
As a colorless, polar, and volatile organic sulfur compound, methyl mercaptan (methanethiol, CH3SH) is well known for its disagreeable odour.1,2 It exists widely in petroleum gas, coal gas, and natural gas, and can be emitted from many agricultural and chemical processes. When released into the atmosphere, CH3SH can contribute to the formation of sulfate particles, which potentially change the Earth's radiation balance and lead to acid rain.3,4 In addition to causing environmental pollution, CH3SH can also cause problems in the chemical industry. Sulfur is a well-known poison for many industrial catalysts because of its ability to adsorb strongly onto metal or metal oxide surfaces. For instance, the catalytic activities of modern bi-metallic reforming catalysts decrease significantly in the presence of as little as 1 ppm of sulfur.5 Furthermore, sulfur corrodes pipelines and reactors. Hence, the removal of CH3SH from feedstock gas is extremely important.
Several technologies have been investigated to remove CH3SH from gas, including adsorption, catalytic incineration, catalytic adsorption/oxidation, decomposition, and photocatalytic oxidation.6–10 Among these technologies, catalytic adsorption/oxidation is identified as a promising method because of its high sulfur capacity, mild conditions, and easy regeneration.
Activated carbon has been widely used for the purification of sulfur-containing gas because of its highly developed porous structure, unique surface chemistry, and potential biocompatibility. CH3SH can be easily oxidized to dimethyl disulfide (CH3SSCH3), which is easily stored in the activated carbon pores because of its large molecular size and high boiling point.11–13 The sulfur capacity of activated carbon is affected by both the porosity and surface chemistry. Micropores are favorable for the adsorption of methyl mercaptan.11,14 After methyl mercaptan is adsorbed in the micropores, it will be oxidized to dimethyl disulfide. Furthermore, the sulfur capacity of activated carbon can be enhanced by introducing heteroatoms, such as nitrogen and oxygen, bonded to the carbon matrix and by impregnating the metal oxides as the oxidation centers.14–19
At present, nitrogen-containing carbon materials, which can be derived from the carbonization of nitrogen-containing precursors or the post-treatment of carbon products with nitrogen-rich compounds, are attracting much attention because of their unique properties.20–24 Specifically, nitrogen-doped carbon materials can be used for the removal of small molecular toxic gases, such as CH3SH, NO2, and H2S.14,24,25 However, most research focuses on coal-based activated carbons. Little systematic attention has been devoted to study the removal of CH3SH by activated carbon that contains nitrogen groups. Coconut shell activated carbons, which usually have a more porous structure than coal-based activated carbons, could be effective supports for the adsorption of CH3SH. Herein, we investigate the effect of nitrogen functionalities on the removal of CH3SH by evaluating a series of nitrogen-doped coconut shell activated carbons modified with urea and melamine. The relationships between the CH3SH capacity and the contents of pyridinic nitrogen and quaternary nitrogen were verified. The physical and chemical properties of the nitrogen-doped coconut shell activated carbons were evaluated by nitrogen adsorption/desorption, scanning electron microscopy, X-ray photoelectron spectroscopy, elemental analysis, and Boehm titration. Thermal analysis and gas chromatography-mass spectrometry were used to study the oxidation product stored in the carbon. Moreover, regeneration tests were performed. Finally, a possible overall mechanism is proposed to explain the adsorption/oxidation of CH3SH over the nitrogen-rich coconut shell activated carbon.
2. Materials and methods
2.1. Preparation of catalysts
A commercial coconut shell activated carbon was provided by Fujian Xinsen New Technology Co, Ltd. The initial material was ground, sieved to 10–20 mesh, washed with deionized water, and dried at 115 °C for 12 h in an oven. The initial activated carbon was designated AC. Then, the AC was oxidized with 30 wt% HNO3 at 60 °C and stirred for 3 h. Subsequently, the oxidized activated carbon was filtered and rinsed with deionized water to a neutral pH and dried at 115 °C for 12 h. This oxidized activated carbon was designated ACO. To introduce nitrogen groups, AC and ACO (12 g) were first impregnated with urea or melamine (8 g of urea or melamine in 40 mL of ethanol) at 25 °C for 5 h with vigorous agitation. Then, the mixture was heated to promote ethanol evaporation, and the carbon was dried at 115 °C. Secondly, the impregnated activated carbon was heated in nitrogen from room temperature to 950 °C at 10 °C min−1 and calcined for 30 min. Finally, the activated carbons were rinsed using excess boiling water to remove any water-soluble decomposition products and heated at 115 °C for 12 h. The nitrogen-doped activated carbons were designated ACU, ACOU, ACM, and ACOM, where U and M represent urea and melamine, respectively. For example, ACOU represents AC that was preoxidized, impregnated with urea, and calcined at 950 °C.
2.2. Catalysts characterization
N2 adsorption–desorption isotherms were measured at −196 °C using an Autosorb-iQ (Quantachrome Instruments) surface area analyzer. Before the measurements, the samples were heated and outgassed at 120 °C overnight. The Brunauer–Emmett–Teller (BET) method was used to calculate the specific surface area. The total pore volume was obtained according to the adsorbed N2 volume at a relative pressure of approximately 0.99. The micropore volumes and pore size distributions were calculated using nonlocal density functional theory.26,27 The surface morphologies of the activated carbons were observed using field emission scanning electron microscopy (Quanta 200F) with an accelerating voltage of 20 kV. The elemental analyses (C, H, N) of the original and nitrogen-doped activated carbons were performed using a Euro Vector EA3000 elemental analyzer. X-ray photoelectron spectroscopy (XPS) measurements were recorded using a Thermo ESCALAB 250XI spectrometer with Al Kα radiation. The standard binding energy of C 1s (284.4 eV) was adopted as an internal reference. The results were analyzed using the XPSPEAK 4.1 software. Carbon powder (0.4 g) was mixed with 20 mL of water, and the mixture was stirred for 12 h at room temperature. The pH of the suspension liquid was used to approximate the pH of the carbon surface. Meanwhile, pHE was used to represent the pH of the exhausted samples. Methanol (1 mL) and carbon (0.6 mL) were mixed in a flask and warmed at 60 °C for 1 h. Then, the suspension liquid was analyzed by gas chromatography-mass spectrometry (GC/MS) experiments using a Thermo Fisher DSQ gas chromatograph/mass spectrometer. GC separation was operated on a HP-5 MS quartz tube capillary column (dimensions: 30 m × 0.25 mm × 0.25 μm). The column temperature was increased from 50 °C to 310 °C (5 °C min−1) and maintained for 25 min. An unrestricted library search was used to analyze the results. The carbon sample (0.5 g) was mixed with 25 mL of 0.05 N solutions of HCl and NaOH. The flasks were sealed and shaken for 24 h. Then, 5 mL of each filtrate was taken and the excessive acid or base was equilibrated with sodium hydroxide or hydrochloric acid. The numbers of total acidic sites were obtained according to the hypothesis that NaOH neutralizes all types of acidic sites, including carboxyl, lactonic, and phenolic groups. The number of basic sites was calculated based on the amount of HCl that was consumed by the carbon sample.
2.3. Catalyst activity evaluation
The adsorption capacity of CH3SH was evaluated under atmospheric pressure in a fixed bed quartz reactor. Prior to the test, the activated carbons were humidified with moist air (relative humidity: 80%, 25 °C) for 40 min. Then, the moist air with 0.2% CH3SH (2000 ppm) was passed through the reactor bed. The relative humidity was controlled by a saturator system. In all tests, the overall gas hourly space velocity was standardized at 7500 h−1 by adjusting the calibrated mass flow controllers. The reactor temperature was maintained at 25 °C using a water bath with an accuracy of ±0.1 °C. The concentration of CH3SH in the gaseous effluent was analyzed by a GC-6890 sulfur phosphorus micro-analyzer integrated with a pulsed flame photometric detector. After the adsorption test, the exhausted samples were designated with the letter E. To study the roles of water and oxygen in the removal of CH3SH, desulfurization experiments were also tested using dry air and dry nitrogen as carrier gases. AC and ACOM samples were performed under different conditions and are designated as ACA, ACN, ACOMA, and ACOMN, where A and N represent dry air and dry nitrogen, respectively.
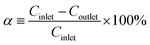
The CH3SH adsorption capacity was determined by the accumulated amount of CH3SH adsorbed when the CH3SH adsorption efficiency dropped to 98%. After the breakthrough test, the CH3SH adsorption capacity was calculated by integration of the area of the CH3SH breakthrough curves as follows:
| |
 | (1) |
| |
 | (2) |
where
α is the CH
3SH removal efficiency,
Cinlet is the entrance concentration (mg m
−3),
Coutlet is the outlet concentration (mg m
−3),
Q is the gas flow (m
3 min
−1),
t is the adsorption time (min),
m is the catalyst quality (g), and
S is the CH
3SH adsorption capacity (mg g
−1).
2.4. Regeneration of exhausted activated carbons
The exhausted activated carbon (6 mL) was mixed with 300 mL of ethanol for 5 h at 50 °C and then filtered. Three cycles were performed, and then the activated carbon was heated at 500 °C for 0.5 h in a nitrogen atmosphere. The regenerated samples are designated with a number that represents the regeneration time.
3. Results and discussion
3.1. Texture and chemical properties of the nitrogen-doped coconut shell activated carbon
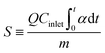
As the reactive molecules diffuse into the pores and the oxidation products are stored therein, the porosity of the activated carbon is crucial to the CH3SH adsorption/oxidation process. The N2 adsorption isotherms and pore size distribution curves of the activated carbons are presented in Fig. 1, and the calculated structural parameters are summarized in Table 1. In Fig. 1a, all samples share a similar isotherm shape and can be classified as type I, which indicates a microporous structure. Moreover, all samples have hysteresis loops at high relative pressures, verifying the presence of mesopores. Similar distribution patterns are presented in Fig. 1b. The pores of all samples are mainly distributed in the micropore range, and partly in the mesopore range. The pore sizes of all samples are mainly below 10 nm. From Table 1, it can be concluded that modifications of activated carbons affect the surface area and pore volumes.
 |
| | Fig. 1 N2 adsorption/desorption isotherms (a) and pore size distribution curves (b) of the samples. | |
Table 1 Structural parameters of samples calculated from the nitrogen adsorption isotherms
| Sample |
SBET (m2 g−1) |
V<1 nm (cm3 g−1) |
Vmic (cm3 g−1) |
Vt (cm3 g−1) |
Vmic/Vt |
| AC |
1508 |
0.329 |
0.571 |
0.807 |
0.708 |
| ACO |
1476 |
0.297 |
0.546 |
0.826 |
0.661 |
| ACU |
1501 |
0.303 |
0.568 |
0.832 |
0.683 |
| ACOU |
1433 |
0.285 |
0.543 |
0.844 |
0.643 |
| ACM |
1397 |
0.313 |
0.534 |
0.697 |
0.766 |
| ACOM |
1358 |
0.299 |
0.509 |
0.718 |
0.709 |
The AC sample has a BET surface area of 1508 m2 g−1, a micropore volume of 0.571 cm3 g−1, and a total pore volume of 0.807 cm3 g−1. Nitric acid oxidation increases the total pore volume and decreases the micropore volume and BET surface area. These observations indicate the erosion and pore-widening effects of nitric acid treatment, which are consistent with previous reports.28–30 A small decrease of the micropore volume and a small increase of the total pore volume are found for the urea-modified ACU and ACOU samples. In addition, the micropore and total pore volumes of the melamine-modified ACM and ACOM samples show obvious decreasing trends, which are probably due to that the introduced nitrogen-containing species create steric hindrances and partially prevent the access of nitrogen molecules into the micropores.31,32
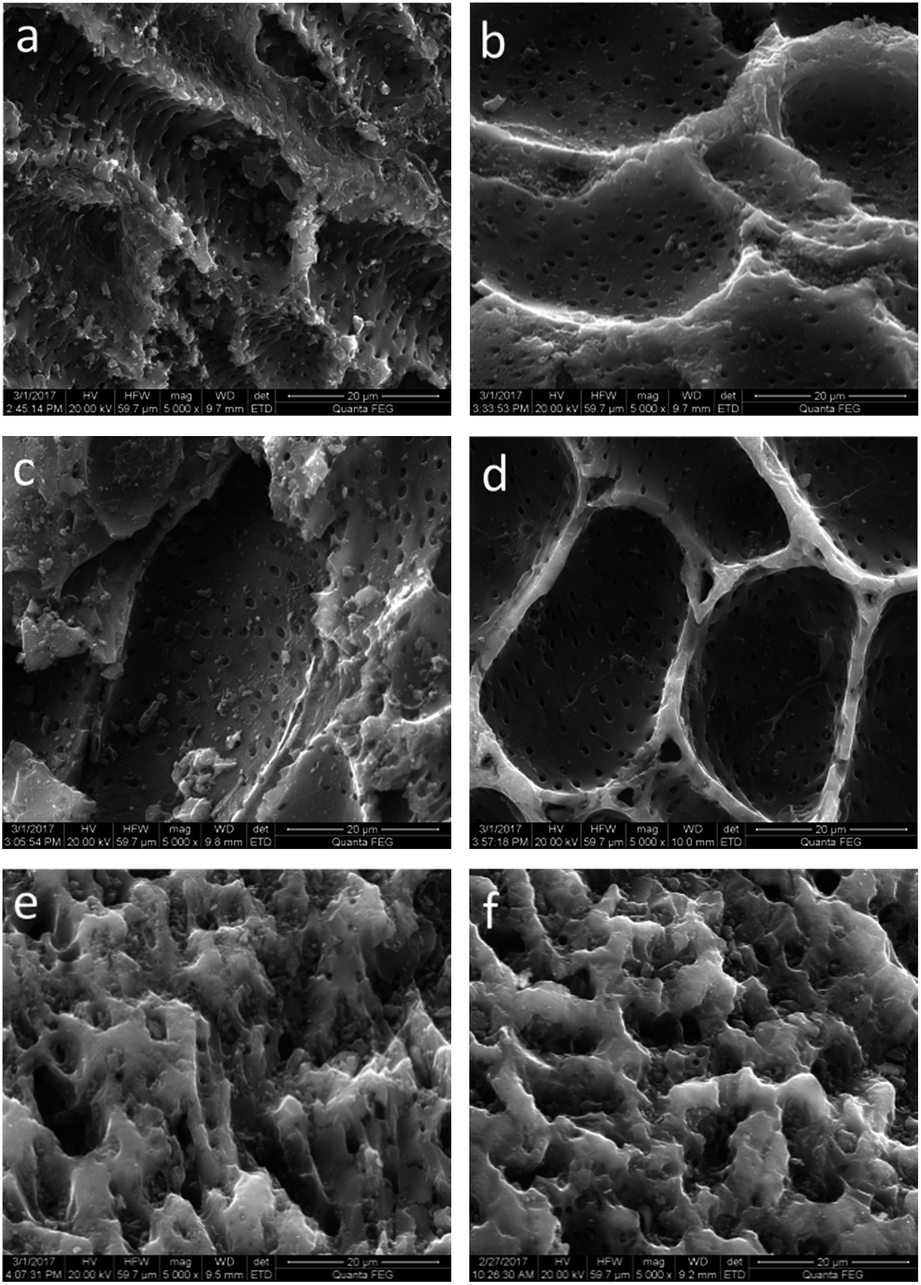
The SEM micrographs of the original activated carbon and modified activated carbons are illustrated in Fig. 2. An abundant porous structure is observed on the activated carbon surface, which favors CH3SH adsorption. After nitric acid oxidation, little difference is found for the surface morphology of AC and ACO, except for some pore widening and the cleaner surface of ACO, which is due to the erosion and cleansing effect of nitric acid.33–35 Different nitrogen precursors provide different impacts on the surface morphologies. The surface morphologies of ACU and ACOU are similar to those of AC and ACO, but obvious pore blockages are found on the surfaces of ACM and ACOM compared to the surfaces of AC and ACO. This indicates that the surface area and pore volume of the nitrogen-doped carbons decrease with the introduction of nitrogen by melamine, which is consistent with the BET results.
 |
| | Fig. 2 SEM images of (a) AC, (b) ACO, (c) ACU, (d) ACOU, (e) ACM, and (f) ACOM. | |
The surface chemistry of activated carbon is an important aspect in the removal of CH3SH. The acid–base properties of the representative samples were investigated by Boehm titration, and the results are shown in Table 2.36 The number of acidic groups increases sharply while the number of basic groups decreases to almost zero after nitric acid oxidation. As expected, modification of the nitrogen-containing groups significantly increases the number of basic groups, especially for the pre-oxidized samples, which is consistent with the changes of the surface pH values.
Table 2 Results of the Boehm titration (number of surface groups) and surface pH values
| Sample |
pH |
Acidic (mmol g−1) |
Basic (mmol g−1) |
All (mmol g−1) |
| AC |
7.34 |
0.47 |
0.55 |
1.02 |
| ACO |
3.32 |
1.65 |
0 |
1.65 |
| ACU |
8.79 |
0.40 |
0.74 |
1.14 |
| ACOU |
8.48 |
0.39 |
0.69 |
1.08 |
| ACM |
8.94 |
0.43 |
0.96 |
1.39 |
| ACOM |
8.31 |
0.41 |
0.66 |
1.07 |
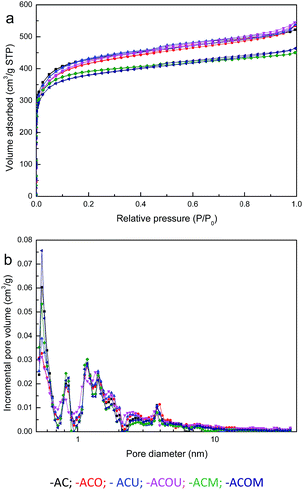
Elemental analysis and XPS were conducted to investigate the nitrogen contents and species of the activated carbons. According to the results shown in Table 3, the nitrogen contents of the samples after modification with urea and melamine can be ranked as ACU < ACOU < ACM < ACOM. Nitric acid oxidation is conducive to introducing nitrogen groups by increasing the number of acidic groups that can react with the precursors. Furthermore, 0.55% of the nitrogen in ACO is mainly in the form of nitrate and nitric oxides, which were introduced by the nitric acid treatment.31 Moreover, compared with the urea-modified samples, the melamine-modified samples have more nitrogen, which may be because the high content of nitrogen in the melamine molecule and its conversion to melamine resins at high temperatures.31 Fig. 3 exhibits the N 1s XPS results of the nitrogen-doped samples. The N 1s spectrum is composed of four peaks at 398.7 ± 0.3, 400.3 ± 0.2, 401.4 ± 0.3, and 403 ± 0.3 eV, which are assigned to pyridinic nitrogen (N-6), pyrrolic nitrogen (N-5), quaternary nitrogen (N-Q), and pyridine-N-oxide (N-X), respectively.37–42 The percent contributions of surface nitrogen species are summarized in Table 4, and the dominant nitrogen species on the surface of nitrogen-doped activated carbons are pyridinic nitrogens. Nitric acid oxidation leads to higher relative contents of pyridine-N-oxide and less pyrrolic nitrogen. The reason may be that nitric acid oxidation increases the acidic groups and creates more active sites on the surface of activated carbon, which is beneficial for nitrogen incorporation into the carbon matrix in a pyridinic-like nitrogen configuration. In addition, a small amount of pyridinic nitrogen can be converted into pyridine-N-oxide. The activated carbons modified by melamine contain lower relative amounts of pyridinic nitrogen and quaternary nitrogen than the corresponding activated carbons modified by urea. However, the melamine modification provides more nitrogen. Thus, the overall contents of pyridinic nitrogen and quaternary nitrogen in the activated carbons increase when melamine is used as a precursor.
Table 3 Carbon, hydrogen, and nitrogen contents (%) of the samples
| Sample |
C |
H |
N |
| AC |
85.66 |
0.92 |
0.16 |
| ACO |
81.58 |
0.52 |
0.55 |
| ACU |
89.75 |
0.56 |
1.02 |
| ACOU |
89.02 |
0.67 |
1.43 |
| ACM |
87.63 |
0.54 |
3.52 |
| ACOM |
86.39 |
0.71 |
4.47 |
 |
| | Fig. 3 N 1s XPS spectra of (a) ACU, (b) ACOU, (c) ACM, and (d) ACOM. | |
Table 4 Surface nitrogen contents and distribution of nitrogen species of the samples derived from the N 1s spectra
| Sample |
Nitrogen content (at%) |
Distributions of nitrogen species (%) |
| N-6 |
N-5 |
N-Q |
N-X |
| ACU |
1.39 |
50.06 |
31.11 |
16.13 |
2.70 |
| ACOU |
2.52 |
51.38 |
26.33 |
16.08 |
6.21 |
| ACM |
3.45 |
48.82 |
30.83 |
15.79 |
4.56 |
| ACOM |
4.41 |
48.53 |
27.42 |
15.48 |
8.57 |
3.2. Desulfurization activity
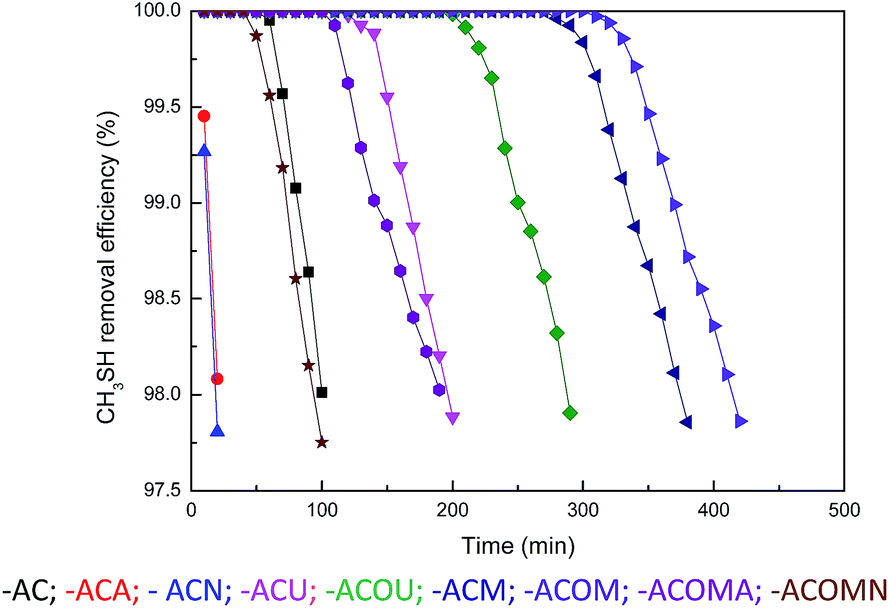
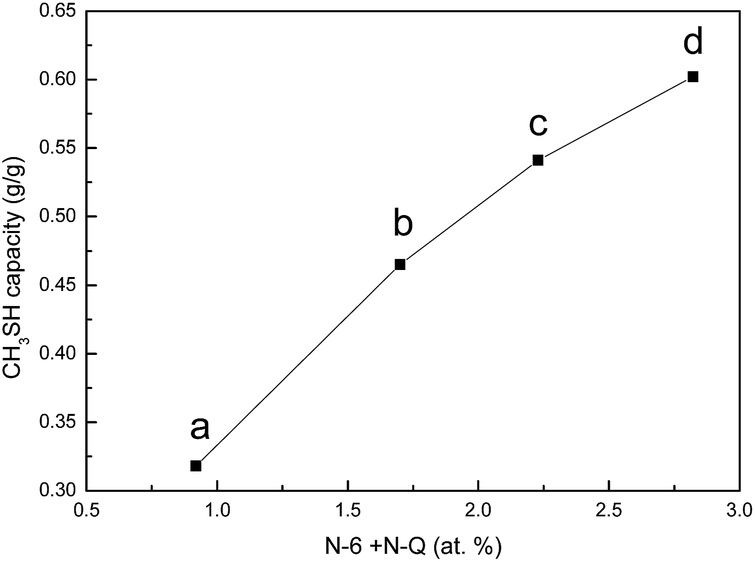
The original and nitrogen-doped activated carbons were tested for the adsorption/oxidation of CH3SH, and the breakthrough curves are presented in Fig. 4. The breakthrough time changes with the introduction of nitrogen over all samples. The calculated CH3SH breakthrough capacities from the curves are presented in Table 5. The CH3SH capacity of the original activated carbon is only 161.8 mg g−1. However, for the nitrogen-doped samples, higher CH3SH capacities are achieved for higher quantities of nitrogen. The highest breakthrough CH3SH capacity, as high as 602.1 mg g−1, is achieved for the ACOM sample in which the surface nitrogen content is 4.41 at%. This breakthrough CH3SH capacity is among the highest CH3SH capacities reported in the literature.11,14,16 Thus, the introduction of nitrogen-containing species is critical to the removal of CH3SH. According to the XPS results, there are four types of nitrogen functionalities after heat-treatment. As indicated in the literature, pyridinic nitrogen and quaternary nitrogen are beneficial to the oxidation of sulfur and nitrogen-containing compounds because of their strong electron transfer abilities.14,24,25 The correlation between the contents of pyridinic nitrogen and quaternary nitrogen obtained from XPS results and the CH3SH capacities of the nitrogen-doped activated carbons (ACU, ACOU, ACM, and ACOM) is discussed to illustrate the effects of these two types of nitrogen species. As shown in Fig. 5, the CH3SH capacity increases with the contents of pyridinic nitrogen and quaternary nitrogen, which indicates that pyridinic nitrogen and quaternary nitrogen are responsible for CH3SH oxidation. Therefore, we conclude that the contents of pyridinic nitrogen and quaternary nitrogen are critical to implement CH3SH catalytic oxidation of activated carbon.
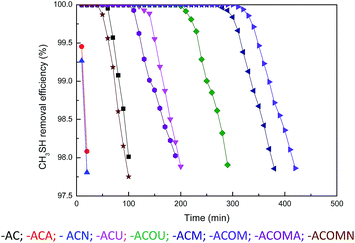 |
| | Fig. 4 Removal efficiency of CH3SH from the samples. | |
Table 5 pH of the carbon surface, amount of preadsorbed water, and CH3SH breakthrough capacities for the samples
| Sample |
pH |
pHE |
Amount of water (mg g−1) |
CH3SH capacity (mg g−1) |
| AC |
7.34 |
7.02 |
152.3 |
161.8 |
| ACA |
7.34 |
7.19 |
0 |
38.7 |
| ACN |
7.34 |
7.21 |
0 |
33.2 |
| ACU |
8.79 |
6.62 |
158.6 |
318.2 |
| ACOU |
8.48 |
5.28 |
163.4 |
465.7 |
| ACM |
8.94 |
4.76 |
154.3 |
541.3 |
| ACOM |
8.31 |
3.16 |
159.7 |
602.1 |
| ACOMA |
8.31 |
5.73 |
0 |
273.3 |
| ACOMN |
8.31 |
7.25 |
0 |
142.8 |
 |
| | Fig. 5 Correlation between the CH3SH capacity and the amount of N-6 + N-Q of (a) ACU, (b) ACOU, (c) ACM, and (d) ACOM. | |
The experiments were also conducted under various conditions, including the absence of oxygen and water in the feed gas, to study the effects of oxygen and water on the removal of CH3SH. AC and ACOM were tested and the results are summarized in Fig. 4 and Table 5. The breakthrough CH3SH capacity of AC in the absence of moisture is at least three times smaller than that in the presence of moisture. Meanwhile, oxygen has different roles in the adsorption/oxidation of CH3SH on AC and ACOM. For AC, the breakthrough CH3SH capacity is almost the same under dry conditions, despite the presence of oxygen. Nevertheless, the breakthrough CH3SH capacity of ACOM under dry air conditions is almost twice that measured without oxygen. A thin water film can form on the carbon surface in the presence of water.25 CH3SH dissolves into the water film and dissociates to the thiolate ion, which can be further oxidized to CH3SSCH3.43 In the absence of moisture, CH3SH is first adsorbed onto the carbon surface, and then the adsorbed CH3SH can be oxidized to CH3SSCH3.44 There is little difference in the CH3SH capacity of AC in dry air and dry nitrogen, which demonstrates the lack of participation of oxygen from the air in the removal of CH3SH due to the lack of catalytic sites. However, the larger CH3SH capacity of ACOM in dry air than that in dry nitrogen confirms the strong catalytic oxidation property of nitrogen-rich activated carbon. According to these results, we can deduce that water and oxygen are beneficial to the removal of CH3SH.
3.3. Analysis of the CH3SH oxidation product over the samples
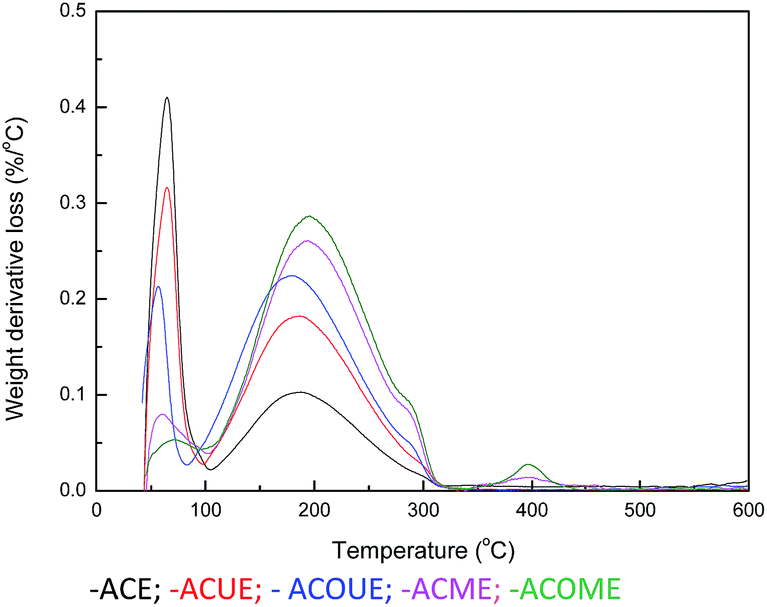
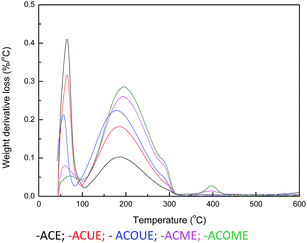
Thermal analysis (TA) experiments were performed to analyze the product adsorbed on the surface of the exhausted carbons, in which the weight loss at a certain temperature range could indicate the quantity of corresponding sulfur species.45,46 Differential thermogravimetry (DTG) curves for the exhausted carbons are displayed in Fig. 6, and three main peaks are observed for the samples. Firstly, the peak located below 100 °C corresponds to the removal of H2O. Considering the oxidation of CH3SH, the second peak between 100 °C and 300 °C may represent the desorption of CH3SSCH3.
 |
| | Fig. 6 DTG curves in argon for the exhausted samples. | |
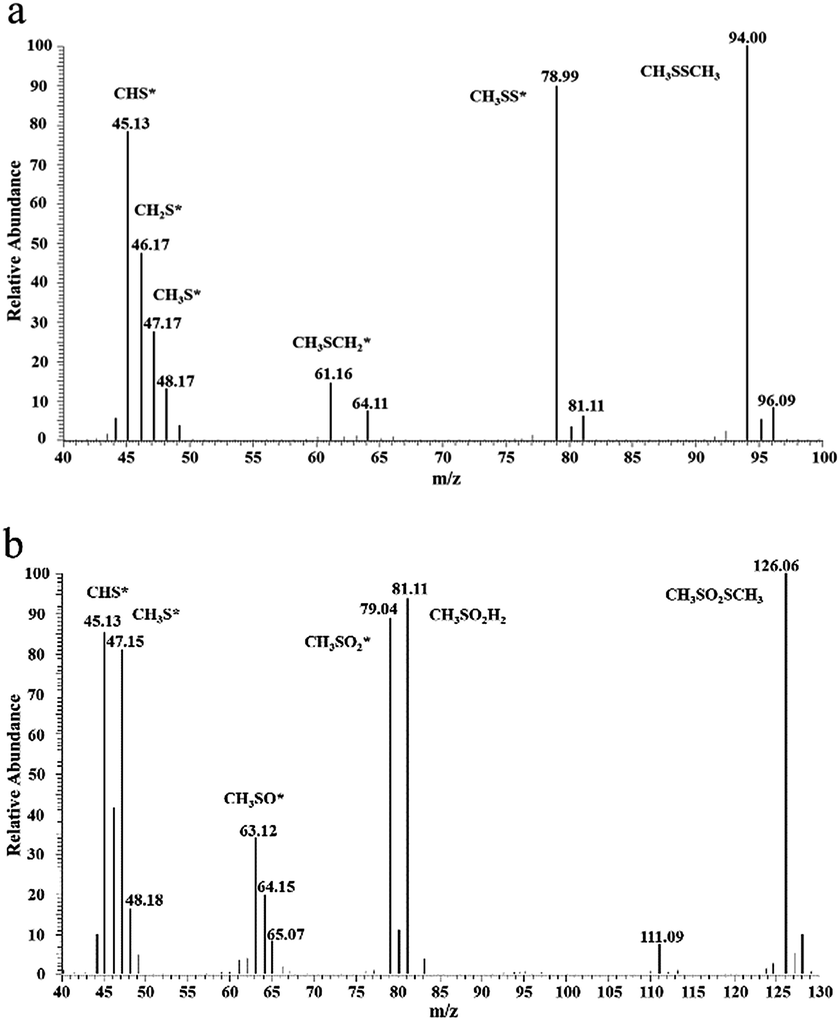
There is a shoulder around 290 °C for the ACOUE, ACME, and ACOME samples. Furthermore, for the ACME and ACOME samples, there is another peak between 350 °C and 450 °C, and the peak area increases with respect to the content of nitrogen. Further oxidation of sulfur species is found for the nitrogen-doped carbons under wet air conditions. The difference in pH between the fresh and exhausted carbons in Table 5 also manifests the formation of acidic oxidation products. The GC/MS results for ACOME are shown in Fig. 7. There are two peaks that represent the presence of CH3SSCH3 and methyl methane thiosulfonate, according to an unrestricted library research. According to the above results, the shoulder around 290 °C may represent the removal of methyl methane thiosulfonate. The peak between 350 °C and 450 °C may represent the desorption of a deeper oxidation product, likely methanesulfonic acid. In view of the highest breakthrough CH3SH capacity of the ACOM sample, the area of the peak between 100 °C and 300 °C is the largest of the samples. There is no peak representing the removal of water. CH3SSCH3 was more easily adsorbed on the carbon surface than water. Therefore, water could be completely replaced, and the carbon surface would be covered by CH3SSCH3 when the content of CH3SSCH3 was high.
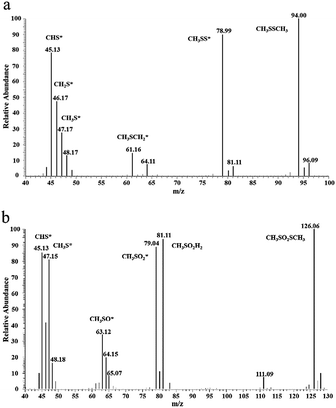 |
| | Fig. 7 GC/MS spectra for species extracted from ACOME: (a) dimethyl disulfide, (b) methyl methanethiosulfonate. | |
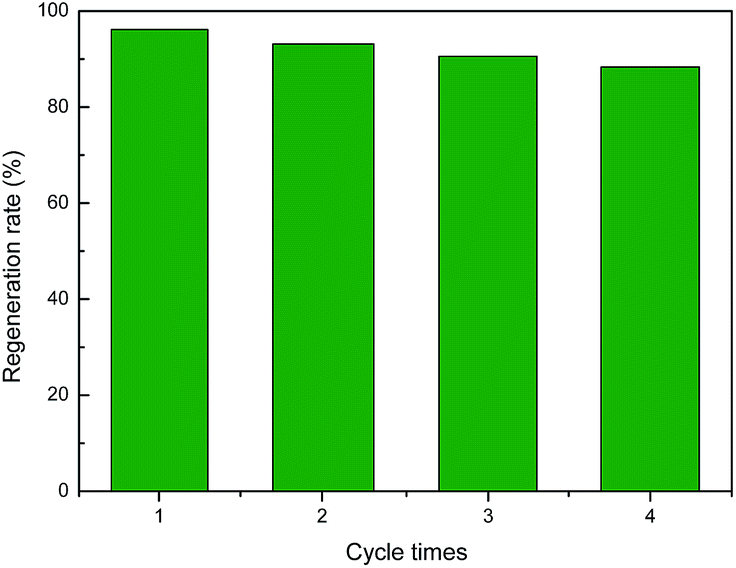
3.4. Regeneration of the exhausted ACOME for CH3SH adsorption/oxidation
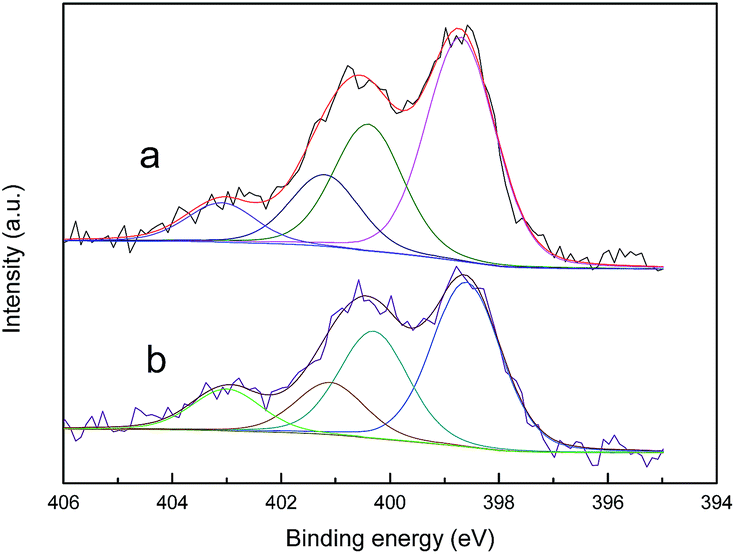
As the main oxidation product of CH3SH, CH3SSCH3 can be easily removed from the carbon surface. The exhausted activated carbon was regenerated through ethanol scrubbing and thermal treatment. As shown in Fig. 8, after four regeneration cycles, only a slight decrease in the CH3SH capacity of ACOM-4 was found, with a reserved CH3SH capacity of 88.33%. The structure and chemical properties of fresh ACOM and regenerated ACOM-4 were studied to explore the mechanism. The N2 adsorption isotherms and pore size distribution curves of ACOM and ACOM-4 are presented in Fig. 9, and the calculated structural parameters are summarized in Table 6. Similar isotherms are observed for the two samples. After four regeneration cycles, only a slight decrease in the pore volume of ACOM-4 occurred, especially in the micropore volume, which is confirmed by the pore size distribution curves. The XPS results for ACOM and ACOM-4 are shown in Fig. 10 and Table 7. The results indicate that the surface nitrogen content slightly decreases from 4.41 at% to 4.12 at%. Specifically, there is a slight decrease in the relative contents of pyridinic nitrogen and quaternary nitrogen and a slight increase in the contents of pyrrolic nitrogen and pyridine-N-oxide. The regeneration tests indicate that the pore structure is basically recovered and the active nitrogen domains are stable; thus, a good regeneration performance was observed.
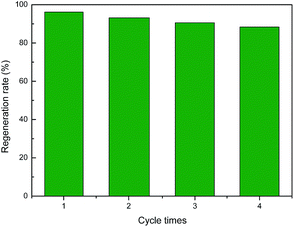 |
| | Fig. 8 Regeneration rate of ACOME. | |
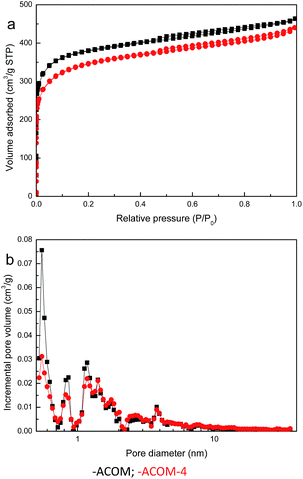 |
| | Fig. 9 N2 adsorption/desorption isotherms (a) and pore size distribution curves (b) of the samples. | |
Table 6 Structural parameters of samples calculated from the nitrogen adsorption isotherms
| Sample |
SBET (m2 g−1) |
V<1 nm (cm3 g−1) |
Vmic (cm3 g−1) |
Vt (cm3 g−1) |
Vmic/Vt |
| ACOM |
1358 |
0.299 |
0.509 |
0.718 |
0.709 |
| ACOM-4 |
1261 |
0.247 |
0.456 |
0.681 |
0.670 |
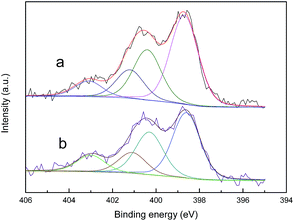 |
| | Fig. 10 N 1s XPS spectra of (a) ACOM, and (b) ACOM-4. | |
Table 7 Surface nitrogen contents and distribution of nitrogen species derived from the N 1s spectra
| Sample |
Nitrogen content (at%) |
Distributions of nitrogen species (%) |
| N-6 |
N-5 |
N-Q |
N-X |
| ACOM |
4.41 |
48.53 |
27.42 |
15.48 |
8.57 |
| ACOM-4 |
4.12 |
45.12 |
29.25 |
14.16 |
11.47 |
3.5. Possible reaction mechanism of CH3SH catalytic oxidation
Active nitrogen sites play an important role in the adsorption/oxidation of CH3SH based on the interaction between the CH3SH capacity and the contents of pyridinic nitrogen and quaternary nitrogen in the nitrogen-doped activated carbons. An overall mechanism is proposed to describe the CH3SH adsorption/oxidation process over the nitrogen-rich coconut shell activated carbon. A thin water film is formed on the carbon surface with the introduction of a moist gas. CH3SH molecules are adsorbed on the surface and dissolve into the water film, which can dissociate into protons and thiolate ions. Pyridinic nitrogen can act as a Lewis basic site with a lone electron pair. Thus, the presence of pyridinic nitrogen could promote the dissociation of CH3SH to thiolate ions. As suggested by Strelko, the extra electrons of pyridinic nitrogen and quaternary nitrogen occupy the high-energy states.47 The electrons could be transferred from the thiolate ion to the adsorbed oxygen, forming thiolate radicals and superoxide ions, because the two types of nitrogen groups enhance the ion-exchange properties of the carbons. These superoxide ions can react with water, forming hydroxyl radicals. All of these species could also facilitate oxidation. Finally, water and CH3SSCH3 are formed and stored in the pores. Considering the presence of water and active sites, such as hydroxyl radicals and oxygen radicals, CH3SSCH3 can be further oxidized into methyl methane thiosulfonate and methanesulfonic acid, as demonstrated by the DTG and GC/MS results. The oxidation process will proceed until all the pores with active nitrogen centers are filled with the oxidation products. The exhausted sample can be recovered by ethanol exaction and thermal regeneration. Despite the slight decrease in pore volume and nitrogen content, the CH3SH capacity can be maintained during the regeneration process.
4. Conclusions
In summary, a series of nitrogen-doped coconut shell activated carbons were prepared and used for the removal of CH3SH. The results demonstrate that the CH3SH capacities of these modified activated carbons increase with the contents of nitrogen, especially pyridinic nitrogen and quaternary nitrogen. The unparalleled CH3SH capacity of the nitrogen-rich coconut shell activated carbon can be obtained when the nitrogen content is 4.41 at%. The main product adsorbed on the carbon surface is CH3SSCH3, while some deeper oxidation products, such as methyl methane thiosulfonate and methanesulfonic acid, are also generated because of the strong oxidative ability of the nitrogen-rich coconut shell activated carbon. The exhausted nitrogen-rich carbons can be easily regenerated by ethanol scrubbing and thermal treatment, making them effective adsorbents of CH3SH in industrial fields.
Notes and references
- L. Ding, T. Liu and X. Li, J. Chem. Technol. Biotechnol., 2014, 89, 455–461 CrossRef CAS.
- M. C. Iliuta and F. Larachi, J. Chem. Eng. Data, 2007, 52, 2–19 CrossRef CAS.
- M. E. Whelan, D. Min and R. C. Rhew, Atmos. Environ., 2013, 73, 131–137 CrossRef CAS.
- T. Wu, X. Wang, D. Li and Z. Yi, Atmos. Environ., 2010, 44, 5065–5071 CrossRef CAS.
- C. Rhodes, S. A. Riddel, J. West, B. P. Williams and G. J. Hutchings, Catal. Today, 2000, 59, 443–464 CrossRef CAS.
- W. Cai, G. Lu, J. He and Y. Lan, Ceram. Int., 2009, 38, 3167–3174 CrossRef.
- C. Cammarano, E. Huguet, R. Cadours, C. Leroi, B. Coq and V. Hulea, Appl. Catal., B, 2014, 156–157, 128–133 CrossRef CAS.
- M. G. Conti-Ramsden, K. Nkrumah-Amoako, N. W. Brown and E. P. L. Roberts, Adsorption, 2013, 19, 989–996 CrossRef CAS.
- E. Huguet, B. Coq, R. Durand, C. Leroi, R. Cadours and V. Hulea, Appl. Catal., B, 2013, 134–135, 344–348 CrossRef CAS.
- R. C. van Leerdam, P. L. F. van den Bosch, P. N. L. Lens and A. J. H. Janssen, Environ. Sci. Technol., 2011, 45, 1320–1326 CrossRef CAS PubMed.
- A. Bagreev, J. A. Menendez, I. Dukhno, Y. Tarasenko and T. J. Bandosz, Carbon, 2005, 43, 208–210 CrossRef CAS.
- S. Bashkova, A. Bagreev and T. J. Bandosz, Environ. Sci. Technol., 2002, 36, 2777–2782 CrossRef CAS PubMed.
- H. Cui and S. Q. Turn, Appl. Catal., B, 2009, 88, 25–31 CrossRef CAS.
- S. Bashkova, A. Bagreev and T. J. Bandosz, Langmuir, 2003, 19, 6115–6121 CrossRef CAS.
- E. Vega, J. Lemus, A. Anfruns, R. Gonzalez-Olmos, J. Palomar and M. J. Martin, J. Hazard. Mater., 2013, 258–259, 77–83 CrossRef CAS PubMed.
- D. J. Kim and J. E. Yie, J. Colloid Interface Sci., 2005, 283, 311–315 CrossRef CAS PubMed.
- S. Lee, W. M. A. W. Daud and M. Lee, J. Ind. Eng. Chem., 2010, 16, 973–977 CrossRef CAS.
- H. Tamai, H. Nagoya and T. Shiono, J. Colloid Interface Sci., 2006, 300, 814–817 CrossRef CAS PubMed.
- S. Zhao, H. Yi, X. Tang, F. Gao, B. Zhang, Z. Wang and Y. Zuo, J. Cleaner Prod., 2015, 87, 856–861 CrossRef CAS.
- H. Zhong, H. Zhang, S. Liu, C. Deng and M. Wang, ChemSusChem, 2013, 6, 807–812 CrossRef CAS PubMed.
- N. Yan and X. Chen, Nature, 2015, 524, 155–157 CrossRef CAS PubMed.
- T. Nguyen, K. E. Shopsowitz and M. J. MacLachlan, J. Mater. Chem. A, 2014, 2, 5915–5921 CAS.
- X. Chen, H. Yang and N. Yan, Chem.–Eur. J., 2016, 22, 13402–13421 CrossRef CAS PubMed.
- S. Bashkova and T. J. Bandosz, J. Colloid Interface Sci., 2009, 333, 97–103 CrossRef CAS PubMed.
- F. Sun, J. Liu, H. Chen, Z. Zhang, W. Qiao, D. Long and L. Ling, ACS Catal., 2013, 3, 862–870 CrossRef CAS.
- J. Jagiello and J. P. Olivier, Carbon, 2013, 55, 70–80 CrossRef CAS.
- J. Jagiello, C. Ania, J. B. Parra and C. Cook, Carbon, 2015, 91, 330–337 CrossRef CAS.
- X. Liu, J. Guo, Y. Chu, D. Luo, H. Yin, M. Sun and Y. Reha, Fuel, 2014, 123, 93–100 CrossRef CAS.
- G. Zhang, Z. Li, H. Zheng, T. Fu, Y. Ju and Y. Wang, Appl. Catal., B, 2015, 179, 95–105 CrossRef CAS.
- H. Shamsijazeyi and T. Kaghazchi, J. Ind. Eng. Chem., 2010, 16, 852–858 CrossRef CAS.
- M. Seredych, D. Hulicova-Jurcakova, G. Lu and T. J. Bandosz, Carbon, 2008, 46, 1475–1488 CrossRef CAS.
- A. Bagreev, J. Angel Menendez, I. Dukhno, Y. Tarasenko and T. J. Bandosz, Carbon, 2004, 42, 469–476 CrossRef CAS.
- X. Lu, J. Jiang, K. Sun, X. Xie and Y. Hu, Appl. Surf. Sci., 2012, 258, 8247–8252 CrossRef CAS.
- J. Chen, Y. Zhai, H. Chen, C. Li, G. Zeng, D. Pang and P. Lu, Appl. Surf. Sci., 2012, 263, 247–253 CrossRef CAS.
- L. Li, S. Liu and J. Liu, J. Hazard. Mater., 2011, 192, 683–690 CrossRef CAS PubMed.
- H. P. Boehm, Adv. Catal., 1966, 16, 179–274 CAS.
- M. A. Nahil and P. T. Williams, J. Chem. Eng., 2012, 184, 228–237 CrossRef CAS.
- H. Xiong, M. A. Motchelaho, Z. N. Tetana, S. M. A Dube, L. L. Jewell and N. J. Coville, J. Catal., 2014, 311, 80–87 CrossRef CAS.
- A. Nieto-Márquez, D. Toledano, P. Sánchez, A. Romero and J. L. Valverde, J. Catal., 2010, 269, 242–251 CrossRef.
- L. Lin, Q. Zhu and A. W. Xu, J. Am. Chem. Soc., 2014, 136, 11027–11033 CrossRef CAS PubMed.
- J. Han, S. Lee, K. Choi, J. Kim, D. Ha, C. G. Lee, B. An, S. H. Lee, H. Mizuseki, J. W. Choi and S. Kang, J. Hazard. Mater., 2016, 302, 375–385 CrossRef CAS PubMed.
- Y. Gao, X. Chen, J. Zhang and N. Yan, ChemPlusChem, 2015, 80, 1556–1564 CrossRef CAS.
- S. Bashkova, A. Bagreev and T. J. Bandosz, Catal. Today, 2005, 99, 323–328 CrossRef CAS.
- S. Bashkova, A. Bagreev and T. J. Bandosz, Ind. Eng. Chem. Res., 2002, 41, 4346–4352 CrossRef CAS.
- F. Adib, A. Bagreev and T. J. Bandosz, J. Colloid Interface Sci., 1999, 214, 407–415 CrossRef CAS PubMed.
- F. Adib, A. Bagreev and T. J. Bandosz, Environ. Sci. Technol., 2000, 34, 686–692 CrossRef CAS.
- V. V. Strelko, V. S. Kuts and P. A. Thrower, Carbon, 2000, 38, 1499–1503 CrossRef CAS.
|
| This journal is © The Royal Society of Chemistry 2017 |
Click here to see how this site uses Cookies. View our privacy policy here. 
 Open Access Article
 This Open Access Article is licensed under a
  ,
Ming Ke*,
Feng Liu,
Pei Yu,
Haiqiang Hu and
Changchun Li
,
Ming Ke*,
Feng Liu,
Pei Yu,
Haiqiang Hu and
Changchun Li