 Open Access Article
In vitro–in vivo evaluation of hyaluronic acid-based amphiphilic copolymers for tumour targeted delivery: the role of hydrophobic groups†
Zhihong Zhu,
Dongyang Li,
Yuenan Li,
Xinggang Yang* and
Weisan Pan *
*
Shenyang Pharmaceutical University, No. 103, Wenhua Road, Shenyang 110016, China. E-mail: pppwwwsss@163.com; yangxg123@163.com
First published on 3rd May 2017
Abstract
Polymeric micelles are widely used as suitable nano-carriers for a variety of therapeutic applications. Exploring the role of hydrophobic groups on the properties of the amphiphilic carrier and micelles were the aim of this study. Using hyaluronic acid (HA), cholesterol (CHOL) and octadecanoic acid (OA), two amphiphilic polymers were prepared and fully characterized by 1H NMR, FTIR and DSC. Compared with HA–SA–CYS–OA, HA–SA–CYS–CHOL had a lower critical micellar concentration (CMC) producing docetaxel (DTX)-loaded micelles of a smaller particle size, higher encapsulation efficiency (EE) and drug loading (DL%). However, HA–SA–CYS–OA had the greater EE when loaded with coumarin-6 (Cou6), suggesting that hydrophobic groups had a degree of selectivity for drugs. Cellular uptake demonstrated that the two micelles clearly increased the internalization of DTX via CD44 receptor-mediated endocytosis. In vitro cytotoxic experiments showed that HA–SA–CYS–OA micelles were generally more cytotoxic to MCF-7, A549 and S-180 cells on account of the toxicity of octadecanoic acid while in vivo animal experiments confirmed that HA–SA–CYS–CHOL micelles exhibited better tumor-targeting properties and antitumor effects. From these preliminary evaluations, it is possible to conclude that hydrophobic groups not only affect the stability and drug-loading capacity of the amphiphilic carriers, but also influence the distribution, metabolism, excretion and ultimately, the antitumor efficacy of micelles.
Introduction
Polymeric micelles, with a great difference in hydrophilic properties between the hydrophilic and the hydrophobic groups, are widely used as suitable nano-carriers for a variety of therapeutic applications.1 It has been reported that the distribution of micelles in the body may be determined mainly by their size and surface properties2 and the physicochemical and biological properties of the micelles are mainly determined by the functionalization of the outer surface. Based on this, a number of passive and active targeting polymeric micelles have been developed. However, the anti-tumour effect in the clinic is not significant. As an essential component of an amphiphilic copolymer, the physical and chemical properties of hydrophobic groups can influence the association behaviour of micelles in solution and their affinity for interfaces.3 Therefore, we hypothesize that the hydrophobic groups have an effect on the pharmacokinetic and physicochemical properties of the micelles. It is time to take hydrophobic groups into account for developing better anti-tumour drug delivery systems. Studies have shown that hydrophobic groups can increase the solubility of hydrophobic drugs and the stability of the micelles.4,5 It also has been reported that the hydrophobic groups can affected the rheological properties of the carrier6 and the antibacterial activity.7 Even more the length of hydrophobic groups displayed the decisive effect on the gelation behaviour.8 However, researchers have not systematically and holistically studied the influence of hydrophobic groups on the properties of the amphiphilic carrier and micelles yet. In order to fill this gap, our study focuses primarily on the role of the different hydrophobic groups on the anti-tumour effects and on the properties of the amphiphilic carrier and micelles.CD44 is a widely distributed cell surface type I transmembrane glycoprotein, the over-expression of which is connected to the motility, survival and proliferation of the tumour cell and the formation of the tumour microenvironment. Studies have shown that tumour cells often express a number of CD44 variants, particularly when the cancer is in an advanced stage.9 CD44, especially CD44v isoforms, have been identified as CSC surface markers in different types of cancers,10 making CD44 a potential target of tumour therapy. The N-terminal part of CD44 enables binding to hyaluronic acid (HA),11 a kind of acid mucopolysaccharide composing of repeated disaccharide units of D-glucuronic acid and N-acetyl glucosamine.12 HA, with functional groups of carboxylic acid and hydroxyl moieties can be chemically modified by crosslinking or conjugation reactions.13 In addition, HA is an important component of the extracellular matrix and HA modified polymer is a biodegradable, biocompatible, nontoxic and non-immunogenic. There have been emerged more and more nano-platforms mainly with hyaluronic acid and other hydrophobic groups, such as octenyl succinic anhydride (OSA),14 deoxycholic acid (DOCA),15 and octadecylamine.16 Cholesterol is a vital component of cell membranes accounting for over 20% of the plasma membrane lipids and, due to its biocompatibility and biodegradability, cholesterol is often used in studies of drug delivery systems involving nanoparticles.17,18 Modification with cholesterol results in significant improvement of the cellular uptake of polymers for drug delivery applications.19 Octadecanoic acid (OA) is a hydrophobic saturated fatty acid which has been used as a safe biodegradable dietary additive. OA can be grafted to the hydrophilic group because of its good biosafety and suitable molecular weight.20,21 Although cholesterol and OA are widely used in the application of nano-platforms, few studies have involved a comparative investigation of the amphiphilic copolymers composed of octadecanoic acid or cholesterol and HA and, so far, few studies have examined whether hydrophobic groups affect the properties of the amphiphilic carrier and anti-tumour effect of micelles.
Here, our goal was to synthesize two kinds of amphiphilic carriers with the same hydrophilic group and different hydrophobic groups to explore whether the different hydrophobic groups have effects on the nature of the amphiphilic carrier and micelles and even the anti-tumour effect of micelles.
Experimental section
Materials
HA with an average molecular weight of 44 kDa was provided by Shandong Freda Biopharm Co., Ltd. (Shandong, China). Triethylamine, octadecanoic acid (OA, 99%), succinic anhydride (SA, 99%) was obtained from YUWAN GROUP (Shandong, China). N-Hydroxysuccinimide (NHS, 99%), 4-dimethylaminopyridine (DMAP, 99%), benzotriazole-1-yl-oxytripyrrolidinophosphonium hexafluorophosphate (PyBOP), 1-(3-dimethylaminopropyl)-3-ethylcarbodiimidehydrochloride (EDCI, 99%) was obtained from shanghai Medpep Co., Ltd. (Shanghai, China). 3-(4,5-Dimethyl-thiazol-2-yl)-2,5-diphenyl-tetrazoliumbromide (MTT, 98%) and cholesteryl chloroformate (98%) were obtained from Alfa Aesar (China) Chemical Co., Ltd. (Shanghai, China). DiR was obtained from Beijing Fanbo Biochemicals Co., Ltd. (Beijing, China). Docetaxel (DTX) was provided by Jiangsu Hengrui Pharmaceutical Co. Ltd. (Jiangsu, China). Cystamine dihydrochloride (CYS, 98%) was obtained from J&K Scientific Ltd., (Beijing, China). Commercial docetaxel solution (Taxotere®) was obtained from Sanofi-Aventis (France). S-180 murine sarcoma cells, A549 non-small lung cancer cells and MCF-7 human breast cancer cells were purchased from Type Culture Collection of Chinese Academy of Sciences (Shanghai, China). Dulbecco's Modified Eagle Medium (DMEM) and Roswell Park Memorial Institute (RPMI) 1640 medium were obtained from Hyclone Co., Ltd. (Thermo Fisher Scientific., UK) and fetal bovine serum (FBS) were obtained from Sijiqing Co., Ltd. (Hangzhou, China). All other chemicals and reagents used were of analytical grade or cell culture grade and obtained commercially.Synthesis of copolymers
Synthesis of HA–SA–CYS. HA–SA–CYS was obtained by coupling cystamine (CYS) to HA–SA by formation of an amide.22–24 In detail, HA–SA (0.4 g) was dissolved in 100 mL PBS (pH 7.4) with EDCl (0.232 g, 0.12 mmol), NHS (0.13 g, 0.12 mmol) and the mixture was stirred at 25 °C for 30 min. Then CYS (2.25 g, 10 mmol) was added and, after 5 h, the crude product was dialyzed against water in semipermeable tubes (MWCO 8–14 kDa) for three days to obtain the HA–SA–CYS followed by lyophilization (0.19 g, yield: 74.7%).
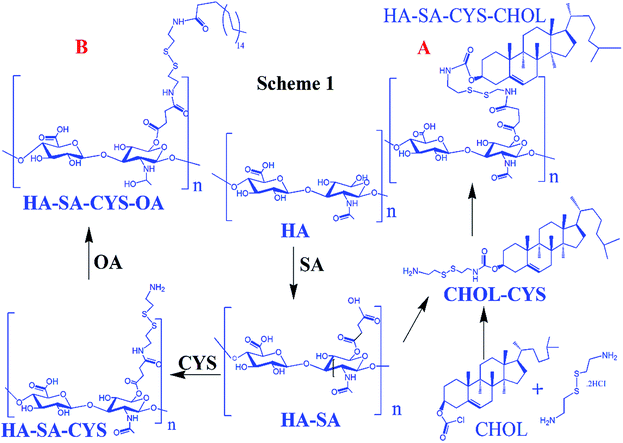
Synthesis of HA–SA–CYS–OA. HA–SA–CYS–OA was obtained by conjugating the primary amines of HA–SA–CYS to the free carboxyl groups of OA.23,25 Firstly, OA (0.36 g, 1.25 mmol) was dissolved in 10 mL DMSO with PyBOP (0.78 g, 1.5 mmol). Then, 100 mL DMSO/FM (4
![[thin space (1/6-em)]](https://www.rsc.org/images/entities/char_2009.gif) :
:![[thin space (1/6-em)]](https://www.rsc.org/images/entities/char_2009.gif) 1, v/v) containing 0.6 g HA–SA–CYS was dropwise to OA solution for reaction for two days, and then the resulting solution was dialyzed against an excess of water for 3 days, and lyophilized, stored at −20 °C (0.49 g, yield: 51%). The whole process is shown in Scheme 1A.
1, v/v) containing 0.6 g HA–SA–CYS was dropwise to OA solution for reaction for two days, and then the resulting solution was dialyzed against an excess of water for 3 days, and lyophilized, stored at −20 °C (0.49 g, yield: 51%). The whole process is shown in Scheme 1A.
Synthesis of the CHOL–CYS26. The CHOL–CYS was synthesized as previously described by the acylation of one of the amine groups of cystamine dihydrochloride. Cystamine dihydrochloride (0.113 g, 0.5 mmol) was dissolved in a mixture of 5 mL 3.5 M NaOH and 4 mL chloroform. This solution was heated to 50 °C, and 10 mL chloroform containing cholesteryl chloroformate (0.225 g, 0.5 mol) was added dropwise while stirring. After 2 h, the aqueous phase was discarded. The remaining organic phase was extracted three times with distilled water, saturated NH4Cl and saturated NaCl, respectively. The organic layer was evaporated to dryness, by vacuum drying (0.31 g, 91.2%). The molecular weight of CHOL–CYS determined by ESI-MS (Bruker Customer, micrOTOF-Q 125) and m/z 564.4 (M+) (Fig. S6†).
Synthesis of HA–SA–CYS–CHOL19. HA–SA–CYS–CHOL was synthesized by activation of HA–SA (0.5 g, 1.24 mmol carboxyl groups) in 100 mL DMSO/FM (4
![[thin space (1/6-em)]](https://www.rsc.org/images/entities/char_2009.gif) :
:![[thin space (1/6-em)]](https://www.rsc.org/images/entities/char_2009.gif) 1, v/v) with PyBOP (0.78 g, 1.5 mmol) and DMAP (0.24 g, 2 mmol) under continuous stirring. Then, CHOL–CYS (0.435 g, 0.77 mmol) in 15 mL DCM was added to react for 2 days at 25 °C. The product was dialyzed in semipermeable tubes (MWCO 8–14 kDa) against water for three days, then lyophilized and stored at-20 °C (0.46 g, 49.2%). The whole process is shown in Scheme 1B.
1, v/v) with PyBOP (0.78 g, 1.5 mmol) and DMAP (0.24 g, 2 mmol) under continuous stirring. Then, CHOL–CYS (0.435 g, 0.77 mmol) in 15 mL DCM was added to react for 2 days at 25 °C. The product was dialyzed in semipermeable tubes (MWCO 8–14 kDa) against water for three days, then lyophilized and stored at-20 °C (0.46 g, 49.2%). The whole process is shown in Scheme 1B.
Characterization of copolymers
The shape and morphology of the nanoparticles prepared using HA–SA–CYS–CHOL or HA–SA–CYS–OA copolymer were examined by transmission electron microscopy (TEM) (JEM-1200EX (120 kV), JEOL, Japan) after negative staining.
The average particle size (diameter, nm), polydispersity index (PDI) and zeta potential of the HA–SA–CYS–CHOL and HA–SA–CYS–OA micelles were measured by dynamic light scattering (DLS) using a Zetasizer Nano ZS90 instrument (Malvern, UK) with a scattering angle of 90° at 25 °C.
DSC was used to measure the physical or chemical changes of micelles with the change of temperature.
The changes in crystalline state of drug was analysed by Powder X-ray diffraction analysis (PXRD) used a D8 ADVANCE powder diffraction meter (Bruker, AXS, Germany) with a scanning angular scope of 5–50° (2θ) in scanning speed of 6° per minute.
The encapsulation efficiency (EE%) and drug loading (DL%) was determined by HPLC. Briefly, 0.1 mL samples of micelles were disrupted with 9.9 mL acetonitrile followed by sonication disruption for 10 min and centrifugation for 10 min at 10![[thin space (1/6-em)]](https://www.rsc.org/images/entities/char_2009.gif) 000 rpm. HPLC conditions were as follows: a Neptune C18 (Neptune C18 5u, Nu-Analytical, CA, USA) was used at a flow rate of 1 mL min−1 and absorption wavelengths of 227, with a UV/VIS detector. The mobile phase used for docetaxel was acetonitrile/water (3
000 rpm. HPLC conditions were as follows: a Neptune C18 (Neptune C18 5u, Nu-Analytical, CA, USA) was used at a flow rate of 1 mL min−1 and absorption wavelengths of 227, with a UV/VIS detector. The mobile phase used for docetaxel was acetonitrile/water (3![[thin space (1/6-em)]](https://www.rsc.org/images/entities/char_2009.gif) :
:![[thin space (1/6-em)]](https://www.rsc.org/images/entities/char_2009.gif) 2 volume ratio).31–33 The EE and DL were calculated using the following formulas:
2 volume ratio).31–33 The EE and DL were calculated using the following formulas:
| DL (%) = (amount of drug in NPs)/(amount of NPs) × 100 |
| EE (%) = (amount of drug in NPs)/(amount of the feeding drug) × 100 |
![[thin space (1/6-em)]](https://www.rsc.org/images/entities/char_2009.gif) 000 rpm for 5 min and assayed by HPLC.
000 rpm for 5 min and assayed by HPLC.In vitro cell study
| Cell viability (%) = (Asample − Ablank)/(Acontrol − Ablank) × 100 |
Confocal laser scanning microscopy (CLSM) was used to qualitatively examine the intracellular uptake of Cou6 loaded NPs. MCF-7, A549 and S-180 cells were cultured on 6-well plates at a density of 2 × 10⁵ per well for 24 h (for S-180 cells, poly-L-lysine cover slips were added for adhesion). The medium was then replaced with Cou6-loaded micelles (3 μg mL−1). After incubating at 37 °C for 2 h, the culture medium was removed and the cells were rinsed with PBS three times and fixed with a 4% paraformaldehyde solution. For nuclear staining, the cells were incubated with 4,6-diamino-2-phenylindole (DAPI) for 5 min at room temperature, followed by washing with PBS (pH 7.4) three times. The intracellular localization of the nanoparticles was observed using a CLSM instrument (LSM 710, Carl Zeiss, Zeiss Germany).
The cellular uptake mechanism was investigated a competitive inhibition study using free HA (10 mg mL−1).
| TIR (%) = (Wcontrol − Wsample)/Wcontrol × 100 |
Results and discussion
Synthesis and characterization of HA-modified copolymers
The successful synthesis of HA–SA–CYS–CHOL (OA) was confirmed by 1H-NMR as shown in Fig. 1A. Compared with HA, in the spectrum of HA–SA–CYS–CHOL, there was a characteristic peak at δ 2.29 (–CH2– on –CH(O)CH2–), δ 5.15 (–CH– on cyclohexene) ppm assigned to the steroid rings of the cholesterol fragment, δ 2.96 (–CH– on succinyl –CO–CH2–), δ 2.68 (–CH– on succinyl –CO–CH2–) ppm which belong to the succinyl segment and δ 3.17 (–CH2– on cystamine –NH–CH2–), δ 3.63 (–CH2– on cystamine-S–CH2–) ppm which belongs to the cystamine dihydrochloride confirmed the formation of HA–SA–CYS–CHOL conjugates. Similarly, in the spectrum of HA–SA–CYS–OA, the presence of the characteristic peak at δ 1.11 (–CH2–), δ 1.24 ((β)CO–CH2–CH2–) ppm was assigned to the long chain of the stearate fragment, δ 2.71 (–CH– on succinyl –CO–CH2–), δ 2.77 (–CH– on succinyl –CO–CH2–) ppm which belongs to the succinyl segment and δ 2.89 (–CH2– on cystamine –NH–CH2–), δ 3.09 (–CH2– on cystamine-S–CH2–) ppm which belongs to the cystamine dihydrochloride confirmed the formation of HA–SA–CYS–OA conjugates. The DS of HA–SA–CYS–CHOL and HA–SA–CYS–OA was 22.5%, and 18% respectively.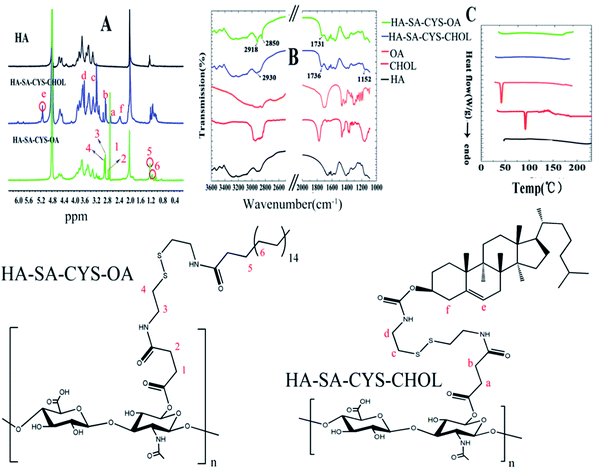 | ||
| Fig. 1 Images of the 1H NMR (A) of HA, HA–SA–CYS–CHOL and HA–SA–CYS–OA, FITR (B), and DSC (C) of HA, CHOL, OA, HA–SA–CYS–CHOL and HA–SA–CYS–OA. | ||
FTIR spectra further supported the formation of HA–SA–CYS–CHOL (OA). As shown Fig. 1B, in the spectra of HA–SA–CYS–OA, a new band at 1731 cm−1 was assigned to the carbonyl stretching vibration and the peak at 2918 cm−1, 2850 cm−1 were due to the symmetrical and asymmetrical stretching vibration of the –CH2– group. After hydrophobic groups conjugated to the HA, the band at 1152 cm−1, 1736 cm−1 and 2930 cm−1, appeared in the spectra of HA–SA–CYS–CHOL, were attributed to the –C![[double bond, length as m-dash]](https://www.rsc.org/images/entities/char_e001.gif) C–H, the carbonyl and the –CH2– asymmetrical stretching vibration.
C–H, the carbonyl and the –CH2– asymmetrical stretching vibration.
DSC was used to measure the physical or chemical changes of copolymer with the change of temperature.30 As shown in Fig. 1C, neither endothermic peak nor exothermic peak could be detected for HA, indicating that HA could maintain the stability of the structure in the experimental temperature. CHOL and OA respectively showed a sharpened endothermic peak at about 120 °C and 58 °C, illustrating that the two substances are melted at that temperature. When we used chemical methods to link CHOL or OA to HA, we found that the corresponding HA–SA–CYS–CHOL (OA) polymer had no endothermic and exothermic peaks at the experimental temperature, which indicating that the amphiphilic obtained from chemical linking has a good thermal stability in the experimental temperature.
A typical GPC chromatogram is shown in Fig. S5.† As can be seen in Table 1, the Mn of the HA–SA–CYS–CHOL copolymer was 30![[thin space (1/6-em)]](https://www.rsc.org/images/entities/char_2009.gif) 086 g mol−1, the Mw/Mn was 1.70, indicating HA–SA–CYS–CHOL have broad PDIs. The Mn of the HA–SA–CYS–OA copolymer was 23
086 g mol−1, the Mw/Mn was 1.70, indicating HA–SA–CYS–CHOL have broad PDIs. The Mn of the HA–SA–CYS–OA copolymer was 23![[thin space (1/6-em)]](https://www.rsc.org/images/entities/char_2009.gif) 024 g mol−1, the Mw/Mn was 1.07, indicating a successful living polymerisation.42,43
024 g mol−1, the Mw/Mn was 1.07, indicating a successful living polymerisation.42,43
| Sample | DSa (%) | Mnb (g mol−1) | Mw/Mn | CMC (mg mL−1) | Size (nm) | PDI | Zeta potential (mV) | EE (%) | DL (%) |
|---|---|---|---|---|---|---|---|---|---|
| a DS of HA–SA–CYS–CHOL and HA–SA–CYS–OA copolymers determined by 1NMR.b Molecular weight of HA–SA–CYS–CHOL and HA–SA–CYS–OA copolymers determined by GPC. | |||||||||
| HA–SA–CYS–CHOL | 22.5 | 30![[thin space (1/6-em)]](https://www.rsc.org/images/entities/char_2009.gif) 086 086 |
1.70 | 0.0079 | 172 ± 10.2 | 0.12 ± 0.004 | −32.3 ± 0.57 | 89.67 ± 2.87 | 4.81 ± 0.38 |
| HA–SA–CYS–OA | 18 | 23![[thin space (1/6-em)]](https://www.rsc.org/images/entities/char_2009.gif) 024 024 |
1.07 | 0.0178 | 289 ± 6.4 | 0.15 ± 0.047 | −32.8 ± 0.86 | 75.1 ± 3.83 | 3.56 ± 0.35 |
Measurement of critical micellar concentration (CMC)
The CMC can affect the ability of self-assembly of the amphiphilic copolymer and the structural stability of micelles in vitro and in vivo.44 The CMC values of HA–SA–CYS–CHOL and HA–SA–CYS–OA copolymers were 0.0079 mg mL−1, and 0.0178 mg mL−1, respectively. This low CMC value revealed that the micelles structure can be stable even under extreme dilution, which means that the micelles can be stability in the bloodstream after intravenous administration. Moreover, the HA–SA–CYS–CHOL copolymer had a lower CMC than the HA–SA–CYS–OA copolymer. This may be because cholesterol is more hydrophobic than octadecanoic acid. The greater hydrophobicity drew the formed micelles more compact, and the stronger hydrophobic forces resulted in a lower CMC. Also, more cholesterol was linked to the HA and the CMC of the copolymers reduced as the DS increased. Different hydrophobic groups led to the different DS and CMC values after reacting with HA in the same molar ratio. Although the difference in DS between the two copolymers was not great (P > 0.01), the difference in CMC values was highly significant (P < 0.001). This proved our hypothesis that the hydrophobic groups affected the nature of the amphiphilic copolymers due to the nature of the hydrophobic groups in itself, such as hydrophobic force and hydrogen bond. Therefore, we further assumed that the hydrophobic groups will affect the properties of the micelles in vitro and in vivo.Preparation and characterization of DTX-loaded micelles
For polymeric micelles, the particle size has an important role in the in vivo performance and pharmacokinetics. It has been known that tumour blood vessels are more leaky than normal vessels, and polymeric micelles can leak into the tumour in the range of 200 nm to 1.2 mm.45,46 As shown in Table 1, the effective diameters of HA–SA–CYS–CHOL and HA–SA–CYS–OA micelles were 172 nm, and 289.3 nm, with a polydispersity index (PDI) of 0.123, and 0.148, respectively (Fig. S1–S4†). HA–SA–CYS–CHOL micelle had a smaller particle size than HA–SA–CYS–OA. From CMC experiments, we know that compared with HA–SA–CYS–OA, more cholesterol is linked to the HA and cholesterol is more hydrophobic than octadecanoic acid leading HA–SA–CYS–CHOL amphiphilic copolymer with the lower CMC. The particle size decreased with the decrease in the CMC of HA–SA–CYS–CHOL, probably due to the stronger hydrophobic interaction force between DTX and cholesterol core region lead to stronger binding affinity and more compact micellar core packing.16The particle size indicated that the polymeric micelles could traverse tumour vascellum into the tumour stroma and is uptake by the tumour cells but be blocked by normal vessels because of the quite compact endothelial cells.47 In addition, both types of micelles had a relatively high negative zeta potentials of around −33 mV owing to the presence of the ionized carboxyl groups on the HA backbone. The high negatively charged micelles promised an excellent stability in vitro and in vivo owing to the mutually repel, preventing aggregation or precipitation of particles.
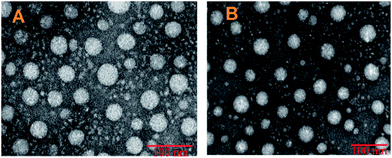
As shown in Fig. 2, TEM was performed to visualize directly the size and morphology of DTX-loaded micelles. The spherical shape of the two micelles strongly confirmed a core–shell structure with a mean diameter of 50–100 nm in dehydrated conditions. The size measured by TEM in ultrahigh vacuum conditions was much lower than that measured by DLS in aqueous solution (172, 289.3 nm) which may be due to shrinking of the hydrophilic HA side chain and dehydration of the polymeric main chain during the drying process involved in the preparation of TEM samples.30 And DLS analyses the hydrodynamic radius of the dispersed micelles whereas TEM provides the projected surface area based on how much of the incident electrons were transmitted through the sample. So the size measured by TEM is usually smaller than DLS.48
The EE and DL values of DTX in HA–SA–CYS–CHOL and HA–SA–CYS–OA micelles are summarized in Table 1. When DTX was loaded by these two amphiphilic carriers, much more DTX was encapsulated in HA–SA–CYS–CHOL micelles than HA–SA–CYS–OA. The difference between the two amphiphilic carriers was merely the hydrophobic group and HA–SA–CYS–CHOL had a lower CMC than HA–SA–CYS–OA. The DL capacity enhanced with the decrease in the CMC of HA–SA–CYS–CHOL in DTX-loaded micelles.16 These results could be explained by the fact that the lower the CMC in HA–SA–CYS–CHOL, the stronger hydrophobic interaction force between hydrophobic DTX and the hydrophobic micellar core region lead to the stronger binding affinity. Therefore, we speculate that HA–SA–CYS–CHOL has a strong ability to solubilize hydrophobic drugs and the dominant interaction force between the hydrophobic group and the drug is the hydrophobic interaction force. However, when Cou6 was loaded, the HA–SA–CYS–OA packaged more than twice as much Cou6 as HA–SA–CYS–CHOL in the same amount of the carriers (37.5% ± 3.23 vs. 7.5% ± 1.35), which was the opposite of DTX. Although the hydrophobicity of cholesterol is strong, but the drug encapsulated ability is weaker. Therefore, we speculate that, from the amphiphilic carriers point of view, except the hydrophobic forces, there are other interaction force between the drugs and hydrophobic groups leading to different drug encapsulation abilities, e.g., the spatial 3D configuration of the drug and the hydrophobic groups, the hydrogen bond and so on. It also proved that the amphiphilic copolymer is selective for hydrophobic drugs due to the properties of the hydrophobic groups.
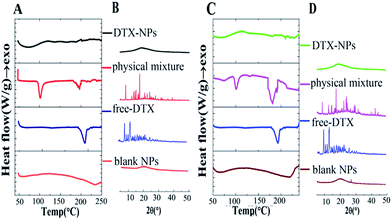
As shown in Fig. 3A and C, free DTX exhibited a single sharp endothermic peak at 223.7 °C, which was melting points of DTX. The blank micelles of HA–SA–CYS–CHOL and HA–SA–CYS–OA showed no endothermic peak. However, the physical mixture of blank HA–SA–CYS–CHOL micelles and DTX showed a weaker endothermic melting peak at 222.30 °C and the physical mixture of blank HA–SA–CYS–OA micelles and DTX showed an endothermic melting peak at 223.51 °C.
Nevertheless, the DSC curves of DTX–HA–SA–CYS–CHOL micelles and DTX–HA–SA–CYS–OA micelles demonstrated no melting peaks of DTX, suggesting the drug was entrapped into the micelles in amorphous state. As depicted in Fig. 3B and D, free DTX showed four intense peaks at 2θ of 8.99°, 10.14°, 11.25°, 13.94° and numerous small peaks between 14.57° and 24.28°. These characteristic XRD peaks of DTX exist in the of physical mixture of blank HA–SA–CYS–CHOL micelles and DTX, blank HA–SA–CYS–OA micelles and DTX, but do not in those of DTX–HA–SA–CYS–CHOL micelles and DTX–HA–SA–CYS–OA micelles, suggesting that DTX was either molecularly dispersed in the polymers or distributed in the micelles in an amorphous state.30,49
In vitro drug release assay
Nano-delivery systems are able to control the release of the drug, which greatly reduces the toxicity of the drugs on healthy body tissues.50 As shown in Fig. 4, Taxotere® exhibited a 105.09% release of DTX after 24 h, whereas only 56.88% of DTX was released from HA–SA–CYS–CHOL micelles, and 63.32% of DTX from HA–SA–CYS–OA micelles, showing micelles could markedly reduce the drug release in the circulatory system. In addition, compared with HA–SA–CYS–CHOL micelles, much more DTX was released from HA–SA–CYS–OA micelles. The difference between the two amphiphilic carriers was merely the hydrophobic group. The stronger the hydrophobicity of the hydrophobic group, the more strongly the interaction between the hydrophobic group and the drug. Cholesterol has a stronger interaction with DTX with its more hydrophobicity, and DTX can be more stable package in the HA–SA–CYS–CHOL micelles producing a lower drug release. Therefore, we concluded that the hydrophobic groups affected the release of micelles and we also hypothesize that hydrophobic groups will have an influence on the in vivo properties of the micelles.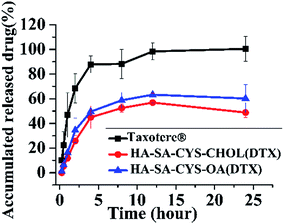 | ||
| Fig. 4 In vitro release profile of Taxotere®, HA–SA–CYS–CHOL (DTX) and HA–SA–CYS–OA (DTX) micelles in PBS pH 7.4 at 37 °C. Each data point represents mean ± SD (n = 3). | ||
In vitro cytotoxicity
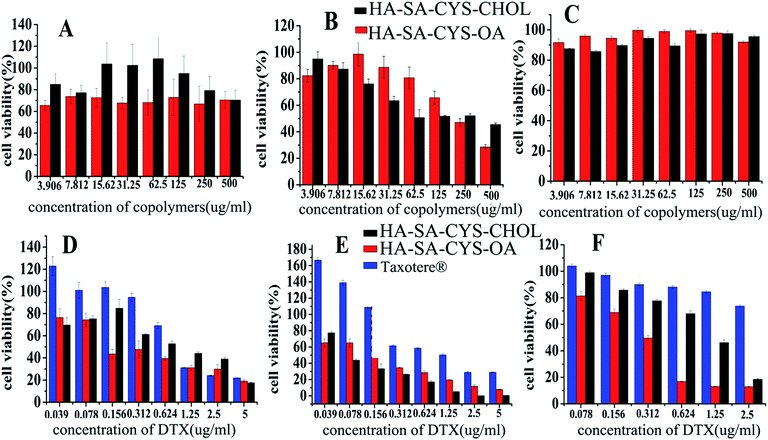
As shown in Fig. 5A–C, blank micelles were slightly toxic to A549 and MCF-7 cells but had little cytotoxicity to S-180 cells. The cytotoxicity of blank micelles may be due to the higher molecular weight fractions of HA showed to inhibit cell cycle progression via a CD44/Rac/ERK pathway51 and it was an advantage of using HA–SA–CYA–OA (CHOL) as a drug carrier showed some cytotoxicity.52 As shown in Fig. 5D–F and Table 2, DTX-loaded HA–SA–CYS–CHOL and HA–SA–CYS–OA micelles exhibited much higher cytotoxicity than Taxotere®. It was reported previously that MCF-7, A549 and S-180 cells were CD44 receptor over-expressing cell lines.53–55 Compared with the passive diffusion of free DTX, the higher cytotoxicity of HA–SA–CYS–CHOL (OA) micelles might be attributed to the higher binding affinity of HA derivatives for CD44 receptors. In addition, HA–SA–CYS–OA micelle was significantly greater toxicity to tumour cells than that of HA–SA–CYS–CHOL in all cell lines. Theoretically, the smaller particle size of micelles could increase the cellular uptake and deliver more DTX into cells, resulting in greater cytotoxicity. However, in our study, HA–SA–CYS–OA micelles had a greater cytotoxicity with larger particle size. This may be because the hydrophobic group of the two micelles had a greater impact on the cytotoxicity than the particle size. It was reported previously that octadecanoic acid produced an inhibition of WRL, MCF-7, COLO cell lines56 and ECV304 human endothelial cells.51,57| Cell line | Taxotere® (ng mL−1) | HA–SA–CYS–CHOL (ng mL−1) | HA–SACYS–OA (ng mL−1) |
|---|---|---|---|
| A549 | 1191.0 ± 76.825 | 175 ± 51.84 | 118 ± 3.72 |
| MCF-7 | 607.4 ± 42.8 | 43 ± 3.11 | 10.8 ± 1.26 |
| S-180 | 14![[thin space (1/6-em)]](https://www.rsc.org/images/entities/char_2009.gif) 613.9 ± 556.8 613.9 ± 556.8 |
1865.8 ± 92.56 | 254.3 ± 31.63 |
Based on the above, we hypothesized that, compared with cholesterol; octadecanoic acid with a greater toxicity was more cytotoxic to A549, MCF-7 and S-180 cells, which is worth our further study on the mechanism of hydrophobic groups on the in vitro cytotoxicity.
In order to better and clear study the role of hydrophobic groups on antitumor effects, we selected S-180 cells for in vivo experiments because blank micelles were substantially non-cytotoxic to the S-180 cell.
In vitro cellular uptake
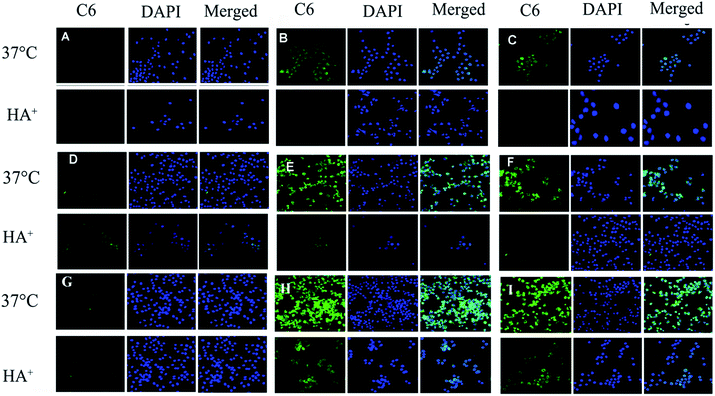
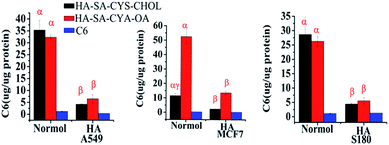
As shown in CLSM (Fig. 6), it was clear that the intracellular fluorescence intensity of HA–SA–CYS–CHLO (OA) NPs in A549, MCF-7 and S-180 cells was significantly higher than that of free Cou6, which might be due to the endocytosis mediated by CD44 receptors. In A549 and S-180 cells, the amount of cellular uptake of Cou6 in HA–SA–CYS–CHOL and HA–SA–CYS–OA micelles was 28.94-, 26.48- and 25.56-, 23.42-fold higher than that of free Cou6, respectively. However, the intracellular uptake of HA–SA–CYS–OA micelles was significantly increased in MCF-7 cells, which was 4.53-fold greater than that of HA–SA–CYS–CHOL micelles.As seen in Fig. 7, pre-treating the CD44+ cancer cells (MCF-7, A549 and S-180 cells) with free HA significantly reduced the internalization of HA–SA–CYS–CHOL (OA) NPs. Only a weak fluorescence signal was observed, indicating that the free HA competitively bound to CD44 and inhibited the uptake of HA–SA–CYS–CHOL (OA) micelles. Combining the results of CLSM and quantitative analysis, we can conclude that the cellular uptakes of micelles are due to CD44 receptor-mediated endocytosis. And CD44-mediated endocytosis can effectively increase the uptake of NPs by tumour cells, which increasing the anti-tumour effect of the NPs.
In vivo bio-distribution and tumour targeting
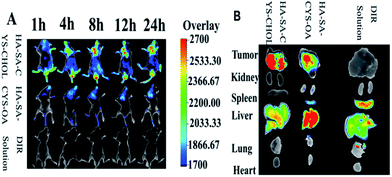
As shown in Fig. 8A, in the experiments, most of the fluorescence was detected in the liver and spleen of DiR solution, indicating the DiR solution was rapid metabolized and excreted by hepatobiliary. Compared with DiR solution, HA–SA–CYS–CHOL (OA) micelles exhibited a much stronger fluorescence signal in the tumour, which could be due to the HA located on the micelle surface increased the tumour uptake of micelles through CD44 receptor and the EPR effect.58 A significant fluorescence signal could be detected as early as 1 h after injection and peaked at 24 h of both micelles. In the all times, the HA–SA–CYS–CHOL micelles showed much more stronger and lasting accumulation in cancer cells compared with HA–SA–CYS–OA micelles. As shown in Fig. 8B, the excised tumours' fluorescent image further confirmed the results observed in vivo. The HA–SA–CYS–CHOL micelles displayed higher fluorescence signal in cancer cells than the HA–SA–CYS–OA micelles and free DiR. Compared with HA–SA–CYS–CHOL micelles, much more micelles accumulated in the liver, kidney and spleen for the HA–SA–CYS–OA micelles, especially in liver, which indicating the rapid metabolism and excretion of HA–SA–CYS–OA micelles in vivo. However, for the HA–SA–CYS–CHOL micelles, most of the micelles were distributed in the tumour tissue, and only a small proportion of the micelles were metabolized. The difference between the two amphiphilic carriers was merely the hydrophobic group. Compared with octadecanoic acid, hyaluronic acid and cholesterol are the necessary components of cytoplasmic matrix and cell membrane. After intravenous injection, endogenous substances prepared micelles can reduce the identification of immune system and reticuloendothelial system, minimized the metabolism and excretion of micelles, improved in the prolonged-circulation and tumour-targeting ability. For the fast-growing cancer cells, the micelles were like sugar-coated shells, tumour cells can uptake the micelles through CD44-mediated receptor endocytosis for the proliferation. However, octadecanoic acid, as an exogenous material, will be identified, metabolized and excreted out of the body even though the hydrophobic group was in the core of the micelles. Therefore, we concluded that the hydrophobic groups affected the distribution, metabolism, and excretion of micelles.In vivo antitumor efficacy
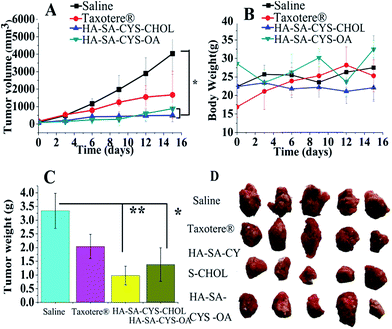
The in vivo antitumor efficacy verified the in vivo bio-distribution and tumour targeting study. Significant decrease in tumour volume was detected in HA–SA–CYS–CHOL (OA) micelles compared with the control group after the third administration (Fig. 9A). HA–SA–CYS–CHOL (OA) micelles showed improved tumour suppression in comparison with Taxotere® after the first administration, attributed to EPR effects and CD44 targeted cell uptake. At the end of the test, HA–SA–CYS–CHOL micelles had the lowest average tumour weight and tumour volume (P < 0.05). In vitro cytotoxicity experiments confirmed that hydrophobic groups were no cytotoxic to S-180 cells. From in vivo bio-distribution and tumour targeting study we have known that hydrophobic groups affected the distribution, metabolism, and excretion of micelles. Ultimately, the hydrophobic group will affect the anti-tumour effect of the micelles. So we assumed that the micelles do not change the molecular mechanism and signal pathways of drugs, it just traffics a greater fraction of the administered drug directly to cancer cells. And the anti-tumour signal pathways of micelles is that, DTX inhibits G2/M progression through destabilization of the microtubule network, which is required for spindle formation during mitosis, and increases the degradation of HIF-1 α by DTX induced-JNK2/PHD1 signaling pathway.59,60The TIR of the HA–SA–CYS–CHOL and HA–SA–CYS–OA group, respectively, was 87.72% and 78.02% of the saline group. The isolated tumour average weight and size of the micelles were the smallest among the saline and Taxotere®, further verifying that the DTX-loaded micelles had a superior in vivo therapeutic efficacy. More importantly, in this study, the administered dose was very low (2 mg kg−1)20 but we also achieved a pronounced antitumor effect.
In order to study the safety of the preparations, we monitored the body weight changes of mice for 15 days (Fig. 9B) and the net body weight variations on the sixteenth day were evaluated (Fig. 9C). Animals in the micelle groups, saline or Taxotere® groups did not show any weight loss during the entire study which reflected the reduced systemic toxicity of the given formulation.
Conclusion
In this study, we successfully synthesized two kinds of amphiphilic copolymers with the same hydrophilic group to explore whether the different hydrophobic groups have an impact on the nature of the amphiphilic carriers and the micelles. From the experiments, we found that the different properties of hydrophobic groups of the amphiphilic carrier can affect the stability and drug-loading capacity of the amphiphilic carrier and the micelles. Compared with HA–SA–CYS–OA, HA–SA–CYS–CHOL had a lower CMC contributing to the micelles having a smaller particle size and much higher encapsulation efficiency (EE) and drug loading (DL). However, HA–SA–CYS–OA had a greater EE when loaded withCou6, suggesting that the amphiphilic carrier had certain selectivity for hydrophobic drugs due to the effect of the different hydrophobic groups. Compared with HA–SA–CYS–CHOL, HA–SA–CYS–OA micelles displayed markedly higher cytotoxicity to MCF-7, A549 and S-180 cells which may be due to the high toxicity of octadecanoic acid. The in vivo animal experiments confirmed that hydrophobic groups affected the distribution, metabolism, excretion and anti-tumour efficacy of micelles. HA–SA–CYS–CHOL micelles possessed excellent tumour-targeting properties and efficient antitumor effects at very low concentrations with extremely low systemic toxicity. Therefore, we strongly recommend that when we examine amphiphilic polymer for drug delivery systems we carefully consider the interactions between hydrophobic groups and the drug loading and select the most appropriate hydrophobic groups to encapsulate the drugs. And we suggested that amphiphilic carrier should be synthesized from endogenous materials, if possible, because not only could it reduce cytotoxicity but also increase the antitumor effects. In the next experiment, we will further quantitatively study the effect of hydrophobic groups on the carriers and micelles.Acknowledgements
This research has been under the support of the National Natural Science Foundation of China (No. 81273447).References
- S. Jaracz, J. Chen, L. V. Kuznetsova and I. Ojima, Bioorg. Med. Chem., 2005, 13, 5043–5054 CrossRef CAS PubMed.
- A. H. Kazunori Kataoka and Y. Nagasaki, Adv. Drug Delivery Rev., 2001, 2001, 113–131 CrossRef.
- M. Z. Elsabee, R. E. Morsi and A. M. Al-Sabagh, Colloids Surf., B, 2009, 74, 1–16 CrossRef CAS PubMed.
- V. Wintgens and C. Amiel, Macromol. Chem. Phys., 2008, 209, 1553–1563 CrossRef CAS.
- Y. Y. Xiaofei Yuan, A. Harada and K. Kataoka, Langmuir, 2005, 2005, 2668–2674 CrossRef PubMed.
- S. Y. Kuwahara, K. Yamamoto and J. I. Kadokawa, Chem. Lett., 2010, 39, 1045–1047 CrossRef CAS.
- A. Pinazo, V. Petrizelli, M. Bustelo, R. Pons, M. P. Vinardell, M. Mitjans, A. Manresa and L. Perez, Colloids Surf., B, 2016, 141, 19–27 CrossRef CAS PubMed.
- Y. Cheng, C. He, C. Xiao, J. Ding, X. Zhuang, Y. Huang and X. Chen, Biomacromolecules, 2012, 13, 2053–2059 CrossRef CAS PubMed.
- L. Prochazka, R. Tesarik and J. Turanek, Cell. Signalling, 2014, 26, 2234–2239 CrossRef CAS PubMed.
- Y. Yan, X. Zuo and D. Wei, Stem Cells Transl. Med., 2015, 4, 1033–1043 CrossRef CAS PubMed.
- V. Orian-Rousseau, Eur. J. Cancer, 2010, 46, 1271–1277 CrossRef CAS PubMed.
- M. P. Carvalho, E. C. Costa, S. P. Miguel and I. J. Correia, Carbohydr. Polym., 2016, 150, 139–148 CrossRef CAS PubMed.
- G. Tripodo, A. Trapani, M. L. Torre, G. Giammona, G. Trapani and D. Mandracchia, Eur. J. Pharm. Biopharm., 2015, 97, 400–416 CrossRef CAS PubMed.
- L. Mayol, M. Biondi, L. Russo, B. M. Malle, K. Schwach-Abdellaoui and A. Borzacchiello, Carbohydr. Polym., 2014, 102, 110–116 CrossRef CAS PubMed.
- J. Li, T. Yin, L. Wang, L. Yin, J. Zhou and M. Huo, Int. J. Pharm., 2015, 483, 38–48 CrossRef CAS PubMed.
- Y. Liu, J. Sun, W. Cao, J. Yang, H. Lian, X. Li, Y. Sun, Y. Wang, S. Wang and Z. He, Int. J. Pharm., 2011, 421, 160–169 CrossRef CAS PubMed.
- A. Ritwiset, S. Krongsuk and J. R. Johns, Appl. Surf. Sci., 2016, 380, 23–31 CrossRef CAS.
- J. R. Madan, N. P. Ghuge and K. Dua, Drug Delivery Transl. Res., 2016, 6, 511–518 CrossRef CAS PubMed.
- X. Wei, T. H. Senanayake, G. Warren and S. V. Vinogradov, Bioconjugate Chem., 2013, 24, 658–668 CrossRef CAS PubMed.
- H. Liu, K. Li, L. Lan, J. Ma, Y. Zeng, L. Xu and D. Wu, J. Mater. Chem. B, 2014, 2, 5238–5248 RSC.
- H. Liu, K. Li, L. Xu and D. Wu, J. Nanopart. Res., 2014, 16, 2784 CrossRef.
- L. H. Wang, S. G. Ding, J. J. Yan and Y. Z. You, J. Phys. Chem. B, 2014, 118, 3893–3898 CrossRef CAS PubMed.
- X. Wang, J. T. Chen, H. Zhu, X. Chen and X. P. Yan, Anal. Chem., 2013, 85, 10225–10231 CrossRef CAS PubMed.
- Z. A. Hamid, A. Blencowe, B. Ozcelik, J. A. Palmer, G. W. Stevens, K. M. Abberton, W. A. Morrison, A. J. Penington and G. G. Qiao, Biomaterials, 2010, 31, 6454–6467 CrossRef CAS PubMed.
- M. Kong, H. Park, C. Feng, L. Hou, X. Cheng and X. Chen, Carbohydr. Polym., 2013, 94, 634–641 CrossRef CAS PubMed.
- J. Yang, Y. Huang, C. Gao, M. Liu and X. Zhang, Colloids Surf., B, 2014, 115, 368–376 CrossRef CAS PubMed.
- J. Li, M. Huo, J. Wang, J. Zhou, J. M. Mohammad, Y. Zhang, Q. Zhu, A. Y. Waddad and Q. Zhang, Biomaterials, 2012, 33, 2310–2320 CrossRef CAS PubMed.
- T. Yin, L. Wang, L. Yin, J. Zhou and M. Huo, Biomaterials, 2015, 61, 10–25 CrossRef CAS PubMed.
- J. Li, D. Liu, G. Tan, Z. Zhao, X. Yang and W. Pan, Carbohydr. Polym., 2016, 146, 435–444 CrossRef CAS PubMed.
- X. Zhang, F. Du, J. Huang, W. Lu, S. Liu and J. Yu, Colloids Surf., B, 2012, 100, 155–162 CrossRef CAS PubMed.
- R. Ran, Y. Liu, H. Gao, Q. Kuang, Q. Zhang, J. Tang, H. Fu, Z. Zhang and Q. He, J. Pharm. Sci., 2015, 104, 476–484 CrossRef CAS PubMed.
- S. Song, H. Qi, J. Xu, P. Guo, F. Chen, F. Li, X. Yang, N. Sheng, Y. Wu and W. Pan, Pharm. Res., 2014, 31, 2988–3005 CrossRef CAS PubMed.
- H. K. Park, S. J. Lee, J. S. Oh, S. G. Lee, Y. I. Jeong and H. C. Lee, Nanoscale Res. Lett., 2015, 10, 981 Search PubMed.
- A. Martinez, E. Muniz, C. Teijon, I. Iglesias, J. M. Teijon and M. D. Blanco, Pharm. Res., 2014, 31, 1264–1274 CrossRef CAS PubMed.
- S. K. Pandey, D. K. Patel, A. K. Maurya, R. Thakur, D. P. Mishra, M. Vinayak, C. Haldar and P. Maiti, Int. J. Biol. Macromol., 2016, 89, 99–110 CrossRef CAS PubMed.
- L. Qiu, Z. Li, M. Qiao, M. Long, M. Wang, X. Zhang, C. Tian and D. Chen, Acta Biomater., 2014, 10, 2024–2035 CrossRef CAS PubMed.
- S. Yin, J. Huai, X. Chen, Y. Yang, X. Zhang, Y. Gan, G. Wang, X. Gu and J. Li, Acta Biomater., 2015, 26, 274–285 CrossRef CAS PubMed.
- E. Giovannetti, V. Mey, S. Nannizzi, G. Pasqualetti, L. Marini, M. Del Tacca and R. Danesi, Mol. Pharmacol., 2005, 68, 110–118 CAS.
- J. R. Tonra, D. S. Deevi, E. Corcoran, H. Li, S. Wang, F. E. Carrick and D. J. Hicklin, Clin. Cancer Res., 2006, 12, 2197–2207 CrossRef CAS PubMed.
- T. C. Chou, Pharmacol. Rev., 2006, 58, 621–681 CrossRef CAS PubMed.
- F. Q. Hu, X. L. Wu, Y. Z. Du, J. You and H. Yuan, Eur. J. Pharm. Biopharm., 2008, 69, 117–125 CrossRef CAS PubMed.
- M. A. Ward and T. K. Georgiou, Polym. Chem., 2013, 4, 1893 RSC.
- D. Xin, Y. Wang and J. Xiang, Pharm. Res., 2009, 27, 380–389 CrossRef PubMed.
- A. K. Yadav, A. Agarwal, G. Rai, P. Mishra, S. Jain, A. K. Mishra, H. Agrawal and G. P. Agrawal, Drug Delivery, 2010, 17, 561–572 CrossRef CAS PubMed.
- J. M. Brown, Cancer Biol. Ther., 2014, 1, 453–458 CrossRef.
- D. Hanahan and R. A. Weinberg, Cell, 2011, 144, 646–674 CrossRef CAS PubMed.
- A. G. Cuenca, H. Jiang, S. N. Hochwald, M. Delano, W. G. Cance and S. R. Grobmyer, Cancer, 2006, 107, 459–466 CrossRef CAS PubMed.
- S. Bhattacharjee, J. Controlled Release, 2016, 235, 337–351 CrossRef CAS PubMed.
- G. Saravanakumar, K. Y. Choi, H. Y. Yoon, K. Kim, J. H. Park, I. C. Kwon and K. Park, Int. J. Pharm., 2010, 394, 154–161 CrossRef CAS PubMed.
- Q.-M. L. Dong Ma, Li-M. Zhang, Y.-Y. Liang and W. Xue, Biomaterials, 2014, 2014, 4357–4367 Search PubMed.
- B. Atasever-Arslan, K. Yilancioglu, M. G. Bekaroglu, E. Taskin, E. Altinoz and S. Cetiner, Gen. Physiol. Biophys., 2015, 34, 201–207 CrossRef PubMed.
- G. R. Tan, S. S. Feng and D. T. Leong, Biomaterials, 2014, 35, 3044–3051 CrossRef CAS PubMed.
- X. C. Bin Du, F. Zhao, X. Su, Y. Wang, X. Yan, S. Jia, J. Zhou and H. Yao, J. Mater. Chem. B, 2016, 2016, 2038–2050 Search PubMed.
- N. Basakran, Saudi Med. J., 2015, 36, 273–279 CrossRef PubMed.
- R. Thapa and G. D. Wilson, Stem Cells Int., 2016, 2016, 2087204 Search PubMed.
- O. O. Aiyelaagbe, A. S. Negi, A. A. Hamid, S. Luqman, S. B. Kumar and F. Kaneez, J. Chin. Chem. Soc., 2015, 62, 751–755 CrossRef CAS.
- J. Ji, L. Zhang, P. Wang, Y. M. Mu, X. Y. Zhu, Y. Y. Wu, H. Yu, B. Zhang, S. M. Chen and X. Z. Sun, Exp. Toxicol. Pathol., 2005, 56, 369–376 CrossRef CAS PubMed.
- Y. Nakamura, A. Mochida, P. L. Choyke and H. Kobayashi, Bioconjugate Chem., 2016, 27, 2225–2238 CrossRef CAS PubMed.
- P. J. M. A. F. A. Fitzpatrick, Proc. Natl. Acad. Sci. U. S. A., 1998, 95, 3896–3901 CrossRef.
- E. T. Oh, C. W. Kim, S. J. Kim, J. S. Lee, S. S. Hong and H. J. Park, Sci. Rep., 2016, 6, 27382 CrossRef CAS PubMed.
Footnote |
| † Electronic supplementary information (ESI) available. See DOI: 10.1039/c7ra03211k |
| This journal is © The Royal Society of Chemistry 2017 |

