 Open Access Article
Creative Commons Attribution 3.0 Unported Licence
Effect of cyclohexane diamine tetraacetic acid on micro morphology of rapidly grown potassium dihydrogen phosphate crystals
Weidong Li ab,
Shenglai Wang*ab,
Guangwei Yua,
Duanliang Wangab,
Pingping Huangab,
Hui Liuab,
Bo Yuab,
Yanchun Wangab and
Qingtian Guab
aState Key Laboratory of Crystal Materials, Shandong University, Jinan 250100, P. R. China. E-mail: slwang67@sdu.edu.cn; Tel: +86 156626550891
bKey Laboratory of Functional Crystal Materials and Device, Shandong University, Ministry of Education, Jinan 250100, P. R. China
First published on 26th April 2017
Abstract
Potassium dihydrogen phosphate (KDP) crystals were grown from aqueous solutions with different concentrations of cyclohexane diamine tetraacetic acid (CDTA) by the “point seed” rapid growth technique. The effects of CDTA on the surface micro morphology of KDP crystals were systematically studied by atomic force microscopy. The prismatic face growth rates of KDP crystals grown from various solutions were measured by a laser polarization interference system. The results shown that the steps became smooth after CDTA doping. When the doping concentration of CDTA is 100 ppm, the bunching of steps on the (100) face reduced dramatically and the step velocity increased obviously due to the complexation between CDTA and the metal impurities in the original solution. When the doping concentration of CDTA is 500 ppm, the excess CDTA adsorbed on the growth surface and impeded the step movement, leading to an increase in step bunching and reduction in step velocity compared with the situation of 100 ppm.
1 Introduction
Crystals of potassium dihydrogen phosphate (KDP) are widely applied in laser frequency conversion, electro-optic modulation, parametric oscillation, and other fields due to their excellent electro-optical and nonlinear optical properties.1 In order to obtain high quality crystals, the adjustment effect of organic additives on the crystal growth habit and optical properties has been studied in recent years.2–8 Cyclohexane diamine tetraacetic acid (CDTA) as a typical chelating reagent9,10 has been used to enhance the solution stability, increase the UV transmittance and the laser damage threshold of KDP crystals.11It is an interesting topic to understand the process and mechanism of crystal growth with additive. S. J. Zhu et al.12 grew KDP crystals from solutions with different organic additives, including NTA, HEDTA, EDTA and CDTA. All the organic additives could enhance the solution stability, increase the UV transmittance and improve the laser damage threshold. S. Chandran et al.13 found that the amaranth dye doped samples acquired a more mechanical hardness as compared with pure KDP crystals. M. Anis et al.14 studied the influence of formic acid (FA) on nonlinear optical properties of KDP crystals, the SHG efficiency of KDP was found to be enhanced with addition of FA and was 1.13 times greater than KDP for 1 mol% of FA. With the development of AFM technology, researchers can explore the details information of KDP crystals in atomic scale, especially the influence of impurities on the step evolution in the process of crystal growth, include the trivalent and divalent metal cations,15,16 anionic coordination polygon,17 organic impurity,18 etc. S. F. Yang et al.19 investigated the surface topographies of KDP crystals grown under different conditions ex situ by AFM. They inferred that EDTA mainly affected the impurity cations which played a key role in the morphology of the step. Y. Asakuma20 described the surface topography using AFM. Fractal dimensions of the surface pattern were measured, including step height and terrace distance of KDP crystals with different dye concentrations. Y. F. Qiu et al.21 measured the width of metastable zone and induction period of pure and L-alanine added KDP solution, the growth rate of (100) face decreased with the rise of additive concentration. The aim of this paper is to make an intensive study of the effect of CDTA on the surface step micro morphology. We explore ex situ AFM images on (100) face of the crystals grown under different supersaturation and additive concentration. The step bunching, average terrace width and step velocity are obtained under different concentration of CDTA additives.
2 Experimental
2.1 Crystal growth
The KDP crystals were grown by “point seed” rapid growth technique.22 The aqueous solutions were prepared using high purity KH2PO4 (Merck Co., Germany, the amount of Fe3+, Cr3+ and Al3+ was less than 1 ppm) and de-ionized water according to the solubility curve23 in a standard 1000 ml glass crystallizer. The saturation temperature of solutions were controlled around 55 °C. According to our previous research,11 the concentrations of AR grade CDTA were 100 ppm and 500 ppm (ppm means a millionth of the mole ratio of CDTA and KH2PO4) respectively. The solutions were heated at 80 °C for 24 h after filtered by a 0.22 μm membrane. The crystals grown on a frames with a rotation speed of 77 rpm in a mode of “forward-stop-backward”. These experiments were carried out in a water bath, the temperature was controlled by a Shimada FP21 automatic temperature apparatus with an accuracy of ±0.01 °C. The supersaturation is calculated as:23| σ = (C − C0)/C0 | (1) |
| C0 = 10.68 + 0.3616T ± 0.04 (g KDP per 100 g solution) | (2) |
It should be pointed out that the seed crystals were z-cut with dimensions of 5 mm when we prepared the crystals for AFM test. These crystals were grown at the set supersaturation after recovery under the temperature of 0.5 °C lower than the saturation temperature for several hours. After the crystals grown to the required size, the crystals were removed from the solution, the mother solutions on crystal surface were cleaned quickly for protecting the growth surface, and then the crystals were naturally cooled to room temperature.
2.2 Characterization
FT-Raman spectroscopic measurement was carried out to analyze the vibrational models along (200) planes of the crystals. The laser beam with the wavelength of 785 nm was incident normally on the crystal surface, the spectra were recorded at room temperature in the wave-number range of 100–4100 cm−1, and the estimated resolution was 6 cm−1.The AFM equipment was a commercial Nanoscope IIIa MultiMode and Dimension Icon instruments. The crystal was adjusted to keep the observed surface horizontal before testing. The surface micromorphology on the (100) faces of crystals were studied in ambient atmosphere at room temperature by Contact or ScanAsyst modes. The influence of scanning itself on the original morphology could be ignored.
2.3 Real-time measurement of growth rate
The growth rate for the (100) face of KDP crystals were measured by laser polarization interference system.25 A laser beam with a wavelength of 473 nm was employed. The crystals prepared beforehand which have a good optical quality and no obvious macroscopic defects were put in the solution at the temperature of 1.5 °C above the saturation point. Adjust the crystal to ensure the laser vertically through the (100) face. The solution cooling rate was 3 °C h−1. The growth rate R was calculated in terms of relationship between the laser intensity I and the crystal thickness as follows:25
 | (3) |
| R = λ/2ΔnΔt (for high supersaturation) | (4) |
3 Results
3.1 Crystal growth and FT-Raman analysis
The rapid grown KDP crystals are obtained from solutions added with different concentration of CDTA. The crystals have a good optical transparency and no obvious macro defects by naked eye when the doping concentration of CDTA is 100 ppm. The growth rate along X/Y direction is faster than Z direction. Increasing the concentration of CDTA to 500 ppm, some spontaneous nucleation appeared at the bottom of the crystallizer, parasite crystal occurred on the crystal surface. These crystals are machined to test the FT-Raman patterns.The recorded FT-Raman spectra of KDP crystals added with different concentrations of CDTA have been shown in Fig. 1. The spectra of KDP crystals added with CDTA have the same internal vibrational models of H2PO4− as pure KDP.26,27 It is clear that there is no shift of the main peak for the asymmetric stretching vibration of H2PO4− anions in KDP, it implies that the CDTA do not influence the internal vibration modes. Moreover, the characteristic of vibrations of C–O and O–H groups in CDTA molecule do not appear.
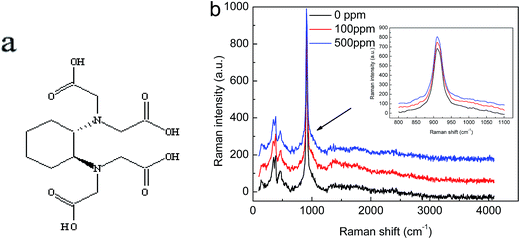 | ||
| Fig. 1 (a) Structural formula of CDTA molecule; (b) FT-Raman spectra of KDP crystals added with various concentrations of CDTA. | ||
3.2 Step micro morphology on (100) face with CDTA
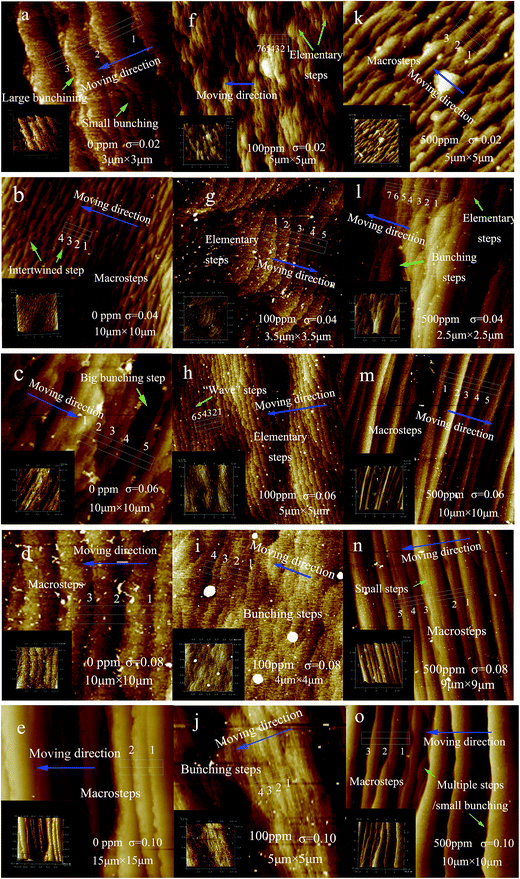
The micro morphology on (100) face of KDP crystals grown from the solution added with various concentration of CDTA at different supersaturation are illustrated in Fig. 2(a)–(o). The insets are the corresponding 3-D graphics. The blue arrows represent the steps motion direction. It can be seen that the micro morphology on crystals surface change with the increase of CDTA concentration and supersaturation.The terraces width increase with the rise of supersaturation in undoped solution. The steps are twisty and crossed at low supersaturation, especially for σ = 0.04. The steps height rise obviously at high supersaturation. When the doping concentration of CDTA is 500 ppm, the terraces width also increase with the rise of supersaturation as the situation of undoped. The steps intertwine with others seriously at σ = 0.02. At high supersaturation, the kink positions reduce observably, the ledges become smooth and straight, meanwhile, the steps height increase. Contrary to the two above-mentioned situations, the terraces width remain unchanged basically when the doping concentration of CDTA is 100 ppm. The steps are very uniform and dense, it is more pronounced for σ = 0.06. The steps height increase slightly at σ = 0.08 and σ = 0.10.
3.3 Step structure on (100) face with CDTA
The areas marked with white dotted box in Fig. 2 are chosen to measure the step height and terrace width, which are illustrated in Fig. 3(a)–(o).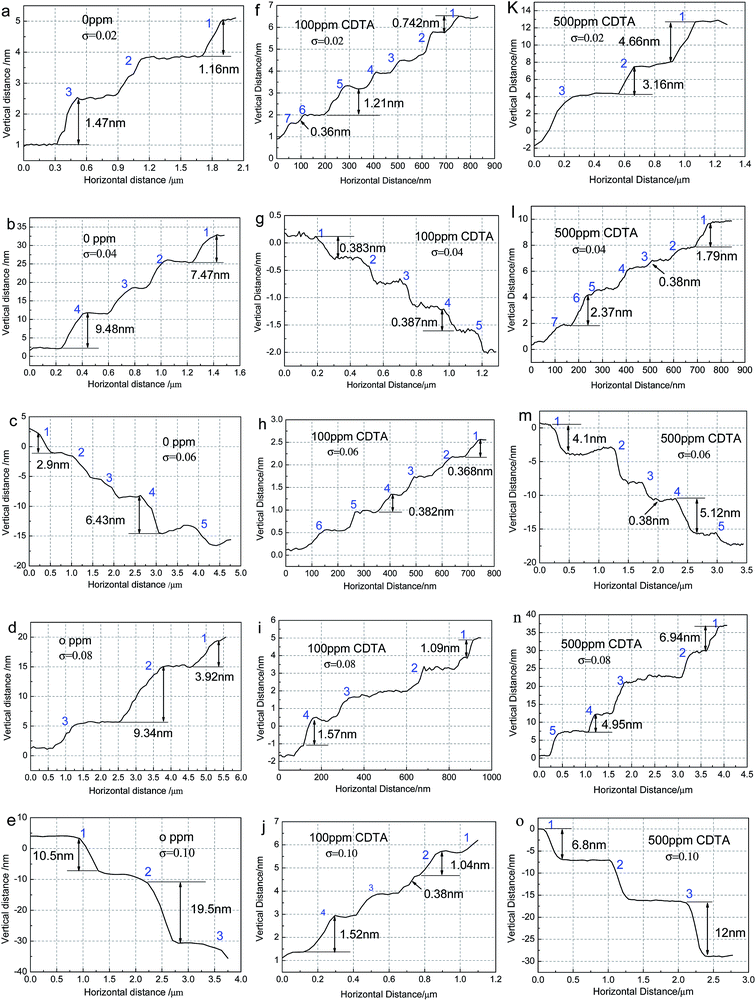 | ||
| Fig. 3 Step height and terrace width measured according to the areas marked with white dotted box in AFM images. | ||
The measurements are in conformity with the phenomena described as the AFM images. For the situation of undoped CDTA, mainly macro steps distribute on the crystal surface, the steps height increase with the rise of supersaturation. When the doping concentration of CDTA is 100 ppm, there are basically elementary steps on the surface at low supersaturation, the small bunching steps appear at σ = 0.08 and σ = 0.10. When the doping concentration of CDTA is 500 ppm, the steps height is high at σ = 0.02, then the height increases with the rise of supersaturation. Both macro steps and elementary steps appear on the terrace, which is more pronounced at σ = 0.04.
The average elementary step numbers contained in macro steps are used to describe the degree of step bunching and shown in Fig. 4(a). The dependence of average terrace width on supersaturation are shown in Fig. 4(b). The insets are the specific situation of doping 100 ppm CDTA.
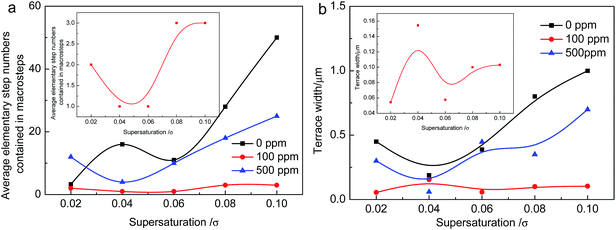 | ||
| Fig. 4 Step bunching and terrace width depend on the supersaturation with different additive concentration. | ||
It can be seen that the bunching numbers increase with the rise of supersaturation generally for undoped KDP crystals, a peak position appears at σ = 0.04 where the steps are twisty seriously. When the doping concentration of CDTA is 500 ppm, the bunching numbers first decrease then heighten with the rise of supersaturation. At σ = 0.02, step bunching is higher than the situation of undoped. At other supersaturation range, steps bunching are all lower than the situation of undoped. When the doping concentration of CDTA is 100 ppm, although the bunching increases at σ = 0.08 and 0.10, the elementary numbers contained in macro steps are only 3. They are still very small. On the whole, the variation of step bunching can be negligible compared with the situation of undoped and 500 ppm CDTA doped KDP crystals. The terraces width both first reduce then increase on the whole supersaturation interval for the situation of undoped and 500 ppm CDTA doped KDP. It basically remains unchanged when the doping concentration of CDTA is 100 ppm.
3.4 Step velocity versus the supersaturation on (100) face
In this experiment, the normal growth rate R versus supersaturation are measured by laser polarization interference system. According to the theory of BCF, there is a geometrical relation between the normal direction growth rate R and the steps tangential speed v:23| R = pv | (5) |
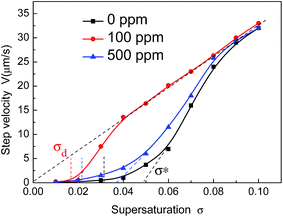 | ||
| Fig. 5 Dependence of step velocity of the (100) face on supersaturation in the presence of different concentration of CDTA. Scatter points are experimental data. Solid lines are the fitting curves. | ||
It can be seen that the addition of CDTA causes an increase of step velocity within the entire supersaturation range, which is more pronounced for 100 ppm CDTA. It is consistent with the research result by S. J. Zhu.11 The step velocity all increase gradually after a “dead zone” σd where no growth occurs. At low supersaturation, the step velocity is slow. Above another high supersaturation zone σ*, the step velocity rises rapidly approaching linearly. In addition, continue to increase the supersaturation to σ′, the dependence v(σ) becomes a straight line passing through the origin.28 The critical supersaturation σ′ reduces when the solutions added with CDTA, which is more dramatic for doping 100 ppm CDTA. Referring to Terry A. Land's experimental methods,15 there are a supersaturation dead zone σd and a linear region σ* in the process of step tangential evolution with the change of the supersaturation. Both the two critical supersaturation, dead zone σd and linear region σ*, are shown in Table 1. The two values both reduce when the solutions are in present of CDTA, which is more obvious for doping 100 ppm CDTA.
| Concentration (ppm) | σd (%) | σ* (%) | σ′ (%) | A (10−6 m s−1) | βl (10−6 m s−1) | βl′29 (10−6 m s−1) |
|---|---|---|---|---|---|---|
| 0 | 3.12 | 4.92 | 9 | 1.23 | 1.85 | 1.39 (30 °C) |
| 100 | 1.67 | 1.82 | 4 | 8.18 | 1.82 | — |
| 500 | 2.05 | 3.69 | 8 | 2.9 | 1.89 | — |
4 Discussion
4.1 Effect of CDTA on kinetic coefficients
Our results show that the normal growth rate of (100) faces increase with the rise of supersaturation. The additive of CDTA causes an increase in growth rate at a given supersaturation. According to the spiral growth model,23 when the supersaturation σ is very small, the face growth rate R can be written as:| R = Aσ2 | (6) |
| R = βlσ | (7) |
From the curve fitting of the parabolic and linear part, we obtain the coefficient A and βl, which are shown in Table 1. It can be seen that the parameter A increases many fold in present of CDTA, which is more obvious for 100 ppm CDTA. The βl value is slightly higher than the result at 30 °C measured by A. V. Belustin.29 The parameter βl has little change when the solution is doped with CDTA. It suggests that the additive of CDTA play a positive role at low supersaturation in the process of crystal growth. At high supersaturation, the CDTA may have little contribution to the step tangential velocity.
4.2 The positive effect of CDTA
Our experimental results indicate that the steps bunching is lowest and the step velocity is fastest when the doping concentration of CDTA is 100 ppm. We think that it may be attributed to the chelation of CDTA with the impurity metal ions in growth solution. Some researches have demonstrated that the metal ions can adsorb on the growth surface and hinder the steps movement, it leads to step bunching.15,16,28 ICP test has confirmed that the additive of CDTA can decrease the metal ions concentration in crystal.19 The additive of CDTA can form coordinate bonds with the metal ions and reduce their chemical activities. Thus, the growth surface is “clean”, the block role of metal impurities will reduce even disappear. The steps evolution can not be impeded and disturbed by metal impurities in the process of growth diffusion. The steps move easily and quickly. It is consistent with the description as AFM images, the steps are dense and uniform, especially for σ = 0.04 and σ = 0.06. At this point, elementary steps spread over the surface. Moreover, the supersaturation of σ = 0.04 is far above linear region σ*, and it enters into the linear region which through the origin. Both the normal growth rate R and tangential speed V increase with the rise of supersaturation. The elementary steps move so fast that the improvement of normal growth rate can be reached. Great step bunching occurred in undoped solution doesn't emerge in this situation. The step spacing is large due to the fast tangential speed.4.3 The negative effect of CDTA
When the doping concentration of CDTA is 500 ppm, our researches show that the steps bunching is larger and the step velocity is lower than the situation of 100 ppm. It may be caused by the excess of CDTA in growth solution. After chelating with metal ions impurities, the redundant hydrolysate of CDTA can be adsorbed onto the crystal surface due to the hydrogen bonding. The force of hydrogen bonding is so weak that CDTA is in the process of adsorption and desorption. These macro molecules are like little “mounds” when they land on the steps terrace. These “mounds” are easily to attract the growth units of K+ and H2PO4− by electrostatics and hydrogen bonding which lead the diffusion of units difficult on the crystal surface. On the other hand, these “mounds” will hamper steps ahead in the process of evolution. The steps are fixed when they encounter the CDTA molecule. The latter elementary steps move forward continuously until they catch up with the motionless steps. Then, these latter elementary steps arrive the top of the front steps and merge into the macro steps. The influences of CDTA lead to the step velocity slow down, the crystal growth is achieved by step bunching, which is more pronounced at lower supersaturation as σ = 0.02. At this point, the steps cross with each other seriously owing to the blocking effect of CDTA as the Fig. 2 shown. Compared with the situation of undoped and doped 100 ppm CDTA in solution, the step bunching is largest as the Fig. 4(a) shown.In addition, as a result of the low step velocity, the accumulation of supersaturation is formed when the excess of CDTA are present in the solution. It will lead the decrease of growth solution stability, so the spontaneous nucleation even the parasite crystal emerge in the process of crystal growth when the concentration of CDTA is 500 ppm.
5 Conclusions
The additive of CDTA play a key role in regulating the micro morphology and step velocity of KDP crystal. The right amount concentration of CDTA can reduce the step bunching on (100) face, the crystal growth is completed by the movement of elementary steps and small bunching steps. The step velocity has improved significantly. However, the excess CDTA have a negative effect on the crystal growth. The step bunching will be higher than the situation of 100 ppm, and the step velocity also slow down. It suggests that it is very important to select the right concentration of CDTA in the process of crystal growth.Acknowledgements
This work was financially supported by National Natural Science Foundation of China (No. 51321062).References
- H. Yoshida, T. Jitsuno, H. Fujita, M. Nakatsuka, M. Yoshimura, T. Sasaki and K. Yoshida, Appl. Phys. B, 2000, 70, 195–201 CrossRef CAS.
- K. Srinivasan, K. Meera and P. Ramasamy, J. Cryst. Growth, 1999, 205, 457–459 CrossRef CAS.
- S. F. Yang, G. B. Su and Z. D. Li, J. Cryst. Growth, 1999, 197, 383–387 CrossRef CAS.
- K. Srinivasan, K. Meera and P. Ramasamy, Cryst. Res. Technol., 2000, 35, 291–297 CrossRef CAS.
- G. H. Li, G. B. Su and X. X. Zhuang, J. Cryst. Growth, 2004, 269, 443–447 CrossRef CAS.
- G. Endert and M. L. Martin, Cryst. Res. Technol., 1981, 16, K65–K66 CAS.
- N. P. Rajesh, V. Kannan and P. S. Raghavan, Mater. Lett., 2002, 52, 326–328 CrossRef CAS.
- G. W. Liu, C. X. Li and W. C. Wang, Mater. Sci. Eng., B, 2005, 116, 47–53 CrossRef.
- A. Ringbom, Complexation in Analytical Chemistry, Interscience Publishers, John Wiley and Sons, London, 1963 Search PubMed.
- M. F. Huang, Analysis and Application of Chemical Auxiliary, China Textile&Apparel Press, Beijing, 2001 Search PubMed.
- S. J. Zhu, S. L. Wang, J. X. Ding, G. X. Liu, W. J. Liu, L. Liu, D. L. Wang, W. D. Li, Q. T. Gu and X. G. Xu, J. Cryst. Growth, 2014, 388, 98–102 CrossRef CAS.
- S. J. Zhu, S. L. Wang, J. X. Ding, G. X. Liu, D. L. Wang, L. Liu, W. D. Li, P. P. Huang, Q. T. Gu and X. G. Xu, J. Cryst. Growth, 2014, 402, 48–52 CrossRef CAS.
- S. Chandran, R. Paulraj and P. Ramasamy, Mater. Res. Bull., 2015, 68, 210–215 CrossRef CAS.
- M. Anis, M. D. Shirsat, G. Muley and S. S. Hussaini, Phys. B, 2014, 449, 61–66 CrossRef CAS.
- T. A. Land, T. L. Martin, S. Potapenko, G. Tayhas Palmore and J. J. De Yoreo, Nature, 1999, 399, 442–445 CrossRef CAS.
- K. Sangwal, J. Torrent-Burgues, P. Gorostiza and F. Sanz, Cryst. Res. Technol., 1999, 34, 667–675 CrossRef CAS.
- J. X. Ding, S. L. Wang, X. G. Xu, Q. T. Gu, X. Sun, Y. P. Li, B. Wang, G. X. Liu, W. J. Liu and Y. Sun, J. Mater. Sci., 2012, 47, 5232–5240 CrossRef CAS.
- S. J. Zhu, S. L. Wang, J. X. Ding, G. X. Liu and X. G. Xu, Cryst. Res. Technol., 2013, 48, 400–407 CrossRef CAS.
- S. F. Yang, G. B. Su, J. Tang, B. W. Mao, J. M. Wu and Z. D. Li, J. Cryst. Growth, 1999, 203, 425–433 CrossRef CAS.
- Y. Asakuma, E. Ukita, K. Maeda, K. Fukui, K. Iimura, M. Suzuki and M. Hirota, Cryst. Growth Des., 2007, 7, 420–424 CAS.
- Y. F. Qiu, M. W. Li, M. Cheng, Y. C. Cao and C. L. Pan, J. Appl. Biomater. Funct. Mater., 2012, 43, 2075–2078 CAS.
- N. P. Zaiteseva, J. J. De Yoreo and M. R. Dehaven, J. Cryst. Growth, 1997, 180, 255–262 CrossRef.
- W. K. Burton, N. Cubrera and F. C. Frank, Philos. Trans. R. Soc., A, 1951, 243, 299–358 CrossRef.
- R. J. Rosmalen and P. Bennema, J. Cryst. Growth, 1977, 42, 224–231 CrossRef.
- B. Liu, C. S. Fang and S. L. Wang, Cryst. Res. Technol., 2008, 43, 700–708 CrossRef CAS.
- G. W. Lu and X. Sun, Cryst. Res. Technol., 2002, 37, 93–99 CrossRef CAS.
- C. M. R. Remedios, W. Paraguassu, P. T. C. Freire, J. Mendes-Filho, J. M. Sasaki and F. E. A. Melo, Phys. Rev. B: Condens. Matter Mater. Phys., 2005, 72, 14121–14124 CrossRef.
- L. N. Rashkovich, KDP family of crystals, Hilger-Bristol, 1991 Search PubMed.
- A. V. Belustin and A. V. Kolona, Kristallografyia, 1975, 20, 206 Search PubMed.
| This journal is © The Royal Society of Chemistry 2017 |

