
 Open Access Article
 This Open Access Article is licensed under a
 Creative Commons Attribution 3.0 Unported Licence
Blue and cyan fluorescent carbon dots: one-pot synthesis, selective cell imaging and their antiviral activity†
Huabing Liu‡
ab,
Yanli Bai‡ab,
Yanrong Zhouac,
Chenchen Fengab,
Lingzhi Liuab,
Liurong Fangacd,
Jiangong Liang *ab and
Shaobo Xiao*acd
*ab and
Shaobo Xiao*acd
aState Key Laboratory of Agricultural Microbiology, Huazhong Agricultural University, Wuhan 430070, P. R. China. E-mail: liangjg@mail.hzau.edu.cn; vet@mail.hzau.edu.cn
bCollege of Science, Huazhong Agricultural University, Wuhan 430070, P. R. China
cCollege of Veterinary Medicine, Huazhong Agricultural University, Wuhan 430070, P. R. China
dThe Cooperative Innovation Center for Sustainable Pig Production, Wuhan 430070, P. R. China
First published on 26th May 2017
Abstract
Carbon dots (CDs) have demonstrated attractive potential in cell imaging and tracking. However, one of the most challenge problems is the selective entrance of CDs into the cytoplasm or cell nucleus. Here, a facile strategy was developed to prepare two types of CDs capable of selective entrance into cytoplasm and the whole cell without further surface modification. The surface charge of CDs changes from negative to neutral after the addition of urea in the hydrothermal process, and the as-prepared CDs exhibit different fluorescent colors. The blue-fluorescent CDs (b-CDs) can only enter the cytoplasm, while the cyan-fluorescent CDs (c-CDs) can distribute over the whole cell, including the nucleus. Additionally, the antiviral activity of the two CDs against pseudorabies virus (PRV) was studied and b-CDs were shown to have better antiviral activity. This study has provided a facile and novel strategy for the fabrication of CDs used in selective cell imaging, which may facilitate the application of CDs in nanomedicine.
Introduction
Carbon dots (CDs), a new type of fluorescent nanomaterial, have attracted considerable attention due to their significant advantages of environmental friendliness, high biocompatibility, low cytotoxicity and excellent cell membrane permeability.1–3 For these advantages, CDs serve as a promising material in various fields, such as chemical sensing,4,5 biosensing,6 bioimaging,7 catalysis8–10 and optronics.11,12 Furthermore, the color-tunable fluorescence optical properties and high quantum yields (QY) have made CDs an ideal optical material for multicolor cell imaging.13,14 Additionally, several studies have revealed that CDs possess good antiviral effect as an inhibitor of virus,15,16 and they can be used in nanomedicine17–19 and photothermal therapy,20,21 suggesting their good potential in clinic therapy.Currently, there are many different methods for fabricating CDs, generally including laser ablation,22 acidic/thermal oxidation,23 electrochemical synthesis,24 hydrothermal treatment,25 and microwave irradiation.26 The surface of as-prepared CDs possesses abundant functional groups, such as amino6 and carboxyl,27 leading to further modification and introduction of some new groups to their surface.26,28–30 Recently, green and facile preparation processes using natural sources have been developed to prepare various CDs, such as honey,31 milk,32 garlic,33 orange juice,34 silkworm chrysalis,7 peanut shells,35 and waste frying oil.23 Despite remarkable progress, it is still meaningful to control the selective entrance of CDs in imaging application, suggesting the necessity to develop a facile strategy for synthesis of various CDs capable of selective cell imaging and tracking.
Thus far, most of the reported CDs used in cell imaging and tracking are located in the cytoplasm, and rarely in cell nucleus. To our best knowledge, the effective strategy to enable the entrance of CDs into nucleus is to modify the surface of CDs with nucleus-location targeted group,36–38 and CDs without modification are rarely distributed in the nucleus. Moreover, it has been reported in our previous work that CDs possess good antiviral activity as an inhibitor of virus,15 and the antiviral mechanism is complex and diverse, suggesting the necessity to further study the mechanism of CDs for their antiviral activity.
In this study, we report a facile strategy for fabricating blue and cyan fluorescent CDs by using the powder of young barley leaves and controlling the reaction condition. The as-prepared CDs can not only selectively enter cytoplasm and the whole cell without further surface modification, but also exhibit different effective antiviral activity.
Experimental section
Apparatus
Fluorescence measurements were performed on a RF-5301PC spectrofluorometer (Shimadzu, Japan). The UV-vis absorption spectra were acquired on a UV-2450 spectrophotometer (Shimadzu, Japan). Fluorescence lifetime measurements were conducted on an FLS920 spectrometer (Edinburgh, England). Fourier-transform infrared (FT-IR) spectra were collected by a Nicolet Avatar-330 spectrometer (Thermo, USA) using the KBr pellet technique. Zeta potential and hydrodynamic diameters were measured by using a Zetasizer Nano ZS90 dynamic light scattering (DLS) system (Malvern, England). X-ray diffraction (XRD) pattern was carried out on a Bruker D8 Advance X-ray diffractometer with Cu Kα radiation. X-ray photoelectron spectroscopy (XPS) data were recorded using Escalab 250Xi X-ray photoelectron spectrometer (Thermo, USA). Transmission electron microscopy (TEM) images were recorded by a JEM-2100F transmission electron microscope (JEOL, Japan) at an acceleration voltage of 200 kV. The cell images were obtained by an Olympus FV10 laser scanning confocal microscope (Olympus, Japan).Reagents
The powder of young barley leaves was produced by Yamamoto Kampo Pharmaceutical Co. Ltd. Citri acid anhydrous (99.5%), quinine sulfate dihydrate (99.0%) and 3-(4,5-dimethyl-2-yl)-2,5-diphenyltetrazolium bromide (MTT, 98%) were obtained from Aladdin Regent Co. Ltd. Dulbecco's modified Eagle's medium (DMEM) and fetal bovine serum (FBS) were purchased from Invitrogen Regent Co. Ltd. Agarose was purchased from Promega Co. Ltd. Urea (99.0%) and other common solvents or salts were obtained from Sinopharm Chemical Regent Co. Ltd. Ultrapure water with a resistivity of 18.2 MΩ cm was used throughout the experiments. All these reagents were of analytical grade or better and used as obtained.Cells and viruses
Porcine kidney (PK-15) cells and Cervical carcinoma (HeLa) cells were purchased from the China Center for Type Culture Collection (CCTCC). Monkey kidney (MARC-145) cells were obtained from the American Type Culture Collection (ATCC). Three types of cells were maintained in DMEM supplemented with 10% FBS in a 5% CO2 incubator at 37 °C. Pseudorabies virus (PRV) strain Ea, a wild virulent strain isolated in China, was propagated in PK-15 cells.Synthesis of blue and cyan fluorescent CDs
In a typical procedure for synthesis of blue-fluorescent carbon dots (b-CDs), 0.20 g powder of barley young leaves was mixed with 0.40 g citric acid anhydrous and thoroughly mixed via grinding. Subsequently, the mixture was heated at 180 °C in a stainless steel autoclave for 3 h. After cooling to room temperature, the brown product was supplemented with 10.0 mL ultrapure water and dissolved adequately via ultrasonication. Then, the obtained turbid solution was centrifuged at 8000 rpm for 10 min, followed by filtering the supernatant through a 0.22 μm microporous membrane, and removing sodium salt and unreacted small molecules by dialysis in a dialysis bag (retained molecular weight: 500 Da). Finally, the yellow solution was collected and stored in the dark at 4 °C for further use. The synthetic procedure of cyan-fluorescent carbon dots (c-CDs) was similar to that of b-CDs except that 0.20 g powder of young barley leaves was mixed with 0.40 g citric acid anhydrous and 0.40 g urea, and the final black product was supplemented with 100.0 mL ultrapure water.Quantum yield measurement
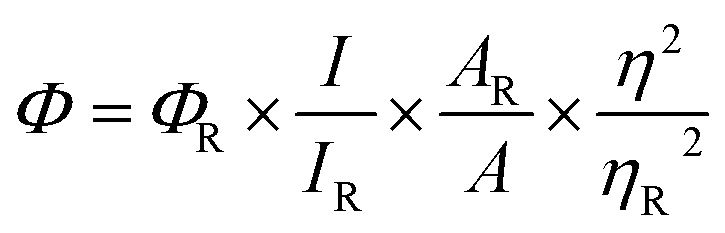
The QY of the two types of CDs was measured using quinine sulfate (QY = 54%) as the standard and calculated by the following equation:39where the subscript R represents the reference of quinine sulfate. I is the integrated emission intensity and A is the absorbance at the excitation wavelength. η stands for the refractive index of the solvent. The absorbance of each solution in this study was controlled below 0.10 at the excitation wavelength. The QY of as-prepared b-CDs and c-CDs was calculated to be 9.3% and 10.8%, respectively.
Cytotoxicity assay
The cytotoxicity of b-CDs was assessed by MTT. Briefly, PK-15 cells were seeded in a 96-well culture plate and incubated in DMEM supplemented with 10% FBS in a humidified 37 °C, 5% CO2 incubator for 24 h to reach 100% confluence. Then, the supernatant was removed and the cells were incubated with 100 μL fresh DMEM with 2% FBS containing different concentrations of CDs (0, 18.75, 37.5, 75 and 150 μg mL−1). After 12 h incubation, 20 μL per well MTT (5.0 mg mL−1) was added and incubated for another 4 h. After incubation, the supernatant was removed, and 150 μL of DMSO was added to each well, followed by a 10 min shaking to completely liberate the formazan crystals at room temperature. The cytotoxicity was determined by measuring the absorbance at 570 nm. Besides, HeLa cells and MARC-145 cells were used to analyze the cytotoxicity of b-CDs, and the cytotoxicity of c-CDs was measured similarly to the procedure described above except for the addition of different concentrations of c-CDs (0, 62.5, 125, 250 and 500 μg mL−1).Cell imaging
The potential of b-CDs for bioimaging was tested using PK-15 cells. Briefly, the cells were cultured in DMEM with 10% FBS at 37 °C under 5% CO2 until 80% confluence (approximately 4 × 10⁵ cells on the coverslip). Then, the medium was replaced with the mixture of 75 μg mL−1 b-CDs in DMEM with 2% FBS. After 2 h incubation at 37 °C under 5% CO2, the cells were washed three times with phosphate-buffered saline (PBS) to remove extra b-CDs. Next, the coverslip was sealed with 50% glycerin before imaging with a confocal fluorescence microscope at 405 nm. The bioimaging of c-CDs was performed similarly to the procedure described above except that the concentration of c-CDs was 250 μg mL−1.Viral replication and plaque assay
PRV, a double stranded DNA virus, is a typical study model for herpesvirus biology.40 Here, viral replication analysis and plaque assay were performed as previously reported.15 Typically, PK-15 cells in a monolayer were incubated with control DMEM (2% FBS) and two types of CDs (at the concentration of 0.13 mg mL−1 for both b-CDs and c-CDs) at 37 °C for 2 h, followed by separate infection with PRV at an multiplicity of infection (MOI) of 1.0 for 1 h. After 1 h incubation, the cells were washed twice with DMEM, followed by replacing the medium with DMEM (2% FBS) and two types of CDs, and then further incubated for 24 h. The infectivity of virions collected at 24 h post infection was determined by plaque assays. The average plaque number and standard deviations were calculated from three independent experiments and the virus titers were presented as plaque forming units (PFU mL−1).RNA exaction and real-time RT-qPCR
PK-15 cells seeded in 24-well plates were treated separately with 0.13 mg mL−1 b-CDs and c-CDs at 37 °C for 24 h, with the control only treated with DMEM (2% FBS). Total RNA was extracted from cells using TRIzol reagent (Invitrogen) at 24 h. Reverse-transcription was performed with 1.0 μg of each sample using a Transcriptor First Strand cDNA Synthesis Kit (Roche). Then, the obtained cDNA was used in subsequent SYBR green PCR assay (Applied Biosystems). The PCR conditions were as follows: 95 °C for 10 min, 40 cycles of 95 °C for 15 s, 56 °C for 30 s and 72 °C for 40 s. The primer sets (Table S1†) were designed by using the Primer Express software (Applied Biosystems, version 3.0).Statistical analysis
The experimental data were presented as mean ± standard deviation of three independent experiments and subjected to statistical analysis by one-way analysis of variance (ANOVA). A value of P < 0.05 was considered as statistical significance, and highly statistical significance was defined for values of P < 0.01.Results and discussion
Characterization of the CDs
The morphology and size of the two types of synthesized CDs were characterized by TEM and DLS analysis. From Fig. 1A and B, it can be seen that the as-prepared b-CDs are well dispersed and exhibit clear lattice fringes with a lattice spacing of 0.21 nm in the high resolution TEM (HRTEM) image, which is in accordance with the (102) facets of graphite carbon,4,41 implying the high crystallinity of the b-CDs. In Fig. 1C and D, the synthesized c-CDs present similar size distribution and crystalline structure. DLS measurements (Fig. S1†) reveal the size distribution of the two CDs in aqueous solution. The b-CDs have a narrow size range between 1.5 and 2.7 nm with an average diameter of 1.9 nm, and the c-CDs range from 2.0 to 4.2 nm with an average diameter of 2.7 nm, which is slightly larger than that of the b-CDs.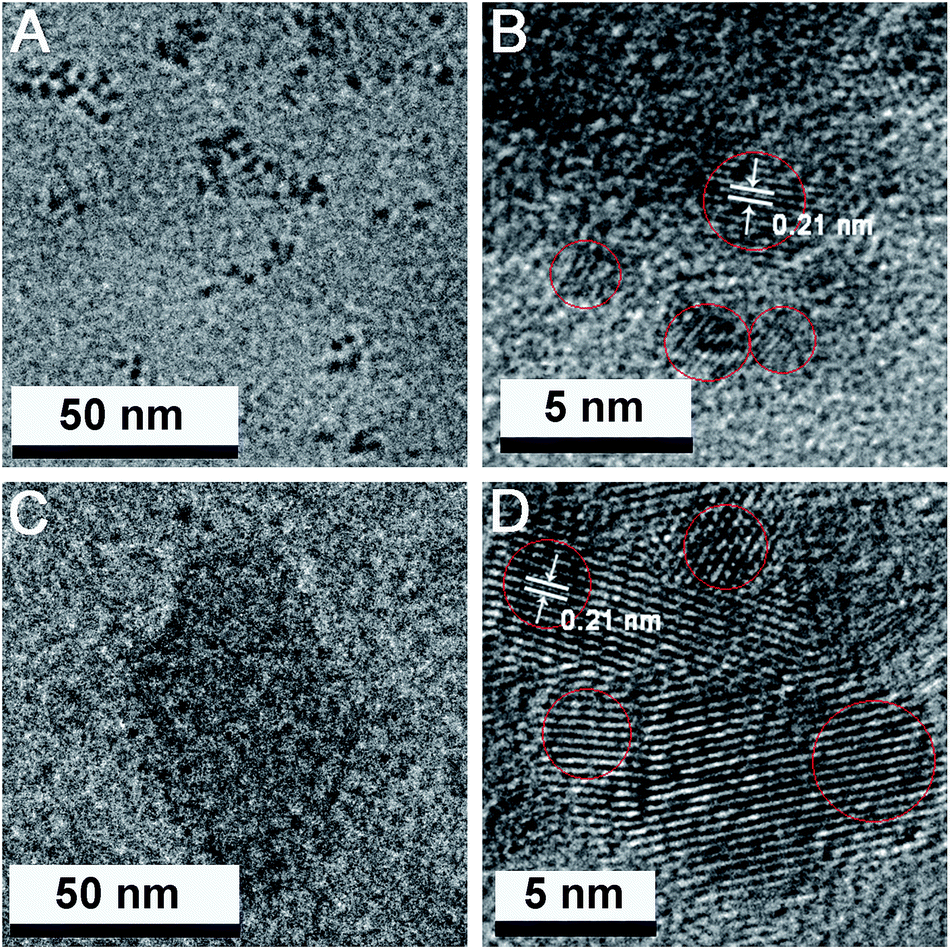 | ||
| Fig. 1 TEM (A) and HRTEM (B) images of the b-CDs. TEM (C) and HRTEM (D) images of the c-CDs. | ||
The XRD patterns of CDs in Fig. 2A and B show a broad peak centered at around 23°, indicating the interlayer spacing of (002) diffraction peak is 0.39 nm, which is associated with the graphitic structure, and the interlayer spacing is larger than that of graphite (0.34 nm), attributed to the existence of abundant functional groups.23,39,42 The functional groups on the surface of CDs were identified by FT-IR spectra. In Fig. 2C, b-CDs exhibit six characteristic absorption bands at 1200, 1400, 1707, 2929, 3203 and 3433 cm−1, which can be assigned to the stretching vibration of C–O, C–N, C![[double bond, length as m-dash]](https://www.rsc.org/images/entities/char_e001.gif) O, C–H, N–H and O–H, respectively. Additionally, c-CDs display four characteristic absorption bands of C–N at 1400 cm−1, CO at 1635 cm−1, N–H at 3213 cm−1 and O–H at 3446 cm−1 (Fig. 2D).
O, C–H, N–H and O–H, respectively. Additionally, c-CDs display four characteristic absorption bands of C–N at 1400 cm−1, CO at 1635 cm−1, N–H at 3213 cm−1 and O–H at 3446 cm−1 (Fig. 2D).
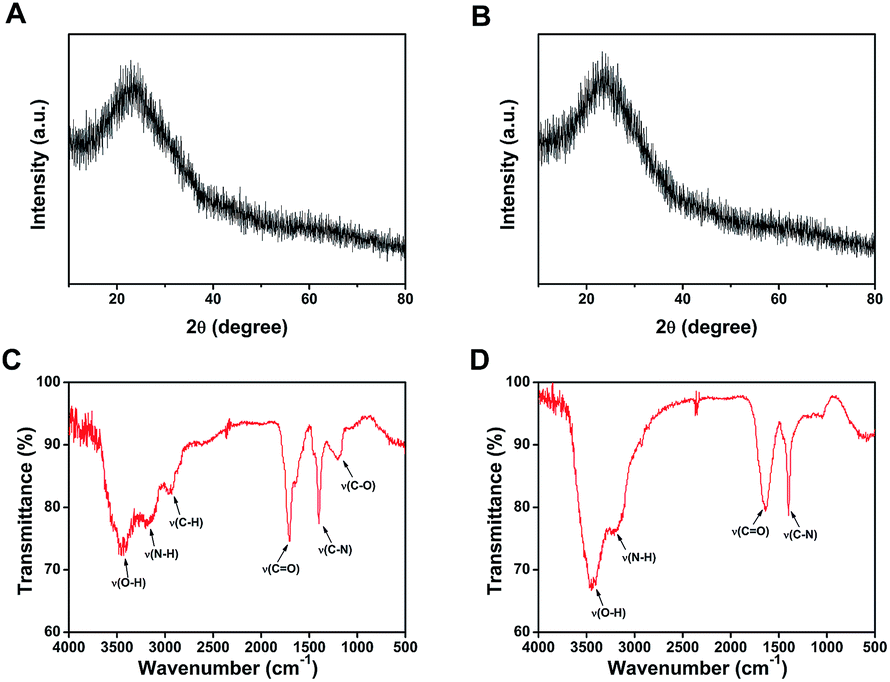 | ||
| Fig. 2 XRD patterns of b-CDs (A) and c-CDs (B). FT-IR spectra of b-CDs (C) and c-CDs (D). | ||
The elemental composition and chemical bonding of CDs were further investigated by XPS measurements. Fig. 3A displays three peaks of b-CDs at 284.8, 399.9, and 531.2 eV, which are attributed to C1s, N1s and O1s, with a calculated C/O/N ratio of 67.7%, 28.9% and 3.4%, respectively. The high resolution C1s spectrum (Fig. 3B) shows four peaks at 288.8, 286.1, 285.0 and 284.5 eV, attributed to COO−, C–O, C–N, and C–C groups, respectively.43,44 The O1s spectrum (Fig. 3C) reveals two relative oxygen species of CO (531.8 eV) and C–O (533.2 eV).44 The three typical peaks at 399.7, 400.3, and 401.5 eV in the deconvoluted N1s XPS spectrum (Fig. 3D) are attributed to C–N–C, N–(C)3 and N–H groups, respectively.45 Similarly, in Fig. 4A, the three peaks of c-CDs at 284.8, 399.9, and 531.2 eV are attributed to C1s, N1s and O1s, with a calculated C/O/N ratio of 68.1%, 20.1% and 11.8%, respectively, indicating that the nitrogen content of c-CDs is more than three times that of b-CDs after the addition of urea in the process of synthesis. The C1s spectrum (Fig. 4B) shows four peaks at 288.0, 286.0, 285.0 and 284.5 eV, attributed to CO, C–O, C–N, and C–C groups.46 The O1s spectrum (Fig. 4C) reveals two relative oxygen species of CO (531.3 eV) and C–O (532.7 eV).46,47 The three typical peaks at 399.6, 400.3, 401.4 eV in the deconvoluted N1s XPS spectrum (Fig. 4D) are attributed to C–N–C, N–(C)3 and N–H groups, respectively.45 The aforementioned results demonstrate that the b-CDs and c-CDs possess carboxyl group and acylamide group, respectively, which well supports the results of FT-IR spectra. Since the surface property of CDs greatly depends on the nitrogenous reactant in the hydrothermal process,37,48 the change of surface property can be attributed to the addition of urea. Carboxyl group of b-CDs may be derived from citric acid in the hydrothermal process, and the addition of urea induces the amidation of carboxyl group, resulting in the acylamide group of c-CDs.
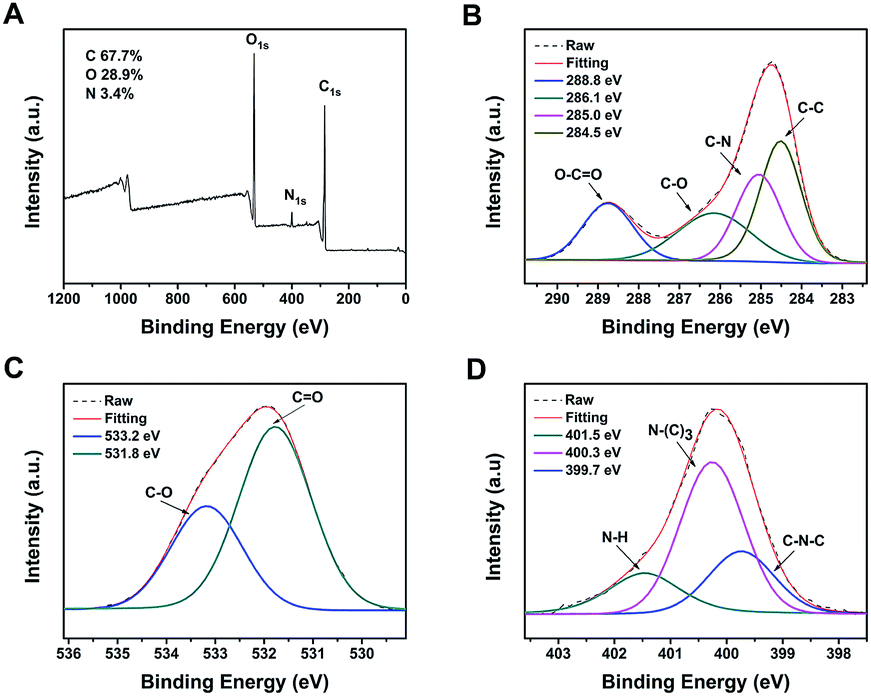 | ||
| Fig. 3 XPS survey spectrum of b-CDs (A) and high resolution XPS spectra of C1s (B), O1s (C) and N1s (D). | ||
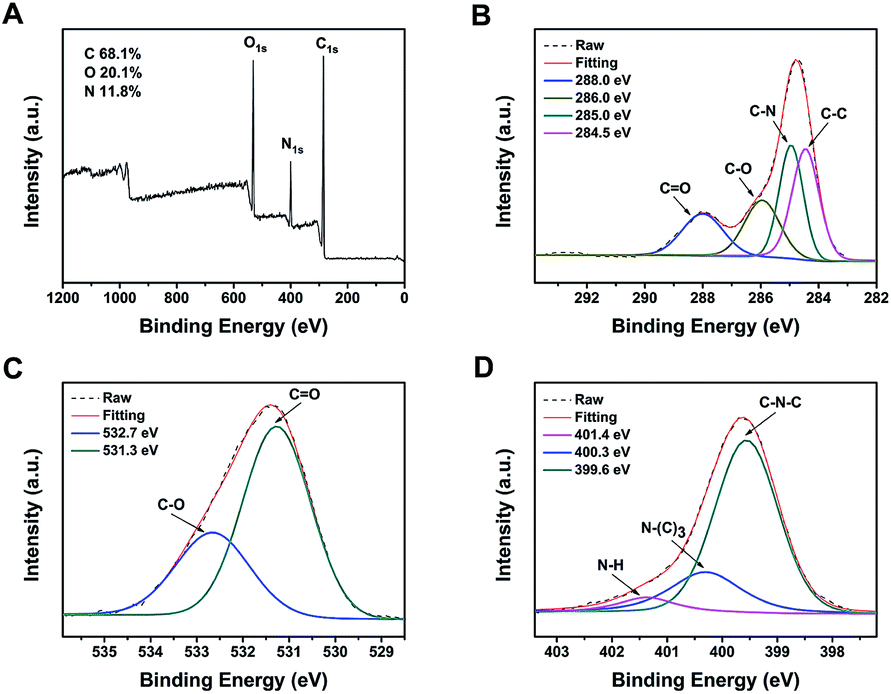 | ||
| Fig. 4 XPS survey spectrum of c-CDs (A) and high resolution XPS spectra of C1s (B), O1s (C) and N1s (D). | ||
Optical properties of the CDs
Due to the change of surface property, the two CDs may vary in optical property, which was thoroughly investigated by examining UV-vis absorption, fluorescence excitation and emission spectra and fluorescence lifetime. In Fig. 5A, the UV-vis absorption spectrum of b-CDs exhibits no obvious absorption peaks from 220 to 700 nm, which is consistent with previously reported CDs.23,49,50 Additionally, the fluorescence excitation peak of b-CDs is located at 360 nm with the fluorescence emission centered at 435 nm, and strong blue fluorescence from b-CDs was observed under the irradiation of UV lamp (365 nm). Fig. 5C shows a series of emission spectra of b-CDs at different excitation wavelengths in the range of 330 to 400 nm. The emission peaks slightly shift to longer wavelengths with a change in intensity. This excitation-dependent emission property of CDs is concordant with previous studies.32,39,50–52 The photostability of the b-CDs was investigated by measuring the time-resolved fluorescence decay. As shown in Fig. 5E, the average fluorescence lifetime of b-CDs is 8.95 ± 0.08 ns (Table S2†) when fitted with a double-exponential decay function.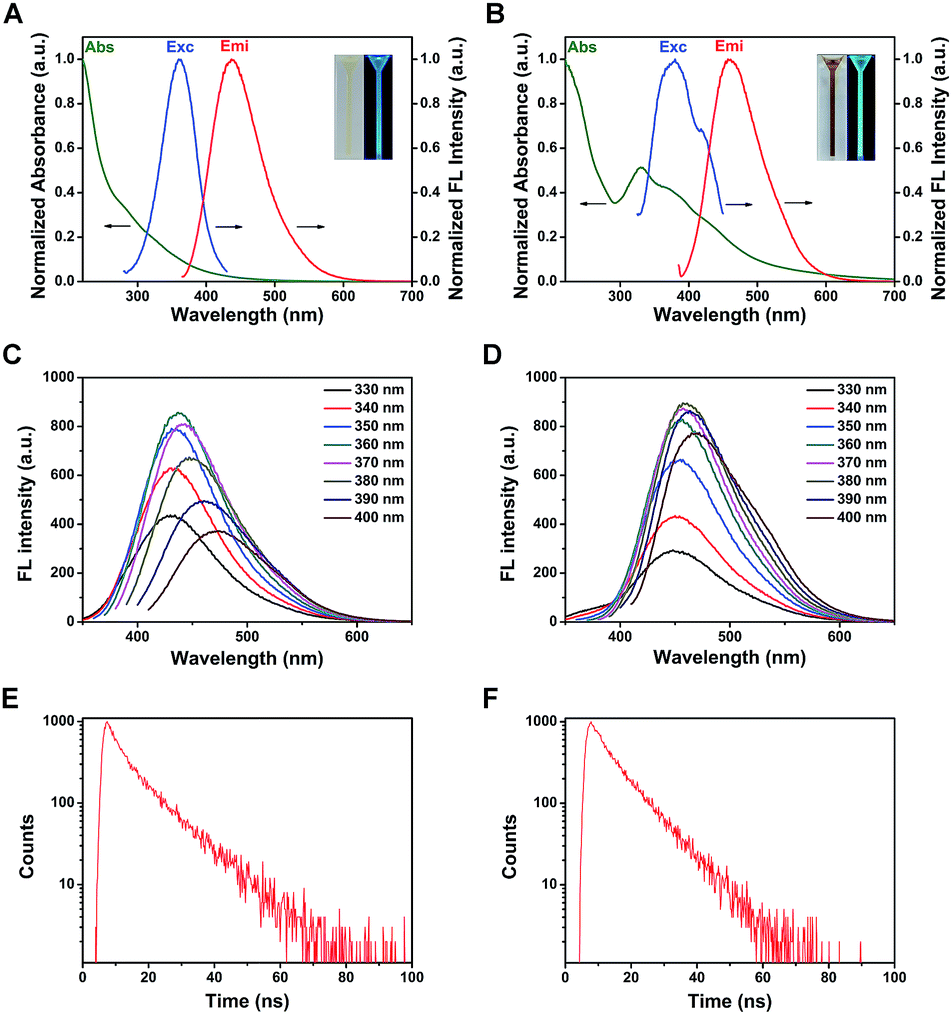 | ||
| Fig. 5 The UV-vis absorption, fluorescence excitation and emission spectra of the as-prepared b-CDs (A) and c-CDs (B), inset: images of CDs under irradiation of sunlight (left) and UV (right, 365 nm) light. Fluorescence emission spectra of b-CDs (C) and c-CDs (D) under excitation wavelength from 330 to 400 nm. Fluorescence decay curves of b-CDs (E) and c-CDs (F). | ||
The optical properties of c-CDs were also investigated similarly to b-CDs. In Fig. 5B, the UV-vis absorption spectrum of c-CDs exhibits an obvious absorption peak centered at 330 nm, which can be ascribed to n–p* transition of the CO bond.44,48 Furthermore, the excitation and emission peaks of c-CDs appear at 379 and 457 nm respectively with strong cyan fluorescence under the irradiation of UV lamp (365 nm). Fig. 5D shows a series of emission spectra of c-CDs at different excitation wavelengths in the range of 330 to 400 nm. Similar to b-CDs, the emission peaks exhibit slightly red shift with the increase of excitation wavelength. The average fluorescence lifetime of c-CDs in Fig. 5F was calculated to be 8.15 ± 0.06 ns (Table S2†).
Cytotoxicity assay
To demonstrate the biological application of the as-prepared CDs in cell imaging, the cytotoxicity of the two types of CDs on PK-15 cells, HeLa cells and MARC-145 cells were evaluated by MTT assay. As shown in Fig. 6, when the respective concentration of b-CDs and c-CDs increased to 150 μg mL−1 and 500 μg mL−1, the cell viability of PK-15 cells could still remain over 85% after 12 h incubation, suggesting a low cytotoxicity of the as-prepared CDs to the PK-15 cells. Besides, the results of the cytotoxicity assay of the two CDs on HeLa cells and MARC-145 cells (Fig. S2†) also show a low cytotoxicity. Additionally, no obvious cytotoxicity was observed when PK-15 cells were treated with 75 μg mL−1 of b-CDs and 250 μg mL−1 of c-CDs. Therefore, 75 μg mL−1 of b-CDs and 250 μg mL−1 of c-CDs were used in the subsequent cell imaging of PK-15 cells.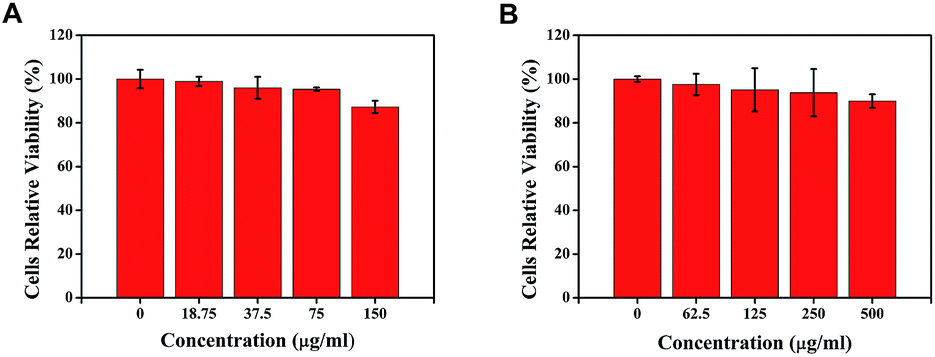 | ||
| Fig. 6 Cell viability assay of PK-15 cells treated with different concentrations of b-CDs (A) and c-CDs (B). | ||
Cell imaging of the CDs
The imaging application of the two CDs was validated by using them as a probe for confocal fluorescence imaging of PK-15 cells as a model. As shown in Fig. 7A, after 2 h of incubation with b-CDs, the cells became bright after excitation with 405 nm laser pulses. Moreover, the b-CDs were concentrated in the cytoplasm, with no obvious brightness observed in the nucleus. The results confirm the successful entrance of b-CDs into the cytoplasm through cell membrane. Due to their small size and good biocompatibility, the CDs can be easily enclosed through endocytosis and enter the cytoplasm to lighten the cytoplasm, which is concordant with the previously reported CDs.13,25,35,53–57 However, in Fig. 7B, the cyan fluorescence of c-CDs was observed in the whole cell area, including the cytoplasm and nucleus. As previously reported,36,38 the internalization process of CDs into cells is strongly influenced by size, surface charge, and groups of CDs. Small size and positive surface charge of CDs are beneficial to the cell internalization by electrostatic interactions, due to the negatively charged lipid membrane of the cells and DNA in the nucleus. Hence, the zeta potential of the two types of CDs was measured, which was −15.73 ± 2.35 mV for b-CDs and 0.14 ± 0.03 mV for c-CDs, indicating that the surface charge of CDs changed from negative to neutral with urea added in the hydrothermal process, leading to the successful entrance of c-CDs into nucleus. Generally, neutral CDs modified with polymer exhibit larger size, resulting in some difficulties in nucleus distribution.28,58 Additionally, in the cell imaging process of CDs, the interaction between CDs and proteins may exist in the cell culture medium, and the main reagent containing proteins in the culture medium is FBS. When the CDs are added into the cell culture medium, CDs can interact with proteins. Hao et al.59 and Lu et al.60 have reported the interaction of CDs with bovine serum albumin (BSA), and it is known that free CDs in the cell culture medium can be released in three different ways. Firstly, BSA really has a large hydrophobic cavity to accommodate two or more ligands. When two ligands bind to BSA simultaneously, two types of interaction can occur, competitive binding and non-competitive binding.61 Hence, the free CDs will be released after the binding sites of BSA are competitively occupied by other small molecules. Secondly, when small molecules bind independently to a set of equivalent sites on a macromolecule, the equilibrium between free and bound molecules exists.62 Though the complex of CDs and BSA may be formed by static quenching, the free CDs will also exist in the solution. Thirdly, BSA, as a nutrient in cell culture, can be hydrolyzed by protease during cell culture. The protease digestion can break the binding of nanoparticles on proteins, resulting in separation of nanoparticles from proteins,63 and the release of the free CDs following protease digestion of BSA in cells. For these reasons, the small size and neutral charge of free c-CDs led to the successful entrance of them into nucleus.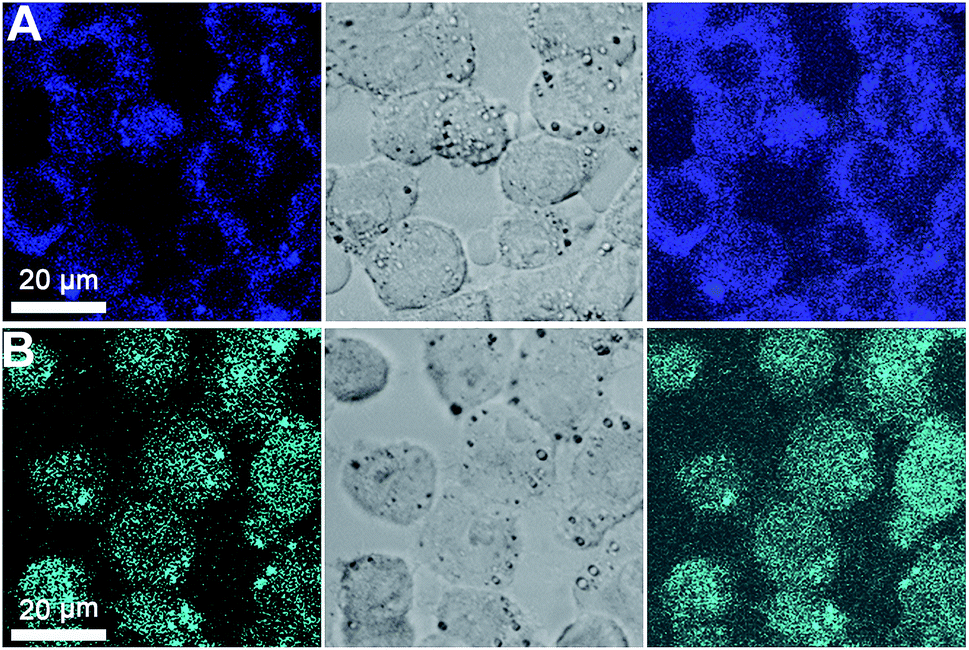 | ||
| Fig. 7 Confocal fluorescence images of PK-15 cells incubated with b-CDs (A) and c-CDs (B) for 2 h with an excitation wavelength at 405 nm. | ||
Currently, direct synthesis of CDs capable of entering cell nucleus still remains a great challenge, and the general strategy to solve this problem is modifying the surface of CDs with nucleus-location targeted group. Here, a facile approach to fabricate two types of CDs without further modification has developed. By slightly changing the reaction condition, the zeta potential of the two CDs was changed, resulting in the selective location of CDs in cell imaging. The b-CDs can only enter the cytoplasm, while the c-CDs can distribute over the whole cell, including nucleus.
Antiviral activity of the CDs
CDs have been studied as an inhibitor of PRV in our previous work.15 Here, in order to investigate the antiviral activity of the two types of CDs, the viral replication of b-CDs and c-CDs on PRV was measured separately by plaque assay. The results showed that the plaque in culture plate obviously reduced with the addition of CDs relative to the control group, indicating the effective antiviral activity of the two CDs against PRV. Furthermore, the relative titer of PRV remarkably decreased in the presence of the two CDs (Fig. 8), and the decrease degree of b-CDs is larger than that of c-CDs, suggesting the better antiviral activity of the former.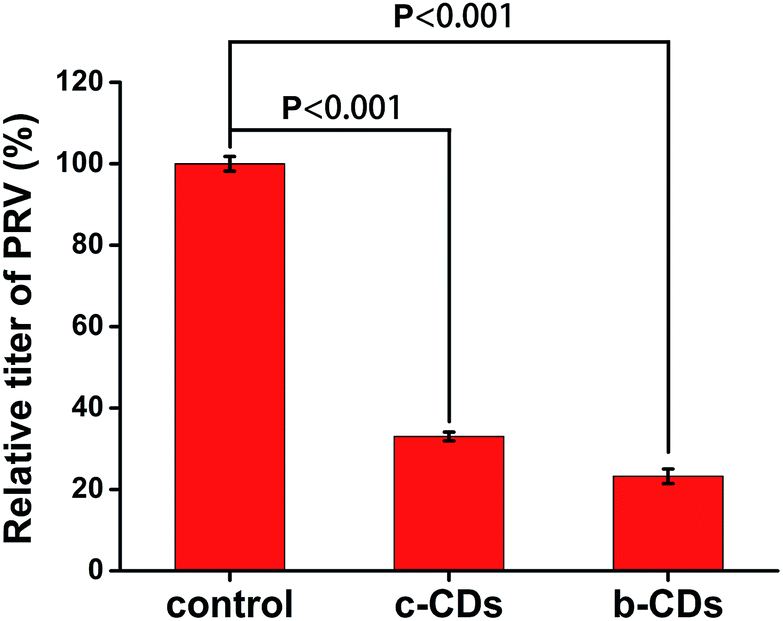 | ||
| Fig. 8 The effect of the two types of CDs on relative titer of PRV. The concentrations of b-CDs and c-CDs were 0.13 mg mL−1. | ||
Antiviral mechanism of the CDs
The innate immune response is the first line of defense against viral infection of the host, and the interferons (IFNs) system plays an important role in the defense mechanism against viruses.64,65 IFN-α and IFN-β are the best known antiviral innate immune molecules with a powerful antiviral response to viral infection.66 Intracellular IFNs activate the antiviral state of the cells mostly by inducing the expression of many IFN-stimulated genes (ISGs), which are the most powerful and efficient mediators among the known IFN-induced antiviral mechanisms and show broad-spectrum antiviral activity against several virus families.67–69 To explore the antiviral mechanism of the CDs, we concentrated on the evaluation of their effects on the expression of IFN-α, IFN-β and two typical ISGs (ISG54 and MX1) by RNA exaction and real-time RT-qPCR assays. The results showed that, when compared with the control group, the mRNA expression levels treated with c-CDs and b-CDs were 6.7-fold and 7.6-fold higher in IFN-α (Fig. 9A) as well as 2.5-fold and 3.6-fold higher in IFN-β (Fig. 9B), respectively. Then, the IFNs up-regulated the expression of ISGs to activate the antiviral state of the cells. As shown in Fig. 9C, the mRNA expression level of ISG54 was higher in PK-15 cells treated with CDs than in the control group, and it was 2.1-fold higher in b-CDs than in c-CDs. Analogously, the mRNA expression of MX1 (Fig. 9D) was also obviously higher in b-CDs than in c-CDs, which resulted in the better antiviral activity of b-CDs.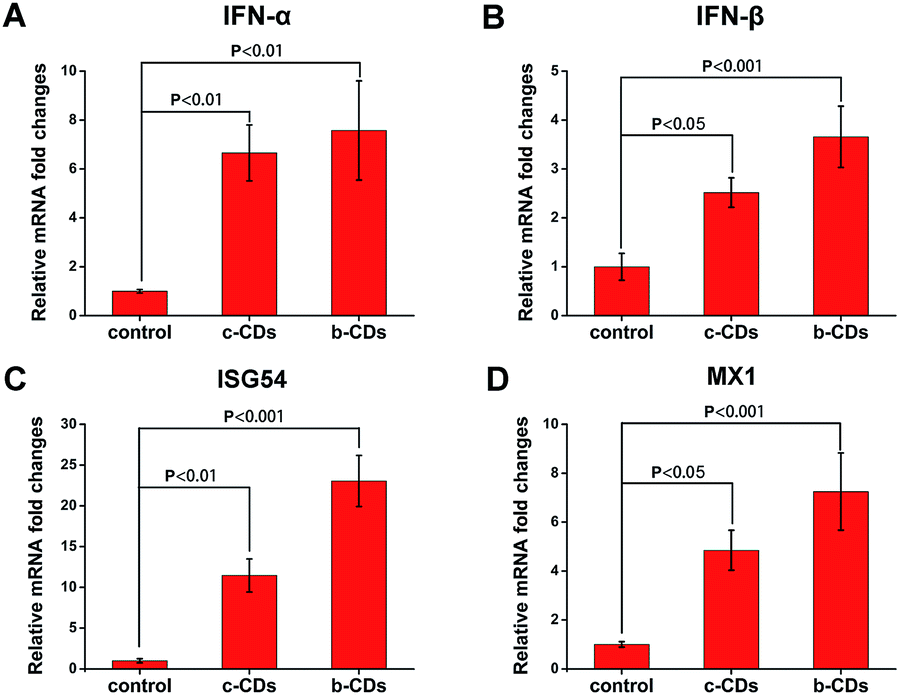 | ||
| Fig. 9 The expression of IFN-α (A), IFN-β (B), ISG54 (C) and MX1 (D) in PK-15 cells stimulated by 0.13 mg mL−1 b-CDs and c-CDs measured by real-time RT-qPCR. | ||
The variation in the mRNA expression level of IFN-α, IFN-β and ISGs may be attributed to the different cell location of the two types of CDs. Since the factors involved in the IFNs induction pathway are mostly located in cytoplasm, and the content of b-CDs distributed in cytoplasm is higher than that of c-CDs, the IFN-induced expression of ISG54 and MX1 is correspondingly higher in b-CDs than in c-CDs.
Conclusions
This study presents a facile and green strategy for synthesis of the two types of CDs with good biocompatibility for selective cell imaging only by changing the reaction conditions in the preparation process to transform their surface properties. The CDs prepared with the powder of young barley leaves as the same precursor exhibit different fluorescent colors after the addition of urea in the hydrothermal process, and they can be used for selective cell imaging and location without further surface modification. The b-CDs can only enter the cytoplasm of PK-15 cells, while the c-CDs can distribute over the whole cell, including nucleus. Furthermore, the better antiviral activity of b-CDs against PRV is probably attributed to their different cell location. The cell-selective imaging capability of the CDs may facilitate their application in nanomedicine.Acknowledgements
We gratefully acknowledge the financial support from National Key Research and Development Program (2016YFD0500105), and National Natural Science Foundation of China (31372439, 31490602).References
- V. Georgakilas, J. A. Perman, J. Tucek and R. Zboril, Chem. Rev., 2015, 115, 4744–4822 CrossRef CAS PubMed.
- S. Y. Lim, W. Shen and Z. Q. Gao, Chem. Soc. Rev., 2015, 44, 362–381 RSC.
- Y. F. Wang and A. G. Hu, J. Mater. Chem. C, 2014, 2, 6921–6939 RSC.
- Y. P. Hu, J. Yang, L. Jia and J. S. Yu, Carbon, 2015, 93, 999–1007 CrossRef CAS.
- Y. L. Zhai, Z. J. Zhu, C. Z. Zhu, J. T. Ren, E. K. Wang and S. J. Dong, J. Mater. Chem. B, 2014, 2, 6995–6999 RSC.
- W. Shi, X. H. Li and H. M. Ma, Angew. Chem., Int. Ed., 2012, 51, 6432–6435 CrossRef CAS PubMed.
- J. Feng, W. J. Wang, X. Hai, Y. L. Yu and J. H. Wang, J. Mater. Chem. B, 2016, 4, 387–393 RSC.
- H. J. Yu, Y. F. Zhao, C. Zhou, L. Shang, Y. Peng, Y. H. Cao, L. Z. Wu, C. H. Tung and T. R. Zhang, J. Mater. Chem. A, 2014, 2, 3344–3351 CAS.
- K. A. S. Fernando, S. Sahu, Y. M. Liu, W. K. Lewis, E. A. Guliants, A. Jafariyan, P. Wang, C. E. Bunker and Y. P. Sun, ACS Appl. Mater. Interfaces, 2015, 7, 8363–8376 CAS.
- J. Q. Pan, Y. Z. Sheng, J. X. Zhang, J. M. Wei, P. Huang, X. Zhang and B. X. Feng, J. Mater. Chem. A, 2014, 2, 18082–18086 CAS.
- X. Y. Zhang, Y. Zhang, Y. Wang, S. Kalytchuk, S. V. Kershaw, Y. H. Wang, P. Wang, T. Q. Zhang, Y. Zhao, H. Z. Zhang, T. Cui, Y. D. Wang, J. Zhao and W. W. Yu, ACS Nano, 2013, 7, 11234–11241 CrossRef CAS PubMed.
- Y. R. Zhu, X. B. Ji, C. C. Pan, Q. Q. Sun, W. X. Song, L. B. Fang, Q. Y. Chen and C. E. Banks, Energy Environ. Sci., 2013, 6, 3665–3675 CAS.
- K. Jiang, S. Sun, L. Zhang, Y. Lu, A. G. Wu, C. Z. Cai and H. W. Lin, Angew. Chem., Int. Ed., 2015, 54, 5360–5363 CrossRef CAS PubMed.
- Y. Xu, M. Wu, Y. Liu, X. Z. Feng, X. B. Yin, X. W. He and Y. K. Zhang, Chem.–Eur. J., 2013, 19, 2276–2283 CrossRef CAS PubMed.
- T. Du, J. G. Liang, N. Dong, L. Liu, L. R. Fang, S. B. Xiao and H. Y. Han, Carbon, 2016, 110, 278–285 CrossRef CAS.
- A. Barras, Q. Pagneux, F. Sane, Q. Wang, R. Boukherroub, D. Hober and S. Szunerits, ACS Appl. Mater. Interfaces, 2016, 8, 9004–9013 CAS.
- A. Mewada, S. Pandey, M. Thakur, D. Jadhav and M. Sharon, J. Mater. Chem. B, 2014, 2, 698–705 RSC.
- J. Kim, J. Park, H. Kim, K. Singha and W. J. Kim, Biomaterials, 2013, 34, 7168–7180 CrossRef CAS PubMed.
- C. J. Liu, P. Zhang, X. Y. Zhai, F. Tian, W. C. Li, J. H. Yang, Y. Liu, H. B. Wang, W. Wang and W. G. Liu, Biomaterials, 2012, 33, 3604–3613 CrossRef CAS PubMed.
- S. Pandey, M. Thakur, A. Mewada, D. Anjarlekar, N. Mishra and M. Sharon, J. Mater. Chem. B, 2013, 1, 4972–4982 RSC.
- P. Huang, J. Lin, X. S. Wang, Z. Wang, C. L. Zhang, M. He, K. Wang, F. Chen, Z. M. Li, G. X. Shen, D. X. Cui and X. Y. Chen, Adv. Mater., 2012, 24, 5104–5110 CrossRef CAS PubMed.
- Y. P. Sun, B. Zhou, Y. Lin, W. Wang, K. A. S. Fernando, P. Pathak, M. J. Meziani, B. A. Harruff, X. Wang, H. F. Wang, P. J. G. Luo, H. Yang, M. E. Kose, B. L. Chen, L. M. Veca and S. Y. Xie, J. Am. Chem. Soc., 2006, 128, 7756–7757 CrossRef CAS PubMed.
- Y. P. Hu, J. Yang, J. W. Tian, L. Jia and J. S. Yu, Carbon, 2014, 77, 775–782 CrossRef CAS.
- L. Bao, Z. L. Zhang, Z. Q. Tian, L. Zhang, C. Liu, Y. Lin, B. P. Qi and D. W. Pang, Adv. Mater., 2011, 23, 5801–5806 CrossRef CAS PubMed.
- M. Algarra, M. Perez-Martin, M. Cifuentes-Rueda, J. Jimenez-Jimenez, J. C. G. Esteves da Silva, T. J. Bandosz, E. Rodriguez-Castellon, J. T. Lopez Navarrete and J. Casado, Nanoscale, 2014, 6, 9071–9077 RSC.
- J. Chen, Y. Li, K. Lv, W. B. Zhong, H. Wang, Z. Wu, P. G. Yi and J. H. Jiang, Sens. Actuators, B, 2016, 224, 298–306 CrossRef CAS.
- A. H. Loo, Z. Sofer, D. Bousa, P. Ulbrich, A. Bonanni and M. Pumera, ACS Appl. Mater. Interfaces, 2016, 8, 1951–1957 CAS.
- M. Havrdova, K. Hola, J. Skopalik, K. Tomankova, M. Petr, K. Cepe, K. Polakova, J. Tucek, A. B. Bourlinos and R. Zboril, Carbon, 2016, 99, 238–248 CrossRef CAS.
- T. Feng, X. Z. Ai, G. H. An, P. P. Yang and Y. L. Zhao, ACS Nano, 2016, 10, 4410–4420 CrossRef CAS PubMed.
- W. J. Wang, X. Hai, Q. X. Mao, M. L. Chen and J. H. Wang, ACS Appl. Mater. Interfaces, 2015, 7, 16609–16616 CAS.
- X. M. Yang, Y. Zhuo, S. S. Zhu, Y. W. Luo, Y. J. Feng and Y. Dou, Biosens. Bioelectron., 2014, 60, 292–298 CrossRef CAS PubMed.
- L. Wang and H. S. Zhou, Anal. Chem., 2014, 86, 8902–8905 CrossRef CAS PubMed.
- S. J. Zhao, M. H. Lan, X. Y. Zhu, H. T. Xue, T. W. Ng, X. M. Meng, C. S. Lee, P. F. Wang and W. J. Zhang, ACS Appl. Mater. Interfaces, 2015, 7, 17054–17060 CAS.
- S. Sahu, B. Behera, T. K. Maiti and S. Mohapatra, Chem. Commun., 2012, 48, 8835–8837 RSC.
- M. Y. Xue, Z. H. Zhan, M. B. Zou, L. L. Zhang and S. L. Zhao, New J. Chem., 2016, 40, 1698–1703 RSC.
- K. K. R. Datta, O. Kozak, V. Ranc, M. Havrdova, A. B. Bourlinos, K. Safarova, K. Hola, K. Tomankova, G. Zoppellaro, M. Otyepka and R. Zboril, Chem. Commun., 2014, 50, 10782–10785 RSC.
- L. Yang, W. H. Jiang, L. P. Qiu, X. W. Jiang, D. Y. Zuo, D. K. Wang and L. Yang, Nanoscale, 2015, 7, 6104–6113 RSC.
- Y. F. Kang, Y. W. Fang, Y. H. Li, W. Li and X. B. Yin, Chem. Commun., 2015, 51, 16956–16959 RSC.
- Q. H. Liang, W. J. Ma, Y. Shi, Z. Li and X. M. Yang, Carbon, 2013, 60, 421–428 CrossRef CAS.
- X. W. Sui, J. C. Yin and X. F. Ren, Antiviral Res., 2010, 85, 346–353 CrossRef CAS PubMed.
- J. J. Huang, Z. F. Zhong, M. Z. Rong, X. Zhou, X. D. Chen and M. Q. Zhang, Carbon, 2014, 70, 190–198 CrossRef CAS.
- T. Q. Han, T. Yan, Y. Y. Li, W. Cao, X. H. Pang, Q. J. Huang and Q. Wei, Carbon, 2015, 91, 144–152 CrossRef CAS.
- Z. Li, H. J. Yu, T. Bian, Y. F. Zhao, C. Zhou, L. Shang, Y. H. Liu, L. Z. Wu, C. H. Tung and T. R. Zhang, J. Mater. Chem. C, 2015, 3, 1922–1928 RSC.
- Z. Yang, M. H. Xu, Y. Liu, F. J. He, F. Gao, Y. J. Su, H. Wei and Y. F. Zhang, Nanoscale, 2014, 6, 1890–1895 RSC.
- S. Liu, J. Q. Tian, L. Wang, Y. W. Zhang, X. Y. Qin, Y. L. Luo, A. M. Asiri, A. O. Al-Youbi and X. P. Sun, Adv. Mater., 2012, 24, 2037–2041 CrossRef CAS PubMed.
- R. Z. Zhang and W. Chen, Biosens. Bioelectron., 2014, 55, 83–90 CrossRef CAS PubMed.
- Z. S. Qian, J. J. Ma, X. Y. Shan, H. Feng, L. X. Shao and J. R. Chen, Chem.–Eur. J., 2014, 20, 2254–2263 CrossRef CAS PubMed.
- Y. C. Lu, J. Chen, A. J. Wang, N. Bao, J. J. Feng, W. P. Wang and L. X. Shao, J. Mater. Chem. C, 2015, 3, 73–78 RSC.
- X. Q. Fan, Y. Feng, Y. Y. Su, L. C. Zhang and Y. Lv, RSC Adv., 2015, 5, 55158–55164 RSC.
- L. Zhou, B. Z. He and J. C. Huang, Chem. Commun., 2013, 49, 8078–8080 RSC.
- R. J. Fan, Q. Sun, L. Zhang, Y. Zhang and A. H. Lu, Carbon, 2014, 71, 87–93 CrossRef CAS.
- S. B. Ruan, J. Qian, S. Shen, J. H. Zhu, X. G. Jiang, Q. He and H. L. Gao, Nanoscale, 2014, 6, 10040–10047 RSC.
- Q. L. Liu, S. H. Xu, C. X. Niu, M. F. Li, D. C. He, Z. L. Lu, L. Ma, N. Na, F. Huang and H. Jiang, Biosens. Bioelectron., 2015, 64, 119–125 CrossRef CAS PubMed.
- Y. F. Chen, Y. Y. Wu, B. Weng, B. Wang and C. M. Li, Sens. Actuators, B, 2016, 223, 689–696 CrossRef CAS.
- Z. Zhou, Q. M. Wang, J. Y. Wang and C. C. Zhang, Carbon, 2015, 93, 671–680 CrossRef CAS.
- Y. F. Huang, X. Zhou, R. Zhou, H. Zhang, K. B. Kang, M. Zhao, Y. Peng, Q. Wang, H. L. Zhang and W. Y. Qiu, Chem.–Eur. J., 2014, 20, 5640–5648 CrossRef CAS PubMed.
- Z. M. Zhang, Y. P. Shi, Y. Pan, X. Cheng, L. L. Zhang, J. Y. Chen, M. J. Li and C. Q. Yi, J. Mater. Chem. B, 2014, 2, 5020–5027 RSC.
- E. Oh, J. B. Delehanty, K. E. Sapsford, K. Susumu, R. Goswami, J. B. Blanco-Canosa, P. E. Dawson, J. Granek, M. Shoff, Q. Zhang, P. L. Goering, A. Huston and I. L. Medintz, ACS Nano, 2011, 5, 6434–6448 CrossRef CAS PubMed.
- A. J. Hao, X. J. Guo, Q. Wu, Y. Sun, C. R. Cong and W. J. Liu, J. Lumin., 2016, 170, 90–96 CrossRef CAS.
- H. Lu, X. H. Shan, J. Chen, Y. H. Jiang, J. Q. Chen and Z. Y. Yan, New Res. Carbon Mater., 2013, 28, 307–312 CAS.
- Y. N. Ni, X. Zhang and S. Kokot, Spectrochim. Acta, Part A, 2009, 71, 1865–1872 CrossRef PubMed.
- S. Neelam, M. Gokara, B. Sudhamalla, D. G. Amooru and R. Subramanyam, J. Phys. Chem. B, 2010, 114, 3005–3012 CrossRef CAS PubMed.
- N. Li, S. Zeng, L. He and W. W. Zhong, Anal. Chem., 2011, 83, 6929–6934 CrossRef CAS PubMed.
- J. Xiao, J. Yan, H. Chen, J. Li, Y. Tian, L. S. Tang and H. Feng, Fish Shellfish Immunol., 2016, 58, 584–592 CrossRef CAS PubMed.
- S. Gao, A. von der Malsburg, A. Dick, K. Faelber, G. F. Schroder, O. Haller, G. Kochs and O. Daumke, Immunity, 2011, 35, 514–525 CrossRef CAS PubMed.
- G. C. Sen, Annu. Rev. Microbiol., 2001, 55, 255–281 CrossRef CAS PubMed.
- F. Terenzi, D. J. Hui, W. C. Merrick and G. C. Sen, J. Biol. Chem., 2006, 281, 34064–34071 CrossRef CAS PubMed.
- J. Verhelst, P. Hulpiau and X. Saelens, Microbiol. Mol. Biol. Rev., 2013, 77, 551–566 CrossRef PubMed.
- P. S. Mitchell, C. Patzina, M. Emerman, O. Haller, H. S. Malik and G. Kochs, Cell Host Microbe, 2012, 12, 598–604 CAS.
Footnotes |
| † Electronic supplementary information (ESI) available: Hydrodynamic diameters and fluorescence lifetimes of the two types of CDs, cytotoxicity assay of the two types of CDs on HeLa cells and MARC-145 cells, and primer sequences used for real-time RT-qPCR in this study. See DOI: 10.1039/c7ra03167j |
| ‡ These authors contributed equally to this work. |
| This journal is © The Royal Society of Chemistry 2017 |