
 Open Access Article
 This Open Access Article is licensed under a
 Creative Commons Attribution 3.0 Unported Licence
Au@Ag core–shell nanoparticles with a hidden internal reference promoted quantitative solid phase microextraction-surface enhanced Raman spectroscopy detection†
Lei Sun,
Min Zhang,
Vinothkumar Natarajan,
Xiaofei Yu,
Xiaoli Zhang* and
Jinhua Zhan *
*
Key Laboratory for Colloid & Interface Chemistry of Education Ministry, Department of Chemistry, Shandong University, Jinan, Shandong 250100, P. R. China. E-mail: jhzhan@sdu.edu.cn
First published on 3rd May 2017
Abstract
The combined applications of solid phase microextraction coupled with surface enhanced Raman spectroscopy (SPME-SERS) detection have been successfully used in environmental analysis. In this work, ZnO nanorods (ZnO NRs) decorated with Au@4-ATP@Ag core–shell nanoparticles (NPs) were fabricated on a stainless steel fiber. The inclusion of an internal reference significantly improved the quality of the quantitative SERS measurements of the analytes. The obtained SERS-active SPME fiber resulted in a better reproducibility of the SERS signals. The relative standard deviation (RSD) value of the SERS-active SPME fiber was found to be 6.7% using malachite green (MG) as a probe molecule. A RSD value of 6.8% was observed when the SERS-active SPME fiber was exposed to laser irradiation continuously for about 10 min. These results suggest that the fiber was prepared with good stability and uniformity. Quantitative SERS measurements of the SERS-active SPME fiber showed an excellent quantitative ability for the detection of MG and crystal violet (CV) in aquaculture water. In CV, the results showed a good linear relationship in the concentration range of 5 × 10⁻⁸ M to 5 × 10⁻⁶ M, and the limit of detection (LOD) can reach 1.9 × 10⁻⁹ M (S/N = 3). This result indicates that the inclusion of an internal reference can effectively correct the signal fluctuation. This work provides versatile detection capability for rapid on-site quantitative SERS detection of different molecular species in environmental media.
1. Introduction
It is necessary to monitor pollutants in the aquatic environment to satisfy the requirements of legislative frameworks and directives concerning water quality and health risks. Wastewater discharged from various industries such as silk, leather, textile and paper industries has become a major environmental hazard in recent years. The effluents from these industries contain heavy metals and toxic dyes, related to many toxic effects such as carcinogenesis, mutagenesis and toxicity to aquatic life. The discharge of dyestuffs into natural water could directly affect aquatic ecosystems and food chains. In addition, having food prepared from a fish contaminated with dyes poses great health issues to human beings because of their toxicity and carcinogenicity. Therefore, treatment of waste water and quick on-site measurement of these pollutants has received considerable attention in order to maintain water quality standards before they are discharged into water bodies.1–3Conventional sampling methods require large amounts of solvents, long extraction times, and multiple steps. Therefore, a new sample preparation technique with simple, sensitive and time-efficient has becomes a hotspot issue of current research. Prior to analysis, volatile and semivolatile substances in a matrix or in solution may be preconcentrated without more laborious manipulations. The following techniques such as liquid extraction (LE), solid-phase extraction (SPE) and solid phase microextraction (SPME) are powerful pre-concentration procedures for extraction of pollutant in environmental monitoring. Particularly, SPME is a simple, solvent-free on-site sampling method for separating and preconcentrating the target compounds of low concentration from various sample matrices.4–6
Many studies have reported that SPME coupled with gas chromatography (GC),7 gas chromatography-mass spectrometry (GC-MS),8 high performance liquid chromatography (HPLC) and capillary electrophoresis (CE) for the detection of analytes in biological, environmental and food analysis.9,10 Further, various spectroscopic methods are also coupled with SPME in the detection of analytes. Daniel et al. investigated SPME coupled infrared spectroscopy technique for the detection of a variety of organic compounds such as benzene, chlorobenzene, toluene, chloroform, and p-chlorotoluene in water. The authors showed that SPME-IR could be used to detect the individual compounds in mixtures by extracting aromatic compounds from the gasoline contaminated water samples.11,12
Raman spectroscopy is a powerful tool to acquire information about the vibrational modes of molecules. An inelastically scattered light by the molecular vibrations of a given molecular structure is collected to form a Raman spectrum.13 Raman spectroscopy is also a powerful tool in environmental monitoring.14–17 Brian and David demonstrated that BTEX could be detected in 2–3 orders of magnitude using SPME coupled Raman spectroscopy. Their detection limits were in the range of 1–4 ppm. The authors also observed the excellent selectivity for the detection of BTEX compounds by SPME.14,18 However, the low strength of Raman signals is the main drawback associated with this technique.
SERS technique can be used to greatly amplify the Raman signals of the molecules and has been considered to be an ultrasensitive label-free detection method, which greatly extends the application of Raman spectroscopy.19–21 SERS technique has been applied to a variety of applications.22–28 There have been efforts to combine the advantages of SPME and SERS for rapid detection of environmental pollutants.29–31 The critical issues associated with the application of SERS as a routine-technique is the variation of enhancement factors from one substrate to another and also from different regions of the same substrate.32,33 Considering the challenges encountered, many research efforts have been focused to achieve efficient quantitative SERS measurements using SERS substrates.34
Herein, we reported the SERS-active SPME fiber using Au@4-ATP@Ag NPs for the quantitative detection of analytes in water. 4-ATP simultaneously served as the internal SERS reference. A simple and on-site SPME-SERS method was proposed for the detection of pollutants in aquaculture water. The quantitative measurements of two analytes, MG and CV, are shown in this study to demonstrate the detection capability of this scheme. This work highlights the potential application of this technique for rapid on-site analysis of environmental pollutants.
2. Experimental section
2.1 Chemicals and reagents
Stainless steel fibers (O.D., 0.20 mm) were purchased from the An Ting Micro-Injector Factory (Shanghai, China). Zinc nitrate hexahydrate (Zn(NO3)2·6H2O) and hexamethylenetetramine (HMT) were provided by Sinopharm Chemical Reagent Co. Ltd. (Shanghai, China). 4-Aminothiophenol (4-ATP, 97%) was obtained commercially from Sigma-Aldrich. Silver nitrate (AgNO3), sodium citrate, chloroauric acid (HAuCl4), 3-aminopropyltriethoxysilane (APTES), dimethyl sulphoxide (DMSO), malachite green, crystal violet, acetone and ethanol were procured from Sinopharm Chemical Reagent Co., Ltd. (Shanghai, China). Ultrapure water (18.25 MΩ cm) was used in the experiments. All reagents used in the experiments were analytical grade and used as received without further purification.2.2 Characterization techniques
The morphology of the SERS-active fiber was characterized by using a scanning electron microscope (JSM-6700 field-emission scanning electron microscope). Transmission electron microscopy (TEM) images were obtained using a JEOL JEM-1011. UV-Vis absorption spectra were recorded on a Purkinje TU-1901 spectrometer. All the Raman measurements were carried out using an Ocean Optics QE65000 Raman spectrometer equipped with a TE-cooled FFT-CCD detector. The excitation wavelength was set as 785 nm and the input laser power was about 200 mW. The total accumulation time of the SERS measurement was 1 and 5 s for the fibers and sol, respectively. All the spectra were calibrated with standard silicon wafers as reference to the Raman mode of silicon at 520.7 cm−1.2.3 Fabrication of the SERS-active SPME fiber with internal reference
The synthesis of Au@4-ATP@Ag core–shell NPs is similar to that reported in the literature.35 In a typical run, gold nanoparticles were synthesized through thermal reduction of HAuCl4 using sodium citrate according to a previously published method.36 After the reduction of gold chloride, centrifugation was performed to remove the extra sodium citrate ions present in the solution. 0.5 mL of 4-ATP (0.01 mM) dissolved in ethyl alcohol was added to 10 mL of as-prepared gold nanoparticles solution under stirring condition. Then the solution was kept overnight at room temperature. Afterwards, hydroquinone (200 μL, 10 mM in water) was added to 10 mL Au@4-ATP solution followed by adding AgNO3 (200 μL, 10 mM in water) under vigorous stirring.37 In order to complete the reaction the solution was kept at room temperature for about 6 h. The precipitates were collected after the centrifugation (10 min at 8000 rpm) and re-dispersed in 10 mL of deionized water for later use. Different Au@4-ATP@Ag samples were also prepared by changing the amount of 4-ATP and AgNO3 in order to obtain the optimal value. The Au@Ag NPs were prepared by following the similar procedures without the addition of 4-ATP.The stainless steel fibers (3.5 cm) were rinsed with acetone, ethanol and ultrapure water under ultrasonication for 5 min. The ZnO NRs on the fiber were prepared by a hydrothermal reaction according to the report published by Lori et al.38 The fibers were immersed in a 0.005 M zinc acetate dihydrate solution for 1 min. Then the fibers were dried in argon atmosphere followed by coating step repeated for about three to five times. After that, the fibers were heated to 350 °C in air for 20 min to yield layers of ZnO islands. The aligned nanocrystal seeds in aqueous solution at 90 °C for 4 h resulted into ZnO NRs. As an inorganic solid phase microextraction coating, ZnO NRs own thermally and chemically stability,39 and can be used as a good load matrix for the gold and silver materials.40 Moreover, ZnO has a good extraction effect for some organic compounds, especially for mercapto compounds.41
The Au@4-ATP@Ag core–shell NPs were coupled to the stainless steel fibers coated with ZnO NRs by surface modification using amino groups according to previously published method.40 The fibers were immersed into 80 mL dimethyl sulphoxide (DMSO). Then, 10.8 g of 3-aminopropyltriethoxysilane (APTES) was added to the solution and the solution was heated for 3 h at 120 °C. The amino-functionalized ZnO NRs coated fibers were taken out from the solution and washed repeatedly with ethyl alcohol. Further, the fibers were immersed into Au@4-ATP@Ag core–shell NPs sol for 10 h. After that, the fibers were rinsed several times with distilled water followed by ethyl alcohol and dried in the air. Two analytes such as malachite green and crystal violet were taken as probe molecules. The analytes were dissolved in water to achieve the desired concentration and also to simulate the aquaculture water.
3. Results and discussion
3.1 Characterization of the Au@4-ATP@Ag NPs
Fig. 1A shows the TEM image of Au@4-ATP@Ag NPs. It could be observed that the darker nucleus corresponds to the Au NPs and the lighter shell corresponds to the Ag shell. The average diameter of the nanoparticles was found as 45 nm. The UV-vis spectra of Au@4-ATP@Ag NPs were shown in Fig. 1B. The absorption bands were observed at 400 nm and also in the wavelength range of 480–510 nm. The spectrum of Au@4-ATP@Ag contains a broad band at 400 nm represents the plasmon band of Ag. A slightly blue shifted Au plasmon band was observed in the ∼480–510 nm wavelength range when compared with the UV-vis spectrum of Au@4-ATP nanoparticles. HRTEM image and elemental mapping of Au@4-ATP@Ag NPs can be seen in Fig. S6 and S7.† These results confirmed the formation of the Ag-shell on the Au@4-ATP. More TEM images of Au@4-ATP@Ag NPs were shown in Fig. S8.†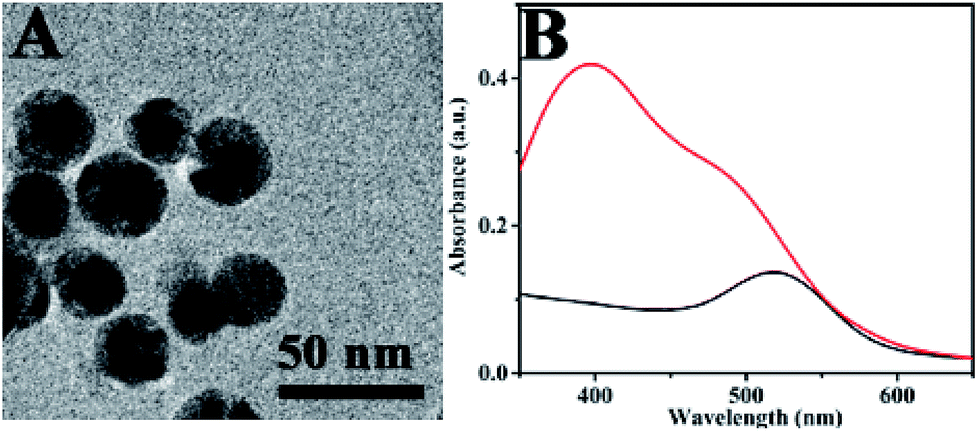 | ||
| Fig. 1 (A) TEM image of Au@4-ATP@Ag NPs. (B) UV-Vis spectra of Au NPs (black) and Au@4-ATP@Ag NPs (red). | ||
4-ATP was chosen as a probe molecule in this work. The probe molecules were embedded between Au core and Ag shell in the core–shell structure. Thus it makes there is no competition between the analytes and probe molecules for the nanoparticles surface. Moreover, the embedded probe molecules led to achieve an effective feedback to correct the fluctuation of samples and measuring conditions.42 The Raman measurements of the prepared samples are shown in Fig. 2. The peaks at 1140, 1391 and 1440 cm−1 were assigned to the b2 modes of the 4-ATP molecule, which has been widely accepted. Their peak intensities have been widely used to estimate the SERS enhancement of some unique substrates.43 As shown in Fig. 2, a much higher Raman signal was observed for 4-ATP embedded in the Au@4-ATP@Ag NPs among all the samples. Even same amount of 4-ATP molecules were added, the Raman intensity of 4-ATP molecules adsorbed onto the surface of Au@Ag NPs exhibited a lower signal compared with Au@4-ATP@Ag NPs.
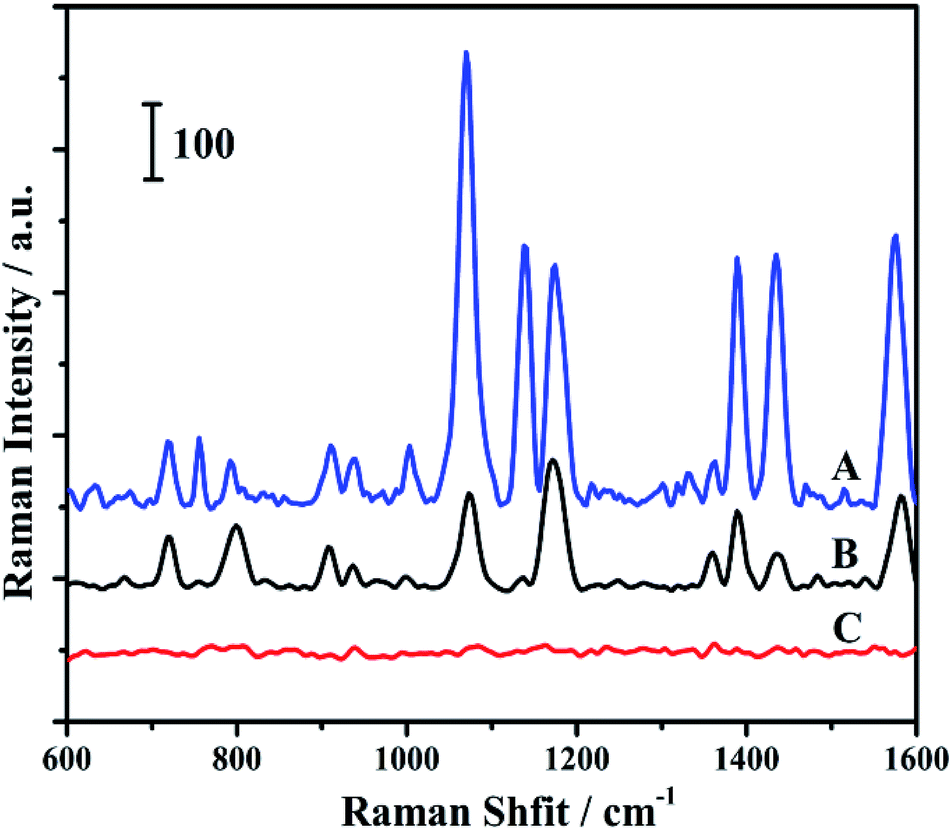 | ||
| Fig. 2 Raman spectra of Au@4-ATP@Ag nanoparticles (A), Au@Ag nanoparticles with 4-ATP added (B) and Au@Ag nanoparticles (C). | ||
Huang and his co-workers reported that 4-ATP could be selectively and rapidly (in several seconds) oxidized to p,p′-dimercaptoazobenzene (DMAB) on Au or Ag nanoparticles at room temperature during conventional SERS measurements. The obtained b2 mode signals were originated from DMAB rather than 4-ATP.44 The b2 mode signals were dropped when compared to the other peaks in the curve B as shown in Fig. 2. It can be explained by the fact that when two 4-ATP molecules are located at a distance far away from each other in solution may lead to reduce the bonding between the molecules. Even if all the molecules adsorbed on the surface nanoparticles, the distance between two molecules was still much longer than that in the shell on account of the larger surface areas of core–shell nanoparticle compared to the core. As a result, the transformation of 4-ATP to DMAB would be more difficult.
The Raman measurements were used to optimize the internal reference molecule amount and silver shell thickness. The results were included in the ESI in Fig. S1 and S2.† The amount of internal reference molecule and also the thickness of the silver shell had an impact on Raman intensity. The peak at 1075 cm−1 has been chosen as internal standard peak, and the other peaks were not considered. With increase in the amount of 4-ATP, the peak height was observed as increased as shown in Fig. S1.† The sol became unstable once the volume increased to 1000 μL. The amount of 4-ATP was chosen as 500 μL in this work.
As shown in Fig. S2,† the Raman signal was observed as increased with the increase in the amount of AgNO3 due to the stronger Raman enhancement ability of Ag compared to that of Au. When the AgNO3 amount was greater than 2 μmol, the sol changed into a turbid state. Therefore, 2 μmol was selected as the optimized AgNO3 amount.
3.2 Characterization of the SERS-active SPME fiber
Fig. 3A shows the SEM images of ZnO NRs grown on the stainless steel fibers. The ZnO NRs were vertically aligned on the stainless steel fibers. The rods were in close proximity and formed a uniform 3D structure. Au@4-ATP@Ag NPs were adsorbed on the side and top surfaces of the ZnO NRs by self-assembly, which can be seen clearly in Fig. 3B.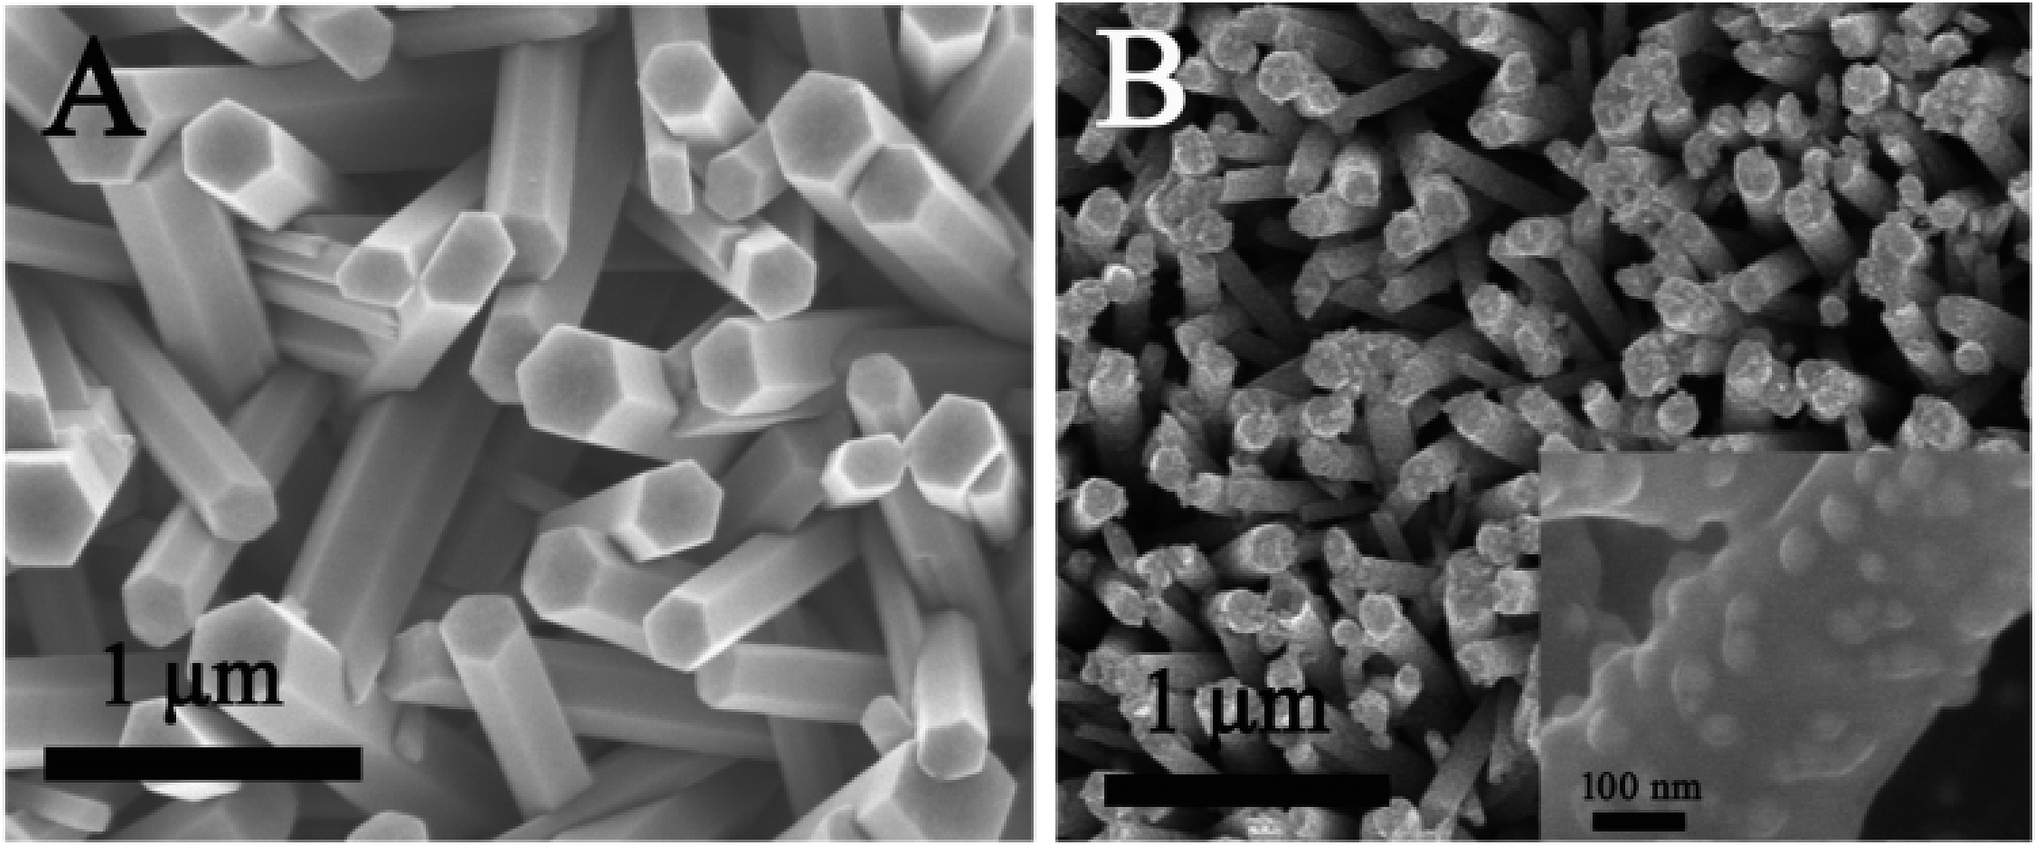 | ||
| Fig. 3 (A) SEM image of ZnO NRs; (B) SEM image of ZnO NRs with core–shell NPs coupled onto them. Inset: enlarged SEM image. | ||
3.3 Uniformity and stability of the as-prepared SERS-active SPME fiber
The uniformity of the SERS-active substrates is one of the essential parameters for SERS detection in analytical applications. As shown in Fig. 4A, the SERS spectra of MG at 20 randomly-selected points were recorded to evaluate the uniformity of the as-prepared fiber. The RSD value of the Raman intensity of the MG at 1174 cm−1 was 10.7%. After normalization, the RSD value was reduced to 6.7%, which can be seen in Fig. 4B. The results demonstrated that the normalization effectively reduced the nonuniformity caused by the variation of the adsorbed molecular number, fluctuation of the excitation and scattered field. This can also be proved by the following theoretical calculation. Assuming that a, b, c… are randomly selected spots on the as-prepared fiber, then the Raman intensity could be described by the following equation:45| ISERS = NIL|A(vL)|2|A(vS)|2σRads | (1) |
| Na ≠ Nb ≠ Nc ≠ N… | (2) |
 | ||
| Fig. 4 (A) The SERS spectra of the SERS-active SPME fiber probed with 1.00 × 10⁻⁵ M MG at 20 randomly-selected points. (B) The normalized SERS spectra using the Raman peak of 4-ATP at 1075 cm−1 as reference. The inset images show the changes of the Raman peak of MG at 1174 cm−1. | ||
The adsorbed molecular number, the fluctuation in the Raman spectrometer, the variation of the excitation and the scattered field enhancement factor may vary from spot to spot, therefore it led to the SERS intensity fluctuation.
| ISERS,a ≠ ISERS,b ≠ ISERS,c ≠ ISERS,… | (3) |
Not only the SERS intensity will fluctuate for MG, it may also fluctuate for 4-ATP on the SPME fiber. The RSD of the Raman peak of 4-ATP at 1075 cm−1 was 15.4%. IL, A(vL) and A(vS) are same for MG and 4-ATP on the spots of the fiber. For a specific molecule, σR is a constant, hence:
 | (4) |
Besides, the adsorption process of the molecules in solution could usually be described using the Freundlich isotherm equation:46
| N = kc1/n | (5) |
 | (6) |
The following equation can be obtained from eqn (4) and (6):
| Inormalized = kk1c1/n | (7) |
This suggests that, the Raman intensity ratio of MG to 4-ATP for different spots may be equal in a certain solution.
The SERS spectra of MG were recorded for 10 min under continuous laser radiation with laser power at 200 mW to evaluate the stability of the fiber, as given in Fig. 5. It could be seen that the Raman signals of the SERS-active SPME fiber under continuous laser radiation for 10 min had no obvious change. The RSD value of the intensity of the Raman peak of MG at 1174 cm−1 was 6.8%. The SERS spectra of MG after the fibers being stored in air for 2 months were also recorded, which showed the Raman intensity of MG at 1174 cm−1 only dropped 2.40%, as demonstrated in Fig. S5.† It was suggested that the SERS-active SPME fiber exhibits good stability.
 | ||
| Fig. 5 SERS spectra of the SERS-active SPME fiber probed with 1.00 × 10⁻⁵ M MG under continuous laser radiation. The inset image shows the changes of the Raman peak of MG at 1174 cm−1. | ||
3.4 Optimization of the extraction time
To investigate the extraction ability of the fibers, the fibers were immersed into 1 × 10⁻⁸ M MG solution and the spectra were recorded at regular intervals. The kinetics of MG adsorption can be seen in Fig. S3.† The extraction efficiency increased with increase in extraction time before it reached the adsorption equilibrium. For the solution with 1 × 10⁻⁸ M initial MG concentration, the saturated adsorption time was about 180 min. After 120 min, it was observed that the adsorption process tends to be saturated. When the concentration of the sample increased, the time required to reach the adsorption equilibrium state would also increase. Hence, the extraction time was taken as 120 min in the following experiments.3.5 Qualitative SERS detection of MG
MG is one of the most widely used fungicides in the fish farming and has been banned for its potential animal mutagenicity and teratogenicity.47–49 Therefore, it is important to monitor the concentration of MG. The SERS spectrum of MG on the fiber, the Raman spectrum of the MG solution and the SERS spectrum of the blank fiber were shown in Fig. 6. The SERS spectrum of MG was comparable with the Raman spectrum of MG solution. It suggested that MG had been extracted onto the fiber surface. The Raman spectrum of MG showed characteristic Raman bands at 800, 916, 1174, 1219, 1292, 1396, 1442 cm−1. The peak located at 1442 cm−1 was assigned to in-plane C–C stretching vibration of the ring. The broadened peaks appeared at 1396 cm−1 were attributed to the synergy of in-plane C+–C stretching vibration and N-phenyl stretching. The peak located at 916 cm−1 corresponded to the skeleton vibration of radial aromatic ring. The peaks at 800 and 1174 cm−1 were assigned as the bending vibration of radial aromatic ring in the plane of C–H bond.50 All these peaks were also identified in the SERS spectrum of MG on the fiber, which indicated that MG had been successfully extracted onto the as-prepared SERS-active SPME fiber.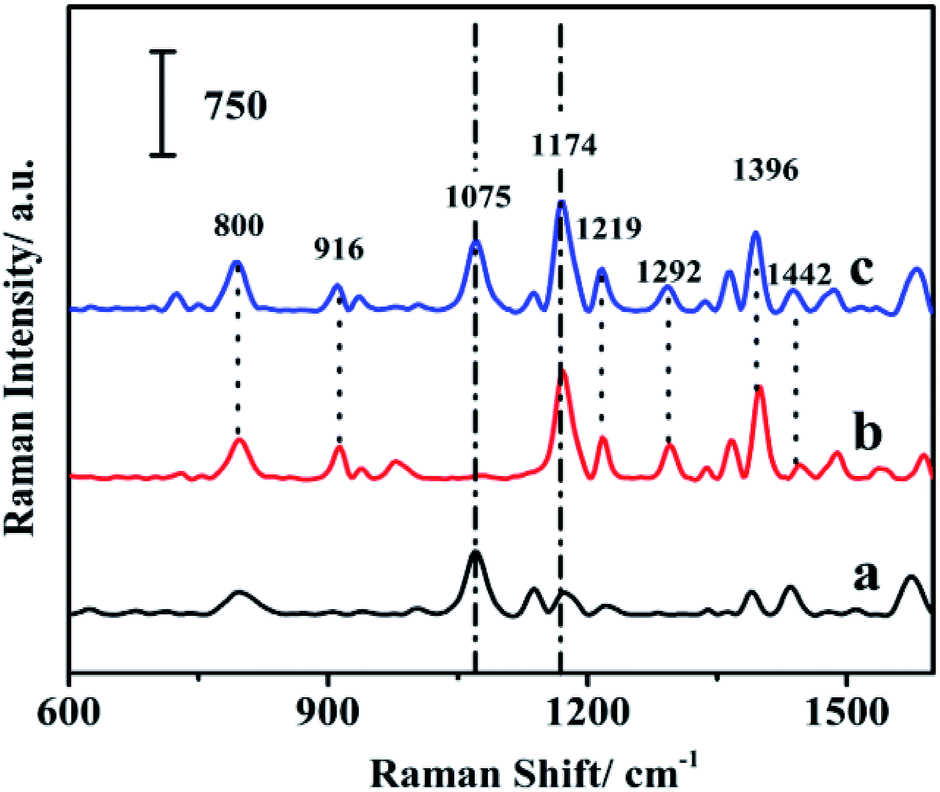 | ||
| Fig. 6 Raman signals of the fiber with internal reference (a); MG solution (b); and MG extracted onto the fiber (c). | ||
The characteristic Raman band of 4-ATP at 1075 cm−1 was chosen as the internal standard Raman peak. The characteristic Raman band of MG at 1174 cm−1 was chosen as the quantitative peak to quantitatively detect MG.
And the enhancement factor (EF) was estimated according to the following formula:
3.6 Quantitative SERS detection of MG
To investigate the quantitative ability of the fibers, the fibers were immersed into the MG solution with concentration range of 1 × 10⁻⁷ M to 5 × 10⁻⁷ M. The laser detection sites were randomly selected on the fibers, which may lead to fluctuation in Raman intensity. As shown in Fig. 7A, the SERS intensity of the MG at 1174 cm−1 increased with an increase in MG concentration. The log–log plot of the Raman intensity of MG at 1174 cm−1 versus its concentration showed a linear relationship as shown in Fig. 7B. The linear equation was y = 10.775 + 1.136x (x is the logarithm of the MG concentration, y is the logarithm of the SERS intensity of the Raman peak at 1174 cm−1), and the correlation coefficient (R2) was found as 0.962. When the peaks were normalized according to the internal reference peak of 4-ATP at 1075 cm−1, the normalized Raman intensity versus the MG concentration showed much better linearity. The correlation coefficient R2 was observed as improved to 0.984 from 0.962. The linear equation was y = 5.691 + 0.772x (x is the logarithm of the MG concentration, y is logarithm of ratio of the SERS intensity of the Raman peak at 1174 and 1075 cm−1). This indicates the importance of using the internal reference method in quantitative measurements. The above results suggest that the internal reference signal can effectively correct the signal fluctuation as a result of the different adsorbed molecular number, the fluctuation in the Raman spectrometer, the variation of the excitation and the scattered field enhancement factor.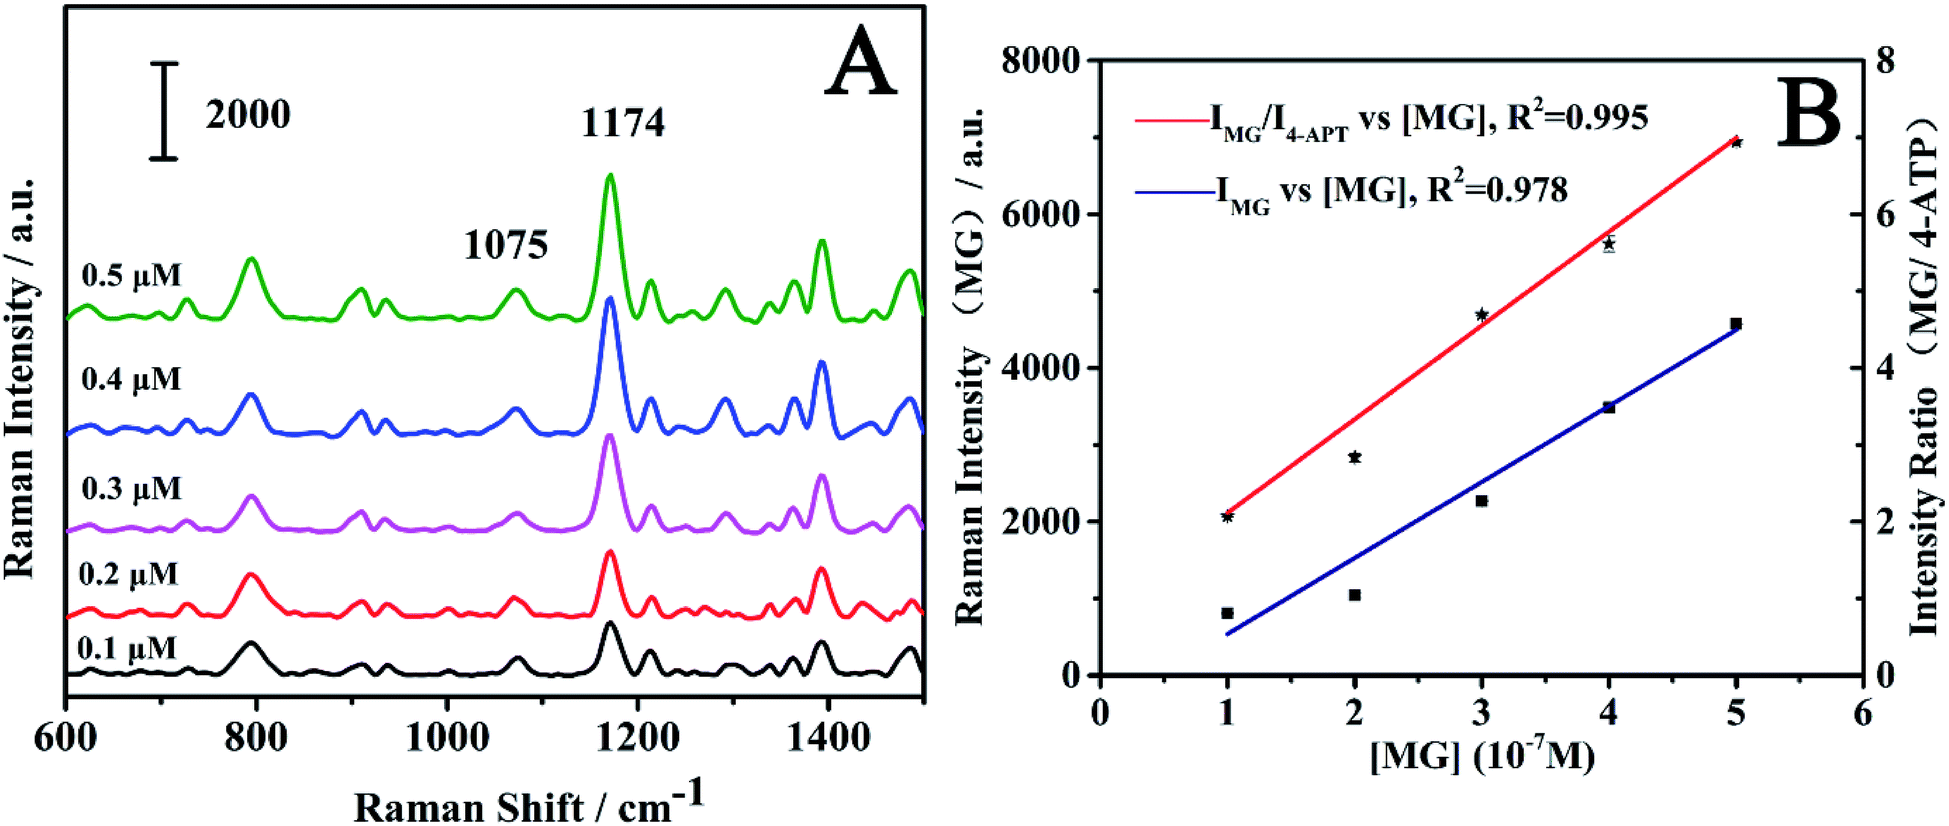 | ||
| Fig. 7 (A) SERS spectra of MG on the fibers with different concentrations; (B) log–log plot of the ratio of peak height of MG (1174 cm−1) and 4-ATP (1075 cm−1) vs. MG concentration (red); log–log plot of peak height of MG (1174 cm−1) vs. MG concentration (blue). The data points were obtained from three parallel measurements at each concentration. | ||
The relationship between the SERS intensity and the adsorbed molecule number can be obtained from eqn (1) and (5):
| ISERS = aN = akc1/n = Kc1/n | (8) |
 | (9) |
From eqn (9), we can know that the good linear relationship of the log–log plot for SERS intensity to analyte concentration is reasonable.
3.7 SERS quantification of MG and CV in aquaculture water
Crystal violet (CV) is another triphenylmethane dye which can cause carcinogenicity in humans.51,52 The detection of CV in aquaculture water was carried out in order to check the ability of the SERS-active SPME fiber for the practical applications. As can be seen from Fig. S4,† the structures of MG and CV are very similar. The characteristic peak of CV was also observed at 1174 cm−1. The MG and CV was dissolved in aquaculture water to prepare various concentrations and then detected by the SERS-active SMPE fibers. The SERS spectra of MG and CV at different concentrations were shown in Fig. 8. The SERS intensity of the analytes at 1174 cm−1 was increased with increase in the concentration. The log–log plot of the Raman intensity of at 1174 cm−1 versus its concentration and the log–log plot of the Raman intensity ratio versus analytes concentration were shown in Fig. 9. As is seen in Fig. 9, the normalized Raman intensity showed better linear relationship with the concentration. And from the results given in Table. S1,† it can be comprehensible that the fiber had better quantitative analysis ability compared to other SERS sensors. In contrast to other methods in Table S2,† this technique showed a comparable detection limit. The above results suggest the advantage of the internal reference method and its feasibility in practical application.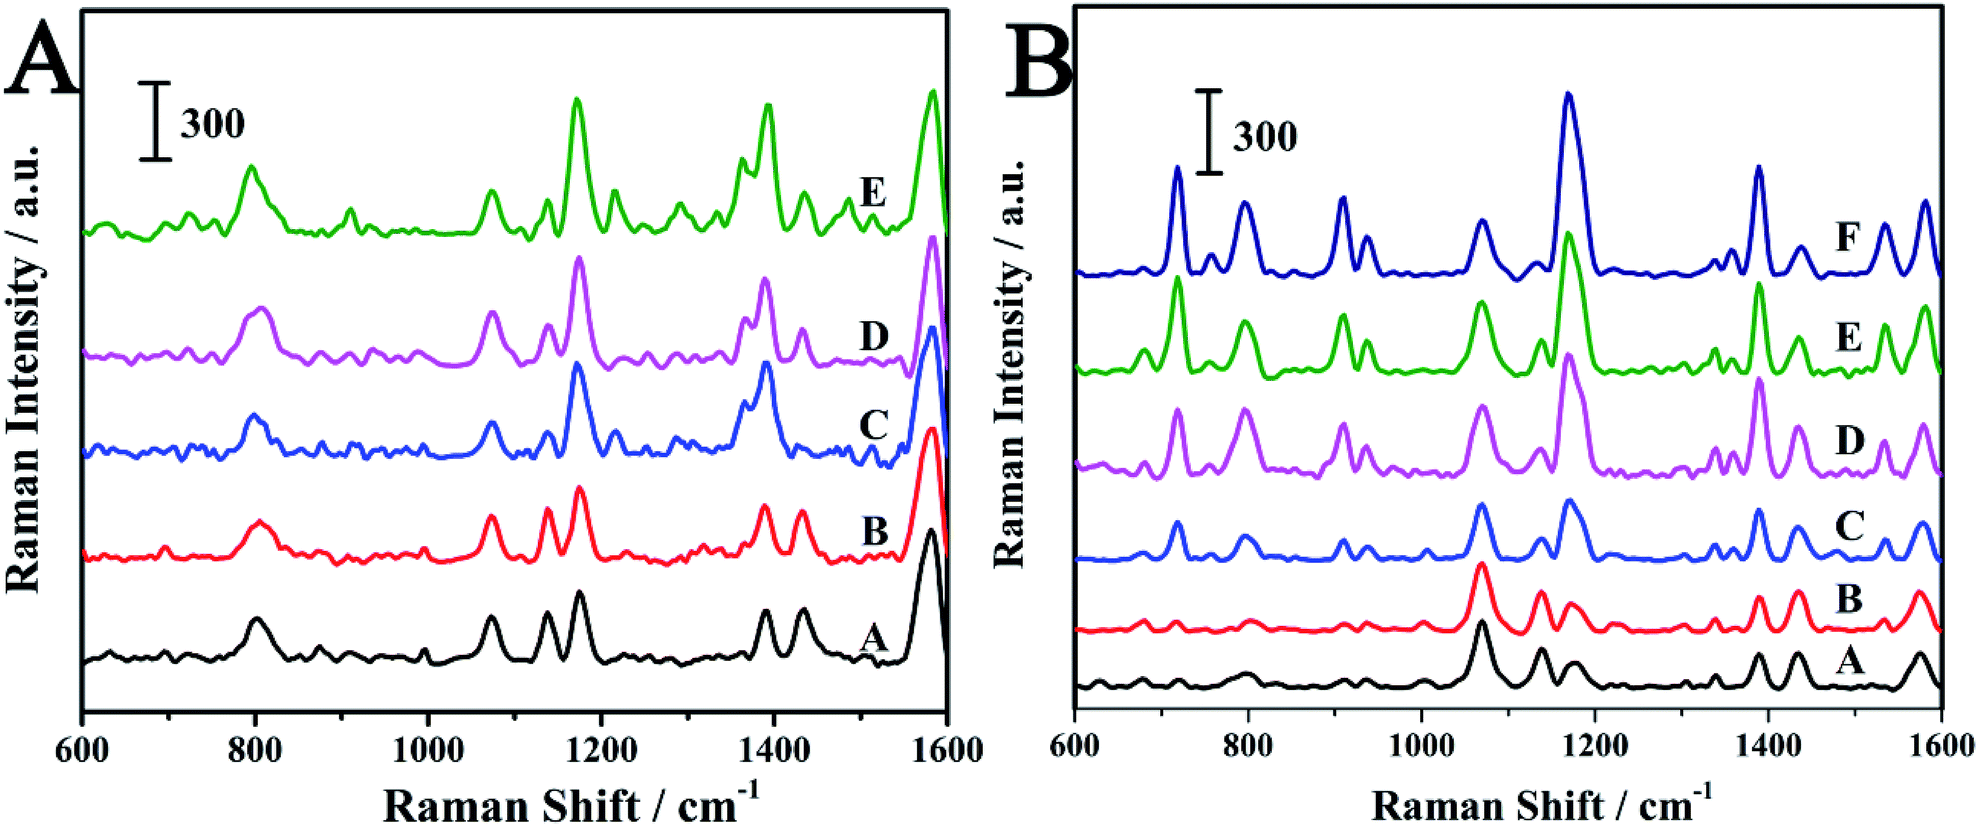 | ||
| Fig. 8 (A) SERS spectra of MG at different concentrations in aquaculture water: (A) 0.5 μM; (B) 1 μM; (C) 2.5 μM; (D) 5 μM; (E) 50 μM. (B) SERS spectra of CV at different concentrations in aquaculture water: (A) 0.05 μM; (B) 0.1 μM; (C) 0.5 μM; (D) 1 μM; (E) 2.5 μM; (F) 5 μM. | ||
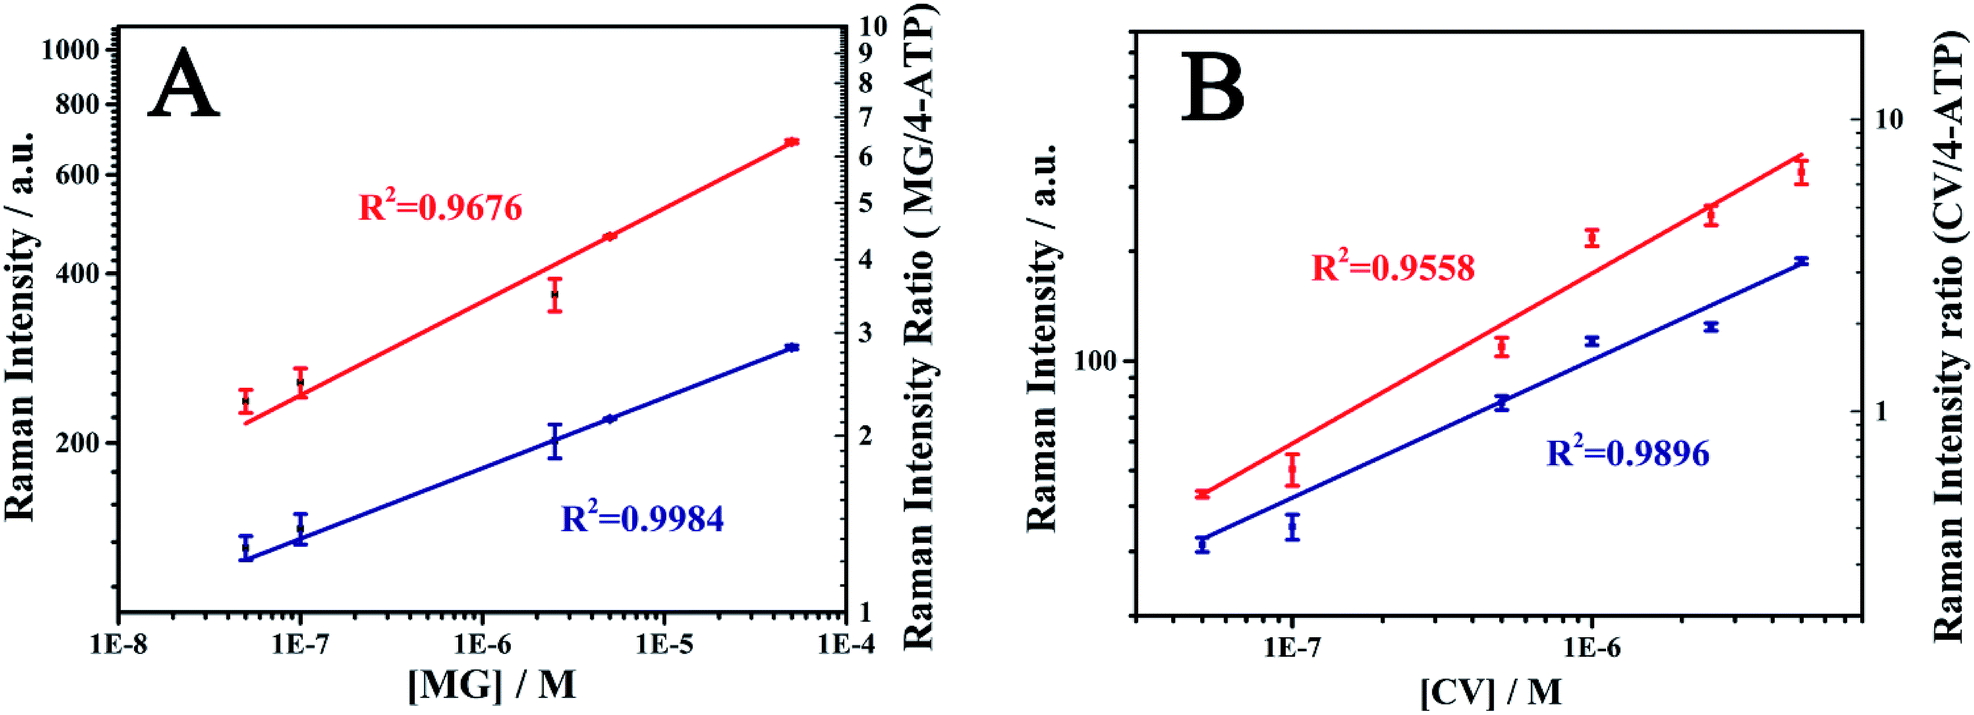 | ||
| Fig. 9 log–log plot for MG (A) and CV (B). The red line showed the Raman intensity vs. concentration; the blue line showed the Raman intensity ratio vs. concentration. The data points were obtained from three parallel measurements at each concentration. | ||
4. Conclusions
In summary, Au@4-ATP@Ag NPs coated ZnO NRs on a stainless steel fiber was prepared as a SERS-active SPME fiber to quantitatively measure the SERS signals of analytes. The prepared SERS-active SPME fiber exhibited good uniformity, stability and extraction ability which indicates its potential for routine analysis. The log–log plot of SERS intensity to MG concentration showed a good linear relationship and the R2 before and after the normalization was 0.962 and 0.984, respectively. The results indicated that the internal reference signal can effectively correct the signal fluctuation, which provides a reliable quantitative SERS analysis. The quantitative detection of CV in aquaculture water was also demonstrated for the practical applications. In the concentration range of 5 × 10⁻⁸ M to 5 × 10⁻⁶ M, the R2 after normalization was 0.990 with the detection limit of 1.9 × 10⁻⁹ M (S/N = 3). From the above results, it can be concluded that the SERS-active SPME fiber reported in this work provided a new method for on-site quantitative SERS measurements.Acknowledgements
We are grateful for the financial support from the National Basic Research Program of China (973 Program 2013CB934301), the National Natural Science Foundation of China (NSFC21377068, 21575077), the Natural Science Foundation of Shandong Province of China (no. ZR2014BM033) and the Fundamental Research Funds of Shandong University (2016JC030).Notes and references
- C. Baronti, R. Curini, G. D'Ascenzo, A. Di Corcia, A. Gentili and R. Samperi, Environ. Sci. Technol., 2000, 34, 5059–5066 CrossRef CAS.
- L. H. Santos, A. N. Araújo, A. Fachini, A. Pena, C. Delerue-Matos and M. Montenegro, J. Hazard. Mater., 2010, 175, 45–95 CrossRef CAS PubMed.
- C. Tixier, H. P. Singer, S. Oellers and S. R. Müller, Environ. Sci. Technol., 2003, 37, 1061–1068 CrossRef CAS PubMed.
- M. d. F. Alpendurada, J. Chromatogr. A, 2000, 889, 3–14 CrossRef CAS PubMed.
- C. L. Arthur and J. Pawliszyn, Anal. Chem., 1990, 62, 2145–2148 CrossRef CAS.
- H. Lord and J. Pawliszyn, J. Chromatogr. A, 2000, 885, 153–193 CrossRef CAS PubMed.
- X. Yu, H. Yuan, T. Górecki and J. Pawliszyn, Anal. Chem., 1999, 71, 2998–3002 CrossRef CAS PubMed.
- O. Pinho, I. Ferreira and M. Ferreira, Anal. Chem., 2002, 74, 5199–5204 CrossRef CAS PubMed.
- S. Li and S. G. Weber, Anal. Chem., 1997, 69, 1217–1222 CrossRef CAS.
- W. M. Mullett, K. Levsen, J. Borlak, J. Wu and J. Pawliszyn, Anal. Chem., 2002, 74, 1695–1701 CrossRef CAS PubMed.
- D. L. Heglund and D. C. Tilotta, Environ. Sci. Technol., 1996, 30, 1212–1219 CrossRef CAS.
- S. A. Merschman, S. H. Lubbad and D. C. Tilotta, J. Chromatogr. A, 1998, 829, 377–384 CrossRef CAS.
- D. A. Long, Raman spectroscopy, New York, 1977, pp. 1–12 Search PubMed.
- B. L. Wittkamp and D. C. Tilotta, Anal. Chem., 1995, 67, 600–605 CrossRef CAS.
- D. Li, L. Qu, W. Zhai, J. Xue, J. S. Fossey and Y. Long, Environ. Sci. Technol., 2011, 45, 4046–4052 CrossRef CAS PubMed.
- Y.-T. Li, L.-L. Qu, D.-W. Li, Q.-X. Song, F. Fathi and Y.-T. Long, Biosens. Bioelectron., 2013, 43, 94–100 CrossRef CAS PubMed.
- D.-W. Li, W.-L. Zhai, Y.-T. Li and Y.-T. Long, Microchim. Acta, 2014, 181, 23–43 CrossRef CAS.
- M. Odziemkowski, J. A. Koziel, D. E. Irish and J. Pawliszyn, Anal. Chem., 2001, 73, 3131–3139 CrossRef CAS PubMed.
- C. J. Constantino, T. Lemma, P. A. Antunes and R. Aroca, Anal. Chem., 2001, 73, 3674–3678 CrossRef CAS PubMed.
- S. Nie and S. R. Emory, Science, 1997, 275, 1102–1106 CrossRef CAS PubMed.
- J. Tsang, J. Kirtley and J. Bradley, Phys. Rev. Lett., 1979, 43, 772 CrossRef CAS.
- S. S. Dasary, A. K. Singh, D. Senapati, H. Yu and P. C. Ray, J. Am. Chem. Soc., 2009, 131, 13806–13812 CrossRef CAS PubMed.
- L. Guerrini, J. V. Garcia-Ramos, C. Domingo and S. Sanchez-Cortes, Anal. Chem., 2009, 81, 1418–1425 CrossRef CAS PubMed.
- F. Inscore, C. Shende, A. Sengupta, H. Huang and S. Farquharson, Appl. Spectrosc., 2011, 65, 1004–1008 CrossRef CAS PubMed.
- R. M. Jarvis and R. Goodacre, Chem. Soc. Rev., 2008, 37, 931–936 RSC.
- D. Li, D.-W. Li, J. S. Fossey and Y.-T. Long, Anal. Chem., 2010, 82, 9299–9305 CrossRef CAS PubMed.
- M. Lin, L. He, J. Awika, L. Yang, D. R. Ledoux, H. a. Li and A. Mustapha, J. Food Sci., 2008, 73, T129–T134 CrossRef CAS PubMed.
- R. J. Stokes, E. McBride, C. G. Wilson, J. M. Girkin, W. E. Smith and D. Graham, Appl. Spectrosc., 2008, 62, 371–376 CrossRef CAS PubMed.
- B. Li, Y. E. Shi, J. Cui, Z. Liu, X. Zhang and J. Zhan, Anal. Chim. Acta, 2016, 923, 66–73 CrossRef CAS PubMed.
- C. Liu, X. Zhang, L. Li, J. Cui, Y. E. Shi, L. Wang and J. Zhan, Analyst, 2015, 140, 4668–4675 RSC.
- S. Zhu, X. Zhang, J. Cui, Y. E. Shi, X. Jiang, Z. Liu and J. Zhan, Analyst, 2015, 140, 2815–2822 RSC.
- S. M. Stranahan and K. A. Willets, Nano Lett., 2010, 10, 3777–3784 CrossRef CAS PubMed.
- H. Xu, E. J. Bjerneld, M. Käll and L. Börjesson, Phys. Rev. Lett., 1999, 83, 4357 CrossRef CAS.
- S. E. Bell and N. M. Sirimuthu, Chem. Soc. Rev., 2008, 37, 1012–1024 RSC.
- Y. Zhou, R. Ding, P. Joshi and P. Zhang, Anal. Chim. Acta, 2015, 874, 49–53 CrossRef CAS PubMed.
- G. Frens, Nature, 1973, 241, 20–22 CAS.
- Z. Chen, D. Yu, Y. Huang, Z. Zhang, T. Liu and J. Zhan, Sci. Rep., 2014, 4, 6709 CrossRef CAS PubMed.
- L. E. Greene, M. Law, D. H. Tan, M. Montano, J. Goldberger, G. Somorjai and P. Yang, Nano Lett., 2005, 5, 1231–1236 CrossRef CAS PubMed.
- R. Alizadeh, N. M. Najafi and S. Kharrazi, Anal. Chim. Acta, 2011, 689, 117–121 CrossRef CAS PubMed.
- P. Chen, L. Gu, X. Xue, Y. Song, L. Zhu and X. Cao, Mater. Chem. Phys., 2010, 122, 41–48 CrossRef CAS.
- D. J. Djozan and L. Abdollahi, Chromatographia, 2003, 57, 799–804 CAS.
- W. Shen, X. Lin, C. Jiang, C. Li, H. Lin, J. Huang, S. Wang, G. Liu, X. Yan, Q. Zhong and B. Ren, Angew. Chem., 2015, 54, 7308–7312 CrossRef CAS PubMed.
- M. Osawa, N. Matsuda, K. Yoshii and I. Uchida, J. Phys. Chem., 1994, 98, 12702–12707 CrossRef CAS.
- Y.-F. Huang, H.-P. Zhu, G.-K. Liu, D.-Y. Wu, B. Ren and Z.-Q. Tian, J. Am. Chem. Soc., 2010, 132, 9244–9246 CrossRef CAS PubMed.
- K. Kneipp, H. Kneipp, I. Itzkan, R. R. Dasari and M. S. Feld, Chem. Rev., 1999, 99, 2957–2976 CrossRef CAS PubMed.
- J. Collip, Can. Med. Assoc. J., 1925, 15, 448 Search PubMed.
- A. Afkhami, R. Moosavi and T. Madrakian, Talanta, 2010, 82, 785–789 CrossRef CAS PubMed.
- M. Oplatowska, R. F. Donnelly, R. J. Majithiya, D. Glenn Kennedy and C. T. Elliott, Food Chem. Toxicol., 2011, 49, 1870–1876 CrossRef CAS PubMed.
- S. Srivastava, R. Sinha and D. Roy, Aquat. Toxicol., 2004, 66, 319–329 CrossRef CAS PubMed.
- E. Liang, X. Ye and W. Kiefer, J. Phys. Chem. A, 1997, 101, 7330–7335 CrossRef CAS.
- C. Diamante, W. F. Bergfeld, D. V. Belsito, C. D. Klaassen, J. G. Marks, R. C. Shank, T. J. Slaga, P. W. Snyder and F. A. Andersen, Int. J. Toxicol., 2009, 28, 193S–204S CrossRef CAS PubMed.
- I. Šafařík and M. Šafaříková, Water Res., 2002, 36, 196–200 CrossRef.
Footnote |
| † Electronic supplementary information (ESI) available. See DOI: 10.1039/c7ra03164e |
| This journal is © The Royal Society of Chemistry 2017 |