 Open Access Article
A direct four-electron process on Fe–N3 doped graphene for the oxygen reduction reaction: a theoretical perspective†
Xiaowan Baiac,
Erjun Zhao *a,
Wencheng Wang*b,
Ying Wangc,
Kai Lic,
Lin Lina,
Jucai Yangd,
He Sune and
Zhijian Wu*c
aCollege of Science, Inner Mongolia Key Laboratory of Theoretical Chemistry Simulation, Inner Mongolia University of Technology, Hohhot 010051, P. R. China. E-mail: ejzhao@yahoo.com
bRadiotherapy Laboratory, Jilin Cancer Hospital, Changchun 130012, P. R. China. E-mail: wencheng.w@163.com
cState Key Laboratory of Rare Earth Resource Utilization, Changchun Institute of Applied Chemistry, Chinese Academy of Sciences, Changchun 130022, P. R. China. E-mail: zjwu@ciac.ac.cn
dSchool of Energy and Power Engineering, Inner Mongolia University of Technology, Hohhot 010051, P. R. China
eThe Computing Center of Jilin Province, Changchun 130012, P. R. China
First published on 3rd May 2017
Abstract
As one of the potential candidates for electrocatalysis, non-precious transition metal and nitrogen co-doped graphene has attracted extensive attention in recent years. A deep understanding of the oxygen reduction reaction (ORR) mechanism including the specific active sites and reaction pathways will contribute to the further enhancement of the catalytic activity. In this study, the reaction mechanism for ORR on Fe–N3 doped graphene (Fe–N3-Gra) is investigated theoretically. Our results show that Fe–N3-Gra is thermodynamically stable. The ORR elementary reactions take place within a small region around the Fe–N3 moiety and its adjacent six C atoms. HOOH does not exist on the catalyst surface, indicating a direct four-electron process for Fe–N3-Gra. The kinetically most favorable pathway is O2 hydrogenation, in which the formation of the second H2O is the rate-determining step with an energy barrier of 0.87 eV. This value is close to 0.80 eV for pure Pt, suggesting that Fe–N3-Gra could be a potential electrocatalyst. Free energy changes at different electrode potentials are also discussed.
1. Introduction
Fuel cells (FCs) have attracted worldwide attention because of their high energy conversion efficiency, high power density, and low emission.1 The electrochemical performance of a fuel cell largely relies on the oxygen reduction reaction (ORR) at the cathode which determines the efficiencies of the energy conversion and storage. The ORR is, however, sluggish and thus a highly efficient cathode catalyst is required.2,3 Up to now, the most effective cathode catalysts for the ORR have been the Pt-based catalysts.4–6 Nonetheless, their large-scale commercial applications are limited by high cost, poor CO tolerance, and low durability and stability.7 Therefore, alternative materials that are earth-abundant, cost-effective and have high catalytic activities comparable to or higher than those of Pt-based catalysts are in demand. In this aspect, the pioneering work was done by Jasinski in 1964, which reported that the cobalt phthalocyanine could be used as catalyst for oxygen reduction.8 Based on this idea, in recent years, the transition metal-coordinated (e.g., Fe, Co and Mn) nitrogen-doped carbon matrix (M–Nx–C) electrocatalysts for the ORR have been studied extensively as promising alternatives to Pt-based catalysts in experiments.9–18 The non-precious metal catalysts derived from polyaniline, iron, and cobalt show high catalytic activity with remarkable performance and stability as well as excellent four-electron selectivity (hydrogen peroxide yield <1.0%).9 The current density of the cathode made with the microporous Fe–Nx–C catalyst could be equal to that of a Pt-based cathode at a cell voltage of larger than 0.9 V.10 The Co–Nx co-doped graphene has comparable ORR performance to the commercial Pt–C electrocatalysts.13 The Mn-doped glycine-derived carbon catalyst has a high catalytic activity for the ORR and low half-wave potential than that of commercial Pt–C.17 Furthermore, theoretical studies have been also available for M–Nx–C electrocatalysts for the ORR19–23 and these studies revealed that they possess high catalytic activity for the ORR.Among the M–Nx–C catalytic systems, Fe–Nx–C electrocatalysts are studied most both experimentally9–12,18,24–27 and theoretically.19,20,28–32 In-depth structure-to-property relation presents an evidence that Fe–Nx centers are the active sites playing a key role in oxygen reduction reaction.11 Indeed, Fe–N4 moiety as the catalytic active site was observed by diverse experimental studies.24,33,34 The atomic structure of highly active Fe–N4-Gra has been analyzed by X-ray absorption spectroscopy24 and high-resolution transmission electron microscopy.35 The current density of ORR to the number of in-plane Fe–N4 centers was identified using Mӧssbauer spectra.33 Theoretical studies also confirmed that Fe–N4 doped graphene has high catalytic activity for ORR comparable to that of Pt catalyst with Fe–N4 moiety as active sites.19,20,31 The most favorable reaction pathway for Fe–N4 doped graphene is a four-electron OOH dissociation process.20 Besides Fe–N4, Fe–N3 doped carbon matrix has been also studied for ORR in the pyrolyzed catalyst.11,12 The experimental study suggests that the Fe–N3 doped graphene also exhibits high ORR activity, high stability, and low H2O2 production.36 Theoretical studies revealed that the Fe–N3 doped graphene is thermodynamically stable with the negative formation energy.30,37 Clustered Fe–N3 structures can cleave the O–O bond very easily.29 However, up to date, the catalytic activity and the detailed mechanism for ORR remain unclear for Fe–N3–C catalysts. In particular, for Fe–N4 doped graphene, direct four-electron process is observed for ORR both experimentally12 and theoretically.20 For Fe–N3 doped graphene, however, it is not clear whether it catalyzes the four-electron direct reduction of O2 molecule to water or also catalyzes the second step HOOH reduction to water through a two-electron process.12 Therefore, it is highly necessary to unravel the physical insights of Fe–N3 doped graphene from the atomic and electronic point of view. To achieve this goal, the catalytic active sites and the reaction pathways for Fe–N3 doped graphene have been studied by using the density functional theory (DFT) in this work.
2. Computational details
2.1 Methods
All spin-polarized DFT38,39 calculations were performed using the Vienna ab initio simulation package (VASP).40,41 The interactions between valence electrons and frozen cores were described by the projector augmented wave (PAW) method.42 The electronic exchange–correlation energy was treated by the generalized gradient approximation of the Perdew–Burke–Ernzerhof (PBE) functional.43 The kinetic energy cutoff was set to be 400 eV for the plane-wave expansion. A 5 × 5 × 1 Monkhorst–Pack grid was used to provide sufficient accuracy in the integration of the Brillouin zone.44 The transition state (TS) searches were performed by employing the climbing image nudged elastic band (CI-NEB) method,45 and was confirmed by only one imaginary frequency on the potential energy surface. For geometry optimizations and TS searches, the convergence tolerances of the electronic and ionic iterations were set to 10−5 eV and 0.05 eV Å−1, respectively. The van-der-Waals (vdW) interactions were considered by using the semiempirical scheme proposed by DFT-D2 method of Grimme46,47 in all of the calculations.Free energy calculation of each elementary reaction on the Fe–N3-Gra surface was performed based on computational hydrogen electrode (CHE) model suggested by Nørskov et al.48 The computational detail of the free energy change (ΔG) is as follows:
| ΔG = ΔE + ΔZPE − TΔS + ΔGpH + ΔGU | (1) |
![[thin space (1/6-em)]](https://www.rsc.org/images/entities/char_2009.gif) 10 × pH, where kB is the Boltzmann constant and T = 300 K. pH = 0 is assumed for acidic medium. ΔGU = −neU, where n is the number of transferred electrons and U is the electrode potential. In acidic environment, the U values range from 0 to 1.23 V.48
10 × pH, where kB is the Boltzmann constant and T = 300 K. pH = 0 is assumed for acidic medium. ΔGU = −neU, where n is the number of transferred electrons and U is the electrode potential. In acidic environment, the U values range from 0 to 1.23 V.48
2.2 Models
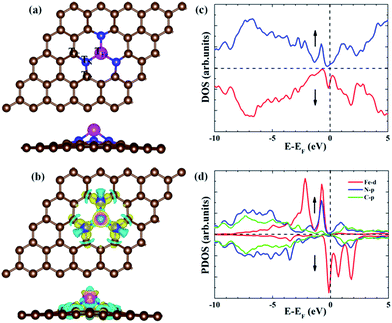
A 5 × 5 hexagonal supercell of graphene (containing 50 atoms) with Fe–N3 coordinated structure (Fig. 1a) was built based on the experimental studies.11,12 The lattice parameters were a = b= 12.3 Å, and the graphene sheets were separated by a 15 Å vacuum layer along the c direction to avoid interactions between periodic images. All atoms were allowed to relax during the geometry optimization. To check the stability of Fe–N3-Gra, the formation energy was calculated as:| ΔEf = EFe–N3-Gra + 4μC − (EGra + 3μN + μFe) | (2) |
The adsorption energy (ΔEads) was calculated as:
| ΔEads = Eadsorbate/Fe–N3-Gra − (Eadsorbate + EFe–N3-Gra) | (3) |
3. Results and discussion
3.1 Structure and electronic properties of Fe–N3-Gra
Compared with the formation energy of −0.95 eV from Kattel et al.37 and −1.0 eV from Kabir et al.,30 our calculated formation energy for Fe–N3-Gra is −1.66 eV, slightly larger than the previous results due to the different model system and the consideration of the Van der Waals interactions in this work. The electronic density of states (DOS) (Fig. 1c) suggests that Fe atom has a finite density of states at the Fermi energy level, implying the metallic character for Fe–N3-Gra. The partial density of states (PDOS) shows that there is a strong hybridization between the 2p orbital of N atom and the 3d orbital of Fe atom near the Fermi energy level (−1.5 to 0 eV, Fig. 1d). At the lower energy level (<−1.5 eV), the DOS is mainly contributed by the strong hybridization between the 2p orbital of N atom and the 2p orbital of C atom. These results suggest that the electronic interaction leads to the bond formation of N–Fe and N–C, resulting in lower formation energy for Fe–N3-Gra, similar to the previous study.37 Bader charge analysis reveals that Fe atom has positive charge 0.96 |e| for clean Fe–N3-Gra (Table 1). The three nitrogen atoms are negatively charged by −3.59 |e|. The total charges of the six carbon atoms bonding to the nitrogen atoms are positively charged by 2.45 |e|. These results reveal that due to the different electronegativity of doping atoms and carbon, the local electroneutrality is broken and charge transfer occurs. The small net charge −0.18 |e| between Fe–N3 moiety and its adjacent six carbon atoms suggests that the small region around Fe–N3 moiety and its adjacent six carbon atoms can be served as the catalytic active center for ORR on the Fe–N3-Gra surface. This is in agreement with the charge density difference (Fig. 1b). Hence, the possible adsorption sites for the ORR intermediates are the top sites of the Fe, N and C atoms, namely TFe, TN and TC, as shown in Fig. 1a.| dFe–O | dO–O | Q(Fe) | Q(N3) | Q(C-total) | Q(ads) | NC | |
|---|---|---|---|---|---|---|---|
| FeN3 | — | — | 0.96 | −3.59 | 2.45 | 0.00 | −0.18 |
| Side-on O2 | 1.82(1.83) | 1.42(1.44) | 1.22 | −3.44 | 2.58 | −0.80 | −0.44 |
| End-on O2 | 1.69(1.70) | 1.30(1.34) | 1.14 | −3.53 | 2.88 | −0.62 | −0.13 |
| 2O | 1.63(1.66) | 2.65(2.60) | 1.40 | −3.43 | 2.92 | −1.23 | −0.34 |
| O | 1.60(1.62) | — | 1.15 | −3.42 | 2.78 | −0.65 | −0.14 |
| H | — | — | 1.07 | −3.62 | 2.97 | −0.42 | 0.00 |
| OH | 1.76(1.79) | — | 1.15 | −3.41 | 2.39 | −0.51 | −0.38 |
| OOH | 1.84(1.86) | 1.49(1.50) | 1.25 | −3.63 | 2.61 | −0.59 | −0.36 |
| 2OH | 1.82(1.86) | 2.67(2.64) | 1.38 | −3.50 | 2.72 | −1.00 | −0.40 |
| H2O | 2.11(2.03) | — | 1.06 | −3.65 | 2.89 | 0.06 | 0.36 |
3.2 Adsorption of the ORR intermediates on the Fe–N3-Gra
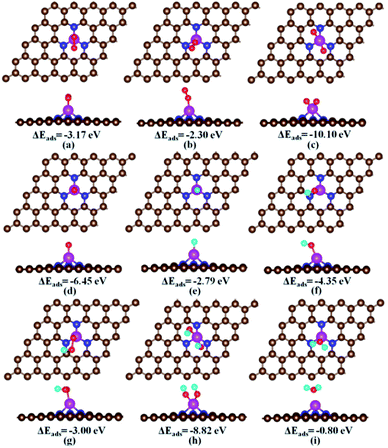
For each ORR intermediate i.e., O2, O + O, H, O, OH, OOH, HOOH, and H2O, we optimized its various possible adsorption configurations at different adsorption sites on the Fe–N3-Gra. The obtained stable adsorption structures and adsorption energies are shown in Fig. S1, ESI.† The most stable adsorption structures and energies are summarized in Fig. 2 and Table 2, respectively.| O2 | O | OH | OOH | H2O | |
|---|---|---|---|---|---|
| a Ref. 50, doped in carbon nanotube.b Ref. 32.c Ref. 19.d Ref. 20.e Ref. 51.f Ref. 52.g Side-on configuration, this work.h End-on configuration, this work. | |||||
| Fe–N3 | −3.17g/−2.30h | −6.45 | −4.35 | −3.00 | −0.80 |
| Fe–N3-sol | (−3.11g/−2.32h) | (−6.35) | (−4.05) | (−2.68) | (−0.83) |
| Fe–N3a | −2.45 | — | — | — | — |
| Fe–N2b | −1.78 | −5.12 | −3.25 | −2.08 | −0.33 |
| Fe–N4c | −0.95 | −4.37 | −2.94 | −1.87 | −0.48 |
| Fe–N4d | −0.98 | −4.35 | −2.80 | −1.76 | −0.18 |
| Fe-phthalocyaninee | −1.16 | — | −3.41 | — | −1.05 |
| Pt(111)f | −0.62 | −4.30 | −2.21 | −0.94 | −0.20 |
| Pt(100)f | −1.10 | −4.38 | −2.77 | −1.30 | −0.25 |
The favorable adsorption of the O2 molecule on the Fe–N3-Gra is the prerequisite for ORR to proceed. For O2 adsorption, we obtained two adsorption configurations, that is, side-on and end-on. In the side-on configuration (Fig. 2a), the adsorbed O2 molecule is parallel to the catalyst surface and forms two equal bond distances with Fe atom (Fe–O: 1.82 Å). The adsorption energy of −3.17 eV is stronger than that of −2.45 eV in Fe–N3 doped carbon nanotube.50 Upon adsorption, the O–O bond length is elongated to 1.42 Å compared with 1.22 Å in the free gas phase O2, and the charge transfer from Fe–N3-Gra to O2 is −0.80 |e|, which indicates that a chemisorption exists between O2 and Fe–N3-Gra. This would facilitate the O2 dissociation. For the end-on configuration (Fig. 2b), only one O atom bonds to the Fe atom with Fe–O bond distance 1.69 Å, while the other O atom is pointing away from the catalyst surface. Its adsorption energy is −2.30 eV, smaller than −3.17 eV for side-on configuration. The O–O bond length and charge transfer of end-on O2 are 1.30 Å and −0.62 |e|, respectively. As the final state for O2 dissociation, the two separated O atoms are co-adsorbed at top Fe site (Fig. 2c) with an energy of −10.10 eV. The charge transfer −1.23 |e| is nearly two times of the single O atom of −0.65 |e|. The adsorption energy of single O atom is −6.45 eV, which is the strongest among the studied single ORR intermediates, similar to the previous studies.19,20,32
For hydrogen-containing intermediates (Fig. 2e–g), the most favorable adsorption site of H, OH, and OOH is the top Fe site with the adsorption energies of −2.79 eV, −4.35 eV, and −3.00 eV, respectively. For H atom, the second most favorable adsorption site is on the C atoms adjacent to N atoms with an adsorption energy of −1.50 eV (Fig. S1†). Since the top Fe site is always occupied by O-containing species during the reaction, the C atoms adjacent to N atoms are the primary active site for the adsorption of hydrogen in the hydrogenation reaction. For H2O, the adsorption energy is −0.80 eV. The charge transfer from Fe–N3-Gra to H2O is 0.06 |e| with relatively long Fe–O distance of 2.11 Å (Fig. 2i), indicating that it might be desorbed easily from the Fe–N3-Gra surface once it is formed.
For the HOOH species, the DFT study shows that it does not exist and is decomposed into either O + H2O or OH + OH configurations. Quantum Chemical Molecular dynamics study confirmed this point (details concerning the computational method and corresponding results are presented in ESI†). The cleavage of O–O bond is observed at very short time (Fig. 3). Both O + H2O and OH + OH configurations are observed depending on the different initial parameters. Therefore, the direct four-electron process occurs on the Fe–N3-Gra surface.
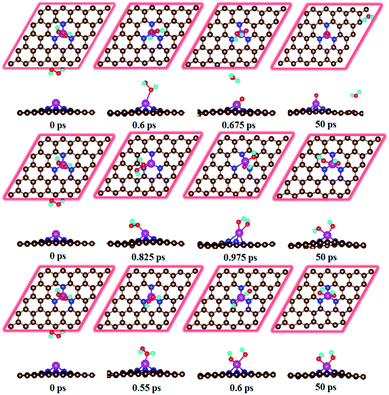 | ||
| Fig. 3 Evolution of molecular dynamic simulations of the HOOH species without adsorbing (dFe–O = 5 Å) on the Fe–N3-Gra surface at 300 K. | ||
3.3 ORR mechanism on the Fe–N3-Gra
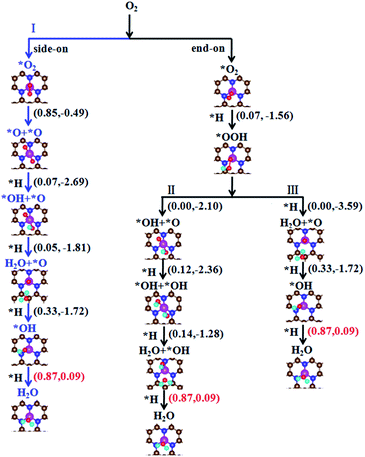
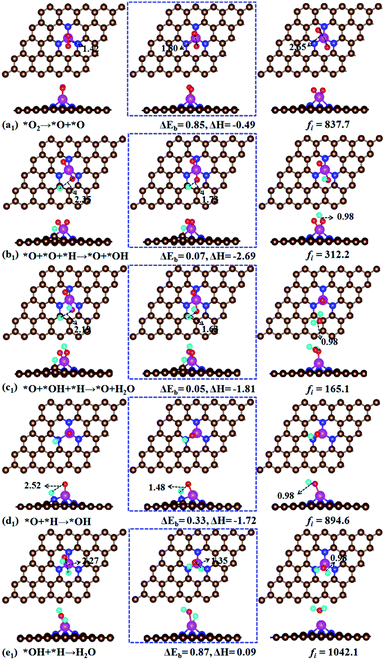
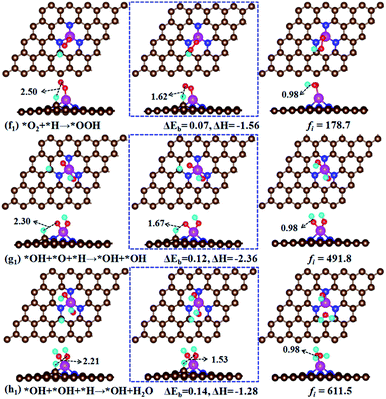
As mentioned above, the adsorption of O2 molecule is the first step to initialize the ORR on the catalyst. Upon the O2 adsorption, the ORR would proceed through two possible reaction pathways, i.e., O2 dissociation and O2 hydrogenation, as shown in Fig. 4. We will introduce these reaction pathways in the following.In a word, the four-electron ORR on the Fe–N3-Gra surface could proceed through three possible reaction pathways (Fig. 4). The rate-determining step in the three possible pathways is the formation of the second H2O, i.e., OH + H → H2O. The energy barrier of 0.87 eV, smaller than 0.56 eV (ref. 20) and 0.62 eV (ref. 19) for Fe–N4 doped graphene, but close to 0.80 eV for pure Pt(111).53 For Fe–N4-Gra, the two-electron ORR is observed because HOOH species could be stably adsorbed on catalyst surface.19 However, the HOOH species will be decomposed immediately on Fe–N3-Gra surface, suggesting a four-electron pathway. This suggests that the Fe–N3-Gra could be a high performance catalyst for ORR. The obtained three pathways are competitive for the most favorable pathway, with the pathway of O2 hydrogenation being slightly favored.
3.4 Effect of electrode potentials on the ORR
Since all of the above results are obtained under zero electrode potential, while in reality, electrochemical ORR at the electrode occurs under positive potentials, we studied the effect of the electrode potentials on the free energy of ORR on Fe–N3-Gra. The free energy diagrams for three possible pathways are given in Fig. 7 based on the method of Nørskov et al.48 For the three pathways, all of the reduction steps except the OH reduction to H2O are downhill at zero potential. The endothermic process for the second H2O formation is due to the strong adsorption of OH (−4.35 eV, Table 2) on the catalyst surface. For pathways I and III, the another step, i.e., O + H2O + H → OH + H2O becomes uphill at potential larger than 0.22 V. A similar trend is observed after the solvent effect is considered (Fig. 7, dotted lines in the bottom panel).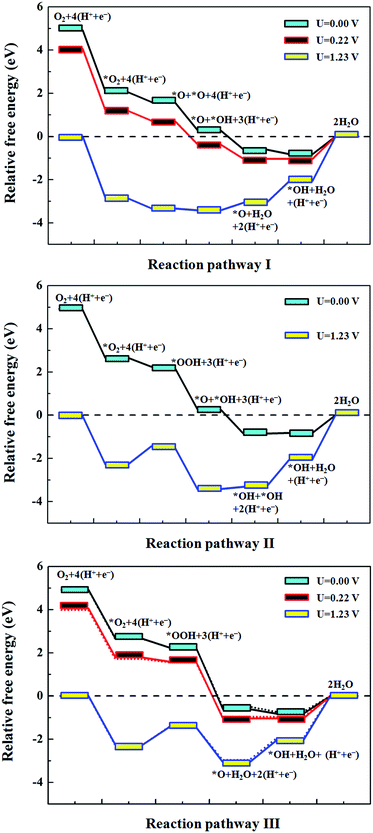 | ||
| Fig. 7 The free energy diagrams for the reduction of O2 to H2O at different electrode potentials U. pathway I, O2 dissociation; pathway II, OOH dissociation and pathway III, OOH hydrogenation; see also Fig. 4 for the detailed reaction pathways. The dotted lines in the bottom panel denote the results from the solvent environment. | ||
4. Conclusions
Fe–N3 doped graphene (Fe–N3-Gra) is energetically stable. Fe–N3 moiety and its six adjacent C atoms are the catalytic active sites for the oxygen reduction reaction on the catalyst surface. Both DFT and molecular dynamics studies indicate that HOOH does not exist on the catalyst surface, implying the direct four-electron process for Fe–N3-Gra. O2 dissociation and O2 hydrogenation are competitive for the most favorable pathway, in which the pathway of O2 hydrogenation is slightly favored. For these pathways, the rate-determining step is the formation of the second H2O, i.e., OH + H → H2O, with an energy barrier of 0.87 eV. Due to the strong adsorption of OH on the catalyst surface, the endothermic process is observed for the second H2O formation at zero potential.Acknowledgements
This work is supported by the National Natural Science Foundation of China (21503210, 21673220, 21261013), Jilin Province Natural Science Foundation (20150101012JC), the Program for Young Talents of Science and Technology in Universities of Inner Mongolia Autonomous Region (NJYT-15-B16), the Program for Innovative Research Team in Universities of Inner Mongolia Autonomous Region (NMGIRT-A1603), the Natural Science Foundation of Inner Mongolia Autonomous Region (Grant No. 2015MS0120 and 2011BS0104), and the Key Science Research Project of Inner Mongolia University of Technology (Grant No. ZD201517 and ZD201117). The computing time is supported by the High Performance Computing Center of Jilin University, Changchun Normal University, and Jilin Province Supercomputing Center.References
- B. C. H. Steele and A. Heinzel, Nature, 2001, 414, 345–352 CrossRef CAS PubMed.
- X. Xu, T. Yuan, Y. K. Zhou, Y. W. Li, J. M. Lu, X. H. Tian, D. L. Wang and J. Wang, Int. J. Hydrogen Energy, 2014, 39, 16043–16052 CrossRef CAS.
- J. Snyder, T. Fujita, M. W. Chen and J. Erlebacher, Nat. Mater., 2010, 9, 904–907 CrossRef CAS PubMed.
- Y. J. Wang, N. N. Zhao, B. Z. Fang, H. Li, X. T. T. Bi and H. J. Wang, Chem. Rev., 2015, 115, 3433–3467 CrossRef CAS PubMed.
- B. Fang, J. H. Kim, M. S. Kim and J. S. Yu, Acc. Chem. Res., 2013, 46, 1397–1406 CrossRef CAS PubMed.
- B. Fang, N. K. Chaudhari, M. S. Kim, J. H. Kim and J. S. Yu, J. Am. Chem. Soc., 2009, 131, 15330–15338 CrossRef CAS PubMed.
- M. K. Debe, Nature, 2012, 486, 43–51 CrossRef CAS PubMed.
- R. Jasinski, Nature, 1964, 201, 1212–1213 CrossRef CAS.
- G. Wu, K. L. More, C. M. Johnston and P. Zelenay, Science, 2011, 332, 443–447 CrossRef CAS PubMed.
- M. Lefevre, E. Proietti, F. Jaouen and J. P. Dodelet, Science, 2009, 324, 71–74 CrossRef CAS PubMed.
- A. Serov, K. Artyushkova and P. Atanassov, Adv. Energy Mater., 2014, 4, 919–926 Search PubMed.
- K. Artyushkova, A. Serov, S. Rojas-Carbonell and P. Atanassov, J. Phys. Chem. C, 2015, 119, 25917–25928 CAS.
- S. Jiang, C. Z. Zhu and S. J. Dong, J. Mater. Chem. A, 2013, 1, 3593–3599 CAS.
- Q. Liu and J. Y. Zhang, Langmuir, 2013, 29, 3821–3828 CrossRef CAS PubMed.
- S. H. Liu, Y. F. Dong, Z. Y. Wang, H. W. Huang, Z. B. Zhao and J. S. Qiu, J. Mater. Chem. A, 2015, 3, 19657–19661 CAS.
- L. L. Zhang, A. Q. Wang, W. T. Wang, Y. Q. Huang, X. Y. Liu, S. Miao, J. Y. Liu and T. Zhang, ACS Catal., 2015, 5, 6563–6572 CrossRef CAS.
- J. Kang, H. Wang, S. Ji, J. Key and R. F. Wang, J. Power Sources, 2014, 251, 363–369 CrossRef CAS.
- J. Liang, R. F. Zhou, X. M. Chen, Y. H. Tang and S. Z. Qiao, Adv. Mater., 2014, 26, 6074–6079 CrossRef CAS PubMed.
- J. Zhang, Z. J. Wang and Z. P. Zhu, J. Power Sources, 2014, 255, 65–69 CrossRef CAS.
- S. Kattel and G. F. Wang, J. Phys. Chem. Lett., 2014, 5, 452–456 CrossRef CAS PubMed.
- X. L. Zhang, Z. S. Lu and Z. X. Yang, Int. J. Hydrogen Energy, 2016, 41, 21212–21220 CrossRef CAS.
- S. Kattel, P. Atanassov and B. Kiefer, Phys. Chem. Chem. Phys., 2013, 15, 148–153 RSC.
- Z. Lu, G. Xu, C. He, T. Wang, L. Yang, Z. Yang and D. Ma, Carbon, 2015, 84, 500–508 CrossRef CAS.
- J. B. Yang, D. J. Liu, N. N. Kariuki and L. X. Chen, Chem. Commun., 2008, 3, 329–331 RSC.
- A. G. Kong, X. F. Zhu, Z. Han, Y. Y. Yu, Y. B. Zhang, B. Dong and Y. K. Shan, ACS Catal., 2014, 4, 1793–1800 CrossRef CAS.
- Y. S. Zhu, B. S. Zhang, X. Liu, D. W. Wang and D. S. Su, Angew. Chem., Int. Ed., 2014, 53, 10673–10677 CrossRef CAS PubMed.
- F. P. Pan, Q. P. Zhao, J. Wang and J. Y. Zhang, ChemElectroChem, 2015, 2, 2032–2040 CrossRef CAS.
- H. He, Y. K. Lei, C. Xiao, D. R. Chu, R. R. Chen and G. F. Wang, J. Phys. Chem. C, 2012, 116, 16038–16046 CAS.
- E. F. Holby, G. Wu, P. Zelenay and C. D. Taylor, J. Phys. Chem. C, 2014, 118, 14388–14393 CAS.
- S. Kabir, K. Artyushkova, B. Kiefer and P. Atanassov, Phys. Chem. Chem. Phys., 2015, 17, 17785–17789 RSC.
- J. Sun, Y. H. Fang and Z. P. Liu, Phys. Chem. Chem. Phys., 2014, 16, 13733–13740 RSC.
- S. Kattel, P. Atanassov and B. Kiefer, Phys. Chem. Chem. Phys., 2014, 16, 13800–13806 RSC.
- U. I. Koslowski, I. Abs-Wurmbach, S. Fiechter and P. Bogdanoff, J. Phys. Chem. C, 2008, 112, 15356–15366 CAS.
- D. H. Lee, W. J. Lee, W. J. Lee, S. O. Kim and Y. H. Kim, Phys. Rev. Lett., 2011, 106, 175502 CrossRef PubMed.
- D. Deng, X. Chen, L. Yu, X. Wu, Q. Liu, Y. Liu, H. Yang, H. Tian, Y. Hu, P. Du, R. Si, J. Wang, X. Cui, H. Li, J. Xiao, T. Xu, J. Deng, F. Yang, P. N. Duchesne, P. Zhang, J. Zhou, L. Sun, J. Li, X. Pan and X. Bao, Sci. Adv., 2015, 1, 1500462 Search PubMed.
- H. R. Byon, J. Suntivich and Y. Shao-Horn, Chem. Mater., 2011, 23, 3421–3428 CrossRef CAS.
- S. Kattel, P. Atanassov and B. Kiefer, J. Phys. Chem. C, 2012, 116, 8161–8166 CAS.
- P. Hohenberg and W. Kohn, Phys. Rev. [Sect.] A, 1964, 136, 864–871 CrossRef.
- W. Kohn and L. J. Sham, Phys. Rev. [Sect.] A, 1965, 140, 1133–1138 CrossRef.
- G. Kresse and J. Furthmuller, Phys. Rev. B: Condens. Matter Mater. Phys., 1996, 54, 11169–11186 CrossRef CAS.
- G. Kresse and J. Furthmuller, Phys. Rev. B: Condens. Matter Mater. Phys., 1996, 6, 15–50 CAS.
- P. E. Blochl, Phys. Rev. B: Condens. Matter Mater. Phys., 1994, 50, 17953–17979 CrossRef.
- J. P. Perdew, K. Burke and M. Ernzerhof, Phys. Rev. Lett., 1996, 77, 3865–3868 CrossRef CAS PubMed.
- H. J. Monkhorst and J. D. Pack, Phys. Rev. B: Solid State, 1976, 13, 5188–5192 CrossRef.
- G. Henkelman, B. P. Uberuaga and H. Jonsson, J. Chem. Phys., 2000, 113, 9901–9904 CrossRef CAS.
- S. Grimme, J. Comput. Chem., 2006, 27, 1787–1799 CrossRef CAS PubMed.
- S. Grimme, J. Antony, S. Ehrlich and H. Krieg, J. Chem. Phys., 2010, 132, 154104 CrossRef PubMed.
- J. K. Norskov, J. Rossmeisl, A. Logadottir, L. Lindqvist, J. R. Kitchin, T. Bligaard and H. Jonsson, J. Phys. Chem. B, 2004, 108, 17886–17892 CrossRef CAS.
- K. T. Chan, J. B. Neaton and M. L. Cohen, Phys. Rev. B: Solid State, 2008, 77, 235430 CrossRef.
- P. Zhang, X. F. Chen, J. S. Lian and Q. Jiang, J. Phys. Chem. C, 2012, 116, 17572–17579 CAS.
- R. R. Chen, H. X. Li, D. Chu and G. F. Wang, J. Phys. Chem. C, 2009, 113, 20689–20697 CAS.
- K. Li, Y. Li, Y. Wang, F. He, M. G. Jiao, H. Tang and Z. J. Wu, J. Mater. Chem. A, 2015, 3, 11444–11452 CAS.
- Z. Y. Duan and G. F. Wang, Phys. Chem. Chem. Phys., 2011, 13, 20178–20187 RSC.
Footnote |
| † Electronic supplementary information (ESI) available: Fig. S1 is possible configurations for each adsorbed species (side-on O2, end-on O2, O + O, O, OH, OOH, O + OH, OH + OH, H2O and H) involved in the ORR on the Fe–N3 embedded in graphene (Fe–N3-Gra). Fig. S2 is O hydrogenation into OH (d′1). Fig. S3 is the HOOH decomposed process with time. See DOI: 10.1039/c7ra03157b |
| This journal is © The Royal Society of Chemistry 2017 |

