 Open Access Article
Efficient removal of 17α-ethinylestradiol (EE2) from water using freshly formed Fe–Mn binary oxide†
Liying Jiang *,
Youli Gu,
Haiqian Guo,
Lu Liu and
Jianmeng Chen*
College of Environment, Zhejiang University of Technology, Hangzhou 310032, China. E-mail: jchen@zjut.edu.cn
First published on 3rd May 2017
Abstract
An in situ formed Fe–Mn binary oxide (FMBO) was successfully fabricated for efficient removal of 17α-ethinylestradiol (EE2) from water. Moreover, manganese oxide (MnO2) and ferric oxide (FeOOH) were also studied for the comparison of EE2 removal efficiency and FMBO showed a better removal capacity towards EE2 than both MnO2 and FeOOH. Various removal conditions including contact time, pH and coexisting ions were investigated. The results showed that the best removal capacity was obtained at pH 6.0 and FMBO rapidly reached a removal efficiency of approximately 96% in 30 min at pH 6.0. The retarded first-order kinetic model was able to simulate the entire removal kinetics (R2 = 0.96). Besides, it was found that the investigated coexisting ions (SO42−, Ca2+, Mg2+, Fe3+) did not have an obvious effect on EE2 removal, while phosphate, carbonate, and manganous ions reduced the removal efficiency, especially phosphate. Fourier transform infrared and X-ray photoelectron spectroscopy results were investigated and they revealed that EE2 was adsorbed through hydrogen bonding and then oxidized by MnO2 on FMBO, which contributed to further degradation of EE2. Besides, the intermediates during removal were studied by gas chromatography-mass spectroscopy, indicating that the products still kept the core ring structure of estrogen while lowering estrogen activity. Above all, FMBO can be used as a promising material to remove EE2.
1. Introduction
Recently, endocrine disrupting chemicals (EDCs) as a specific group of trace organic contaminants have already raised international concern, which can interact with the endocrine system of organisms by influencing the synthesis, release, transport, metabolism and excretion of hormones in the body, and thus lead to a variety of developmental and reproductive disorders, as well as feminizing effects.1,2 Estrogens are well-known EDCs, and include natural, synthetic, and phyto-estrogens. Among them, the synthetic estrogen 17α-ethinylestradiol (EE2), a primary component in contraceptive pills and postmenopausal hormonal supplements, is generally more stable than natural estrogens in aqueous environments and has greater estrogenic potency (approximate 11–27 times) than the natural estrogen (E1) and estradiol (E2).3 Studies show that EE2 is frequently detected in wastewater treatment plants and is widely discharged into receiving water due to incomplete removal during the treatment process.4,5 In addition, it is reported that EE2 can interfere with the hormonal systems of male rainbow trout even at less than 1 ng L−1 and male fathead minnows at concentrations ≥4 ng L−1.6,7 Hence, it is essential to explore effective, reliable and cost-effective techniques for EE2 treatment.Traditionally, estrogen-containing wastewater is treated by activated sludge treatment,8 adsorption,9 ozonation,10 filtration membranes,11 or photo catalytic oxidation.12 Among these approaches, adsorption is a proven technology used widely in water treatment facilities for water detoxification and purification because of its high efficiency, simple operation conditions, the fact that it does not generate harmful byproducts, and its cost effective.13 Moreover, EE2 is a kind of nonpolar and hydrophobic compound which is difficult to dissolve in polar water solution, therefore, it can be strongly adsorbed onto solid particles in wastewater treatment.13,14
Fe oxide is the most abundant metal oxide found in soils and sediments and has been widely used as adsorbents to remove contaminants from water for their relatively high specific area and charge.15,16 Manganese oxide is well-known solid phase oxidant due to their high redox potential, which is able to promote the oxidation of a variety of synthetic and natural organic pollutants including humic substances, phenols, endocrine disrupters and chlorinated organic compounds.17–20 Iron oxide and manganese oxide, both low cost and environmentally friendly, are omnipresent in the natural environment and always found in combination with each other to form composite oxide. Therefore, Fe–Mn binary oxide (FMBO) adsorbent which combines the adsorption with oxidation processes has been extensively researched to remove pollutants in water, such as metal ions,21,22 arsenate and arsenite,23 phosphate,24 tetracycline25 and so on. For example, Zhang and his coworkers26 synthesized a novel Fe–Mn binary oxide adsorbent (with a Fe![[thin space (1/6-em)]](https://www.rsc.org/images/entities/char_2009.gif) :
:![[thin space (1/6-em)]](https://www.rsc.org/images/entities/char_2009.gif) Mn molar ratio of 3
Mn molar ratio of 3![[thin space (1/6-em)]](https://www.rsc.org/images/entities/char_2009.gif) :
:![[thin space (1/6-em)]](https://www.rsc.org/images/entities/char_2009.gif) 1) by a simple and low cost method, and the experimental results showed that the synthetic material was very effective for arsenite removal. To our best knowledge, very little is known about the removal behaviors of EE2 on Fe–Mn binary oxide, and the detailed mechanism of estrogen removal by FMBO also needs to be clarified.
1) by a simple and low cost method, and the experimental results showed that the synthetic material was very effective for arsenite removal. To our best knowledge, very little is known about the removal behaviors of EE2 on Fe–Mn binary oxide, and the detailed mechanism of estrogen removal by FMBO also needs to be clarified.
The objectives of this study were to study the effect of different parameters (contact time, pH and coexisting ions) on EE2 removal to discuss the feasibility and capability of FMBO and propose the dominant mechanisms and degradation routes involved in EE2 removal by FMBO using Fourier transform infrared spectroscopy (FTIR), X-ray photoelectron spectroscopy (XPS) techniques and gas chromatography-mass spectroscopy (GC-MS).
2. Materials and methods
2.1. Materials
EE2 (>98.0%) was purchased from Sigma-Aldrich (St. Louis, MO, USA). All chemicals were prepared using analytical grade chemicals from Shanghai Zhenxin Reagent Co. (Shanghai, China), except methanol and acetonitrile were chromatographically grade from Tianjin Shield Fine Chemical Company (Tianjin, China).2.2. Materials preparation
EE2 working solutions were freshly prepared by dissolving in methanol and then diluting with deionized water in later experiment.27 The FMBO adsorbent was synthesized using a coprecipitation method with redox reaction as described in previous study with a Fe/Mn molar ratio of 3![[thin space (1/6-em)]](https://www.rsc.org/images/entities/char_2009.gif) :
:![[thin space (1/6-em)]](https://www.rsc.org/images/entities/char_2009.gif) 1.26 Briefly, potassium permanganate (KMnO4) and iron(II) sulfate heptahydrate (FeSO4·H2O) with a ratio of 1
1.26 Briefly, potassium permanganate (KMnO4) and iron(II) sulfate heptahydrate (FeSO4·H2O) with a ratio of 1![[thin space (1/6-em)]](https://www.rsc.org/images/entities/char_2009.gif) :
:![[thin space (1/6-em)]](https://www.rsc.org/images/entities/char_2009.gif) 3 were dissolved in deionized water, respectively. Then, FeSO4 solution was added slowly into the KMnO4 solution under vigorous magnetic-stirring. Simultaneously, NaOH or HCl solution was added to maintain the solution pH at 7–8. After addition, the resultant suspension was stirred continuously for 1 h, aged at room temperature for 12 h, then filtered and washed repeatedly with deionized water until the conductivity was <2 μS cm−1, and dried at 105 °C for 4 h. The dry material was crushed and stored in a desiccator. MnO2 and FeOOH were also prepared for the control experiment according to previous studies,28,29 and the detailed procedures were illustrated in the ESI (Text S1).†
3 were dissolved in deionized water, respectively. Then, FeSO4 solution was added slowly into the KMnO4 solution under vigorous magnetic-stirring. Simultaneously, NaOH or HCl solution was added to maintain the solution pH at 7–8. After addition, the resultant suspension was stirred continuously for 1 h, aged at room temperature for 12 h, then filtered and washed repeatedly with deionized water until the conductivity was <2 μS cm−1, and dried at 105 °C for 4 h. The dry material was crushed and stored in a desiccator. MnO2 and FeOOH were also prepared for the control experiment according to previous studies,28,29 and the detailed procedures were illustrated in the ESI (Text S1).†
2.3. Synthetic oxide characterization
The specific surface area of the synthetic materials were measured by nitrogen adsorption using the Brunauer–Emmett–Teller (BET) method with a Micromeritics ASAP 2000 surface area analyzer (Norcross, GA, USA). According to our previous study,30 the surface area of the FMBO, manganese dioxide and iron oxide were 316.76 m2 g−1, 266.90 m2 g−1 and 172.31 m2 g−1, respectively. A zeta (ζ) potential analyzer (Zetasizer 2000, Malvern, UK) was used to mensurate the pHzpc of Fe–Mn binary oxide particles (6.02), manganese dioxide (2.85) and iron oxide (7.45).30Fourier transform infrared spectroscopy (FTIR) spectra were obtained using a Nicolet 6700 Fourier Transform IR spectrophotometer Spectrum (Thermo, USA) to identify functional groups on the oxide surface before and after removing EE2. FTIR spectra from 400 to 4000 cm−1 were obtained with 15 scans for each spectrum recorded at a resolution of 4 cm−1. Oxides before and after EE2 removal were probed using X-ray photoelectron spectroscopy (KRATOS AXIS UlTRA, DLD) with Al Kα radiation and Al/Mg radiation at 450 W and 3.0 × 10⁻¹⁰ Pa. Data were analyzed using X-ray photoelectron spectroscopy (XPS) peak software.
2.4. Batch removal experiments
The pH and coexisting ions studies were performed at room temperature by adding 0.2 g L−1 of the binary oxide sample into the 250 mL conical flask which contained 100 mL of 10 mg L−1 EE2 solution. The flasks were covered by aluminum foil to avoid photolysis and shaken at 160 rpm until an equilibrium was reached. The pH values were adjusted using HCl or NaOH solution. Effect of solution pH was tested by varying the initial solution pH from 3.0 to 9.0. To investigate the influence of coexisting anions (SO42−, CO32−, PO43−) on removal efficiency, the corresponding sodium salts were introduced into the EE2 solution at pH 6.0 ± 0.1. Similarly, the influence of coexisting cations (Ca2+, Mg2+, Fe3+ and Mn2+) were also investigated by introducing corresponding chloride salts.For removal kinetics, 0.2 g L−1 of the binary oxide sample was added in the 100 mL of 10 mg L−1 EE2 solution at pH 6.0 ± 0.1 under room temperature, and then shook at 160 rpm until reaching equilibrium. The conditions of control-experiments for MnO2 and FeOOH kept consistent with FMBO test. Each 2 mL aliquot was taken from the suspension at a fixed period of time (0.33, 0.67, 1, 1.5, 3, 5, 10, 15, 30, 60, 120 min). Sample solutions were filtered using 0.22 μm PTFE syringe filters and the concentrations of EE2 in the supernatant were determined by a high performance liquid chromatograph 1200 Series (Agilent Technologies, USA). Meanwhile the release amounts of Fe2+ and Mn2+ in the final solutions were determined by atomic adsorption spectrometer. All experiments were performed in triplicate, where the average value and the standard deviation are reported. Removal efficiency was calculated using as
| Removal efficiency (%) = (C0 − Ct) × 100/C0 | (1) |
2.5. Analysis
EE2 solutions were analyzed by Agilent 1200 Series HPLC system equipped with a quaternary pump, an auto sampler, a thermostated column compartment and a UV detector. Reverse phase chromatographic separation of EE2 was achieved by a SB-C18 column (4.6 × 250 mm, 5 μm, Agilent, USA) that was thermostatically held at 30 °C. Analysis was performed at 200 nm wavelength with 100 μL sample injection, and the mobile phase at the flow rate of 1 mL min−1 was a mixture of acetonitrile and water (acidified by 10 mM phosphoric acid) in ratio of 60![[thin space (1/6-em)]](https://www.rsc.org/images/entities/char_2009.gif) :
:![[thin space (1/6-em)]](https://www.rsc.org/images/entities/char_2009.gif) 40 following the method described by Xu et al.31
40 following the method described by Xu et al.31
To identify intermediates, a gas chromatography-mass spectroscopy (GC-MS) system was used with a gas chromatograph coupled to the mass spectrometer (Agilent GC-MS 7890, USA) equipped with a HP-5 column (30 × 0.32 mm, 0.25 μm).32
Before GC-MS detection, the reaction solution were extracted by n-hexane twice and then blown down to 1 mL under a gentle flow of nitrogen at 45 °C and further evaporated to dryness under a gentle nitrogen stream. The dry residues were derivatized by addition of 50 μL of pyridine and 100 μL of BSTFA (1% TMCS), and heated at 70 °C for 40 min. The derivatives were cooled to room temperature and subjected to GC-MS detection. Helium carrier gas was maintained at a constant flow rate of 1.0 mL min−1. The column temperature was kept at 100 °C for 1 min, heated to 200 °C at a rate of 10 °C min−1, then increased to 260 °C at a rate of 13 °C min−1, finally increased to 300 °C at a rate of 5 °C min−1 and held for 1 min. The total run time was 24.64 min. The injector temperature was 280 °C and operated in splitless mode. The interface temperature was 280 °C, and the detector temperature was 250 °C. MS was operated in electron impact (EI) ionization mode, and selected ion monitoring (SIM) mode was used for quantification.
3. Results and discussion
3.1. Kinetics study on EE2 removal by FMBO
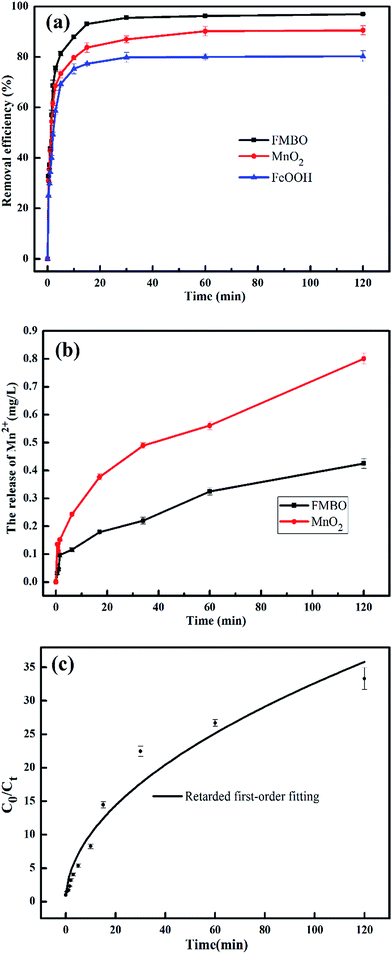
Fig. 1a illustrates the removal efficiency of EE2 by FMBO, MnO2 and FeOOH as a function of time. The EE2 removal on the FMBO could be divided into three stages. During the first period (prior to 2 min), the removal capacity of FMBO for EE2 rapidly increased as the reaction processed, and reached approximately 70% at 2 min. During the second period (from 2 to 15 min), the reaction rate evidently reduced over time and the removal efficiency increased from approximately 70% to 93%. At last, during the equilibrium period (after 15 min), the removal of EE2 gradually reached equilibrium (97%) at approximately 30 min and the change in the removal capacity with time was insignificant. For MnO2 and FeOOH, the two curves are the same in variation trend with that of FMBO but different in removal rate at equilibrium. The equilibrium removal efficiency of EE2 was found to be 90.56% for MnO2, and 80.30% for FeOOH, respectively. FMBO showed a better removal capacity towards EE2 than both MnO2 and FeOOH. In consideration of the better removal efficiency and easier preparation than MnO2, FMBO is potentially feasible for the removal of EE2 in practice.The rapid increasing of removal efficiency at the initial stage can be explained that the available adsorption sites were abundant at first, and the EE2 molecules could interact easily with the sites. As the reaction progressed, the available adsorption sites were less and less. Meanwhile, the degradation products competed for adsorption sites with EE2, which further reduced the adsorption sites. Therefore, the removal rate is slow in later stage.33 Because of the reductive dissolution of MnO2, part of the Mn(II) became detached from the FMBO and MnO2 surface, and the Mn(II) concentration in solution increased (Fig. 1b). The increase of Mn(II) continued even after the removal was in equilibrium. This phenomenon can be related to an oxidation lag after adsorption that EE2 was firstly adsorbed on the surface of oxide and then reacted with the manganese oxide.34 The iron ions release in solution was also identified and the Fe2+ concentration was lower than detection limit, suggesting that there was no redox reaction for iron oxide in FMBO during the removal progress.
As seen from the Fig. 1a, the removal of EE2 in solution by FMBO against reaction time represented high linear relationship in the initial stage of the reaction, then the loss of EE2 slowed as the reaction progressed. The removal of EE2 over reaction time apparently deviated from a pseudo-first-order kinetics. Such reaction kinetics was also observed in previous studies.35–37 This phenomenon may be attributed to the changing properties of FMBO during the reaction. The remaining vacant sites for EE2 decreased as the reaction occurred, and the reaction products accumulated on the surface which further reduced the effective sites.35 All these led to the slowing down of reaction rate. Thus, the first-order decay model is not accurate for the reactions in this work. In this case, we introduce a retardation coefficient (α) to describe the degree of deviation from pseudo-first-order reaction, and the time-dependent reaction rate constant (kt) can be expressed as37
 | (2) |
 | (3) |
| Ct = C0(1 + αt)−kinit/α | (4) |
The retarded first-order kinetic model fitting of EE2 removal by FMBO was shown in the Fig. 1c and the results were shown in Table 1. The high value of R2 (0.96) indicated that the retarded first-order model was able to interpret the EE2 removal in the reaction.
| Kinetic equation | Initial rate constant kinit (min−1) | Retardation coefficient α (min−1) | R2 |
|---|---|---|---|
| Ct = C0(1 + 9.16t)−0.51 | 4.68 | 9.16 | 0.96 |
3.2. Effect of pH on EE2 removal
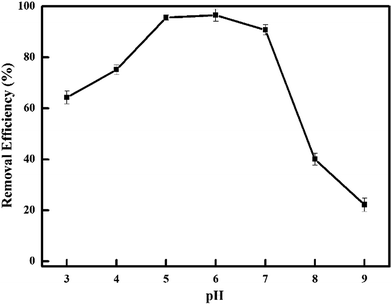
The effect of solution pH (from 3.0 to 9.0) on the removal of EE2 by FMBO was examined and the results were presented in Fig. 2. It is obvious that the uptake of EE2 highly depends on the initial solution pH, which affects the surface properties of FMBO and ionization of the EE2. For the curve in Fig. 2, it has seen an increase in removal efficiency when pH is lower than 5, which, however, drops drastically for pH > 7 in the removal of EE2. In between these two stages, the removal efficiency is found to maintain a high level (>90%) and obtains the best removal capacity (96%) at pH 6.0. The observed phenomenon can be explained by the following reasons. At pH 3 to 9, EE2 is mostly in non-dissociated form because the pKa value of EE2 is 10.7.38 The surfaces of FMBO is positively charged when the pH was lower than the pHzpc value of FMBO (6.02) and negatively charged at pH > 6.02.30 At pH < 5, FMBO showed a lower removal rate than the maximum, and it may be because the oxide particles were partly dissolved in strong acidic solution. Besides, the lower removal efficiency at pH < 5 may also partly related to the competition with H+ which reduced the adsorption of EE2 on adsorbent. When the pH was higher than 6.02, the surface of FMBO became negatively charged which was conducive to adsorb Mn2+, causing less adsorption site for EE2. Besides, there were more hydroxyl groups on the surface of FMBO at high pH which favored the adsorption of water molecules and led to further reduction of adsorption site. Therefore, it has a sharp decrease in removal percentage when pH > 7.On the other hand, the EE2 removal progress can be divided into three steps: firstly EE2 was adsorbed to the surface of FMBO by surface hydroxyl groups and then reacted with the manganese oxide to form complex accompanying with electron shift; the final step was product separation.39,40 Among these steps, complexation process and electron transfer process were the rate-limiting steps. Equation is as follows:
![[triple bond, length as m-dash]](https://www.rsc.org/images/entities/char_e002.gif) SOH + RO− → SOH + RO− → ![[triple bond, length as m-dash]](https://www.rsc.org/images/entities/char_e002.gif) SOR + OH− SOR + OH−
| (5) |
![[triple bond, length as m-dash]](https://www.rsc.org/images/entities/char_e002.gif) SOH is the hydroxyl group on FMBO; RO is EE2;
SOH is the hydroxyl group on FMBO; RO is EE2; ![[triple bond, length as m-dash]](https://www.rsc.org/images/entities/char_e002.gif) SOR is the forming complex. According to the above equation, under alkaline conditions this reaction tended to be in the opposite direction and leaded to a suppression on EE2 removal by FMBO.
SOR is the forming complex. According to the above equation, under alkaline conditions this reaction tended to be in the opposite direction and leaded to a suppression on EE2 removal by FMBO.
3.3. Effect of coexisting ions on EE2 removal
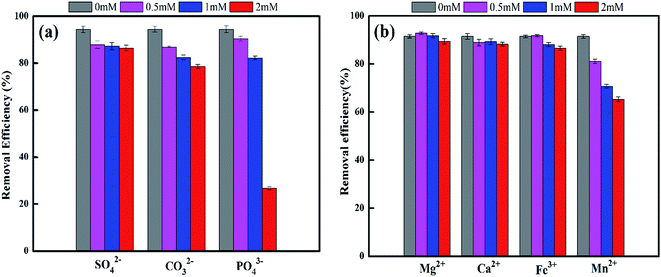
The presence of common ions, usually present in groundwater samples, may interfere with the removal of EE2 by FMBO, since certain ions may compete for active sites or form complex. Therefore, we also investigated the influence of anions (SO42−, CO32−, PO43−) and cations (Ca2+, Mg2+, Fe3+ and Mn2+) at their own environmentally relevant concentrations. As shown in Fig. 3a, the increase of CO32− and PO43− concentration resulted in the reduced removal of EE2, especially the effect of phosphate. When the PO43− rose from 0 to 2 mM, the removal efficiency decreased from 94.5% to 26.7%. It was mainly due to the strong competition between PO43− and EE2, for the active sites on the surface of FMBO. Some studies have reported that phosphate can be adsorbed onto FMBO by replacing surface hydroxyl groups via formation of monodentate and bidentate complexes.41 And it tend to form inner-sphere complexes that have stable structure and strong affinity with adsorbent. In addition, sulphate ions are difficult to be adsorbed on MnO2 at pH 2–9 illustrating the negligible influence for EE2 removal.42Fig. 3b shows that the added Mn2+ has an obvious inhibition on EE2 removal, which is consistent with the arsenate removal by FMBO.43,44 As the most frequent divalent cations in drinking water, Ca2+ and Mg2+ did not show a pronounced inhibition of EE2 removal in our experimental work. Mn2+ exhibited the strongest inhibition on EE2 removal and it could be explained as follows: Mn2+ could be strongly adsorbed on MnO2, leading to severe reduction of surface sites;45 the existence of Mn2+ inhibited the electron transfer in redox reaction and then reduced the redox potential of Mn2+/MnO2; thirdly, it might form the inner-sphere complexes with the surface metal oxide of FMBO and consequently compete for the adsorption sites of FMBO.
3.4. Analysis of reaction mechanism
![[thin space (1/6-em)]](https://www.rsc.org/images/entities/char_2009.gif) :
:![[thin space (1/6-em)]](https://www.rsc.org/images/entities/char_2009.gif) 1 which is agreement with preparation process. After EE2 removal, it can be seen from the Fig. 4a that the peak intensity of Mn2p and Fe2p decreased to different extent while those of C1s, O1s increased.
1 which is agreement with preparation process. After EE2 removal, it can be seen from the Fig. 4a that the peak intensity of Mn2p and Fe2p decreased to different extent while those of C1s, O1s increased.
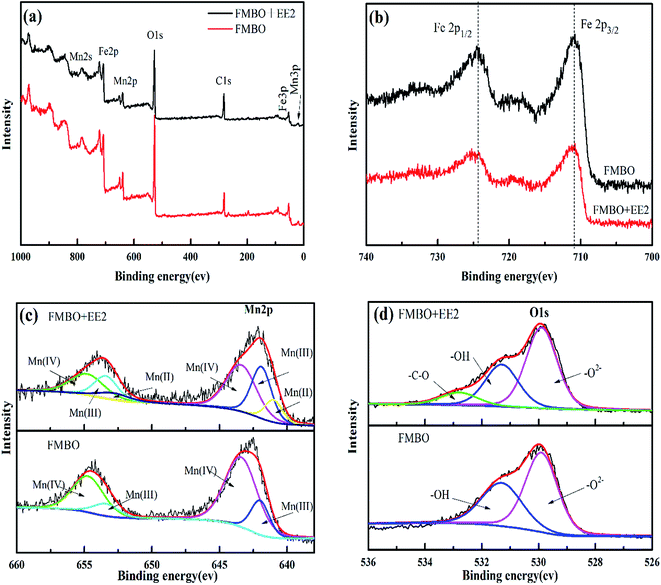 | ||
| Fig. 4 The high-resolution XPS spectra of FMBO before and after EE2 removal: (a) full-scan spectra; (b) Fe2p; (c) Mn2p; (d) O1s. | ||
The Fe2p and Mn2p spectra of FMBO before and after reaction with EE2 are illustrated in Fig. 4b. The peak positions of Fe2p1/2 at 724.5 eV and Fe2p3/2 at 711 eV didn't change after reaction, indicating that the valence state of iron element keep +3 and had no redox reaction.46 On the other hand, the XPS spectrum of Mn2p changed apparently in Fig. 4c. Before EE2 treatment, the XPS spectrum of Mn2p in FMBO could be deconvolved into two components assigned to Mn(IV) and Mn(III) for both the Mn2p2/3 and Mn2p2/1 peaks, respectively. The Mn2p1/2 and 2p3/2 peaks at 653.9 and 643.4 eV with a spin energy separation of 10.5 eV was assigned to be the 2p binding energy of Mn(IV) and match well with the characteristic peaks of MnO2.47 And the peaks of Mn2p1/2 at 653.4 eV and Mn2p3/2 at 642.2 eV were in agreement with the existence of Mn(III). By calculating from the fitting curves, the results showed that the percentage of Mn(III) was 22.05% and Mn(IV) was 77.95%. However, after reaction with EE2, peaks at 641.0 eV in the spectrum of Mn2p3/2 and 652.8 eV in the spectrum of Mn2p1/2 indicated the emergence of Mn(II). The XPS spectrum of Mn2p in FMBO was deconvolved into three components assigned to Mn(II), Mn(III) and Mn(IV). And the percentage of different valence of Mn, calculated from fitting each deconvoluted peak, changed from 77.9% to 49.5% for Mn(IV) and Mn(II) as the new valence state occupied 14.1%, suggesting part of the Mn(IV) was transformed to Mn(II) during EE2 removal. Therefore, FMBO played a role of both adsorption and oxidation in EE2 treatment.
In addition, the O1s spectrum of FMBO before and after reaction was presented in Fig. 4d. For the raw FMBO, the O1s XPS spectra was divided into two peaks corresponding to the surface lattice oxygen species (in the form of O2− from Mn oxide) at 529.9 eV and –OH (hydroxyl bonded to metal such as Fe–OH and Mn–OH) at 531.3 eV based on the binding energy of different oxygen species.48 After reaction, a new peak attributed to oxygen in hydroxyl or either groups (C–O ∼ 533.0 eV) emerged.49 This confirmed the generating of phenolic hydroxyl groups or alcoholic hydroxyl groups on the FMBO after EE2 removal. In addition, the obvious decrease of –OH (531.3 eV) percentage on the reacted FMBO surface was observed and proved that –OH was involved in the EE2 reaction by hydrogen bonding effect. This result agrees with later FTIR analysis.
![[double bond, length as m-dash]](https://www.rsc.org/images/entities/char_e001.gif) C stretching at near 1620 cm−1 and the C
C stretching at near 1620 cm−1 and the C![[double bond, length as m-dash]](https://www.rsc.org/images/entities/char_e001.gif) O stretching band at 1635 cm−1 from the adsorbed EE2.52,53 There were some new weak characteristic peaks of EE2 emerged in the spectra after reaction which further proved the sorption of EE2 on FMBO, including the aliphatic C–H at 2944 cm−1, the C
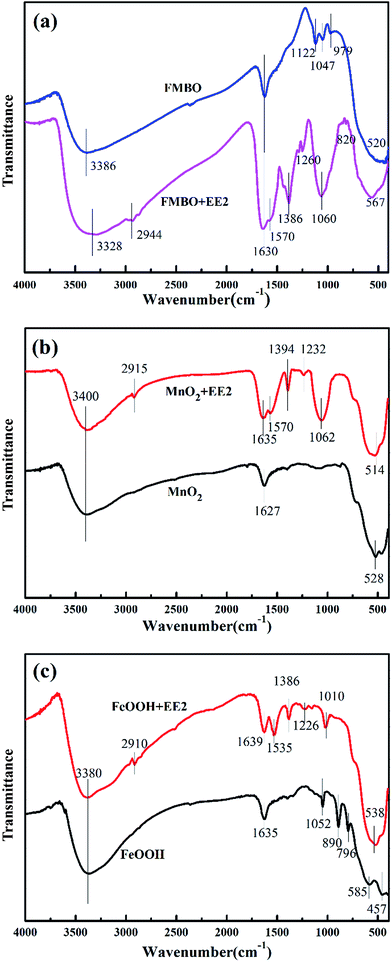
O stretching band at 1635 cm−1 from the adsorbed EE2.52,53 There were some new weak characteristic peaks of EE2 emerged in the spectra after reaction which further proved the sorption of EE2 on FMBO, including the aliphatic C–H at 2944 cm−1, the C![[double bond, length as m-dash]](https://www.rsc.org/images/entities/char_e001.gif) C stretching appeared at 1570 cm−1, the aromatic C–H at 1386 cm−1, the C–O vibration from phenolic hydroxyl and alcoholic hydroxyl at 1260 cm−1 and the bending vibration of C–H at 820 cm−1.54–56 FMBO showed three typical characteristic infrared peaks at 1127, 1047, and 979 cm−1 before reaction. These peaks corresponded to the bending vibration of the surface hydroxyl groups associated with Fe and Mn oxide and were due primarily to the iron (hydr)oxide (Fe–OH) vibration.57 These peaks disappeared after removing EE2, and a new peak appeared at 1060 cm−1, which was attributed to the C–O angular deformation on FMBO58 as a result of the hydrogen bonding effect. Additionally, a peak due to the stretching vibration peak of M–O (Fe–O and Mn–O) blue shifted from 484 to 567 cm−1 after reaction with EE2, indicating the decrease of manganese oxide30,50,59 that reduced to Mn2+ in the solution. In conclusion, EE2 was adsorbed by the effect of hydrogen bonding. Iron oxide had an adsorption effect, and both adsorption and oxidation occurred on manganese oxide during EE2 removal by FMBO.
C stretching appeared at 1570 cm−1, the aromatic C–H at 1386 cm−1, the C–O vibration from phenolic hydroxyl and alcoholic hydroxyl at 1260 cm−1 and the bending vibration of C–H at 820 cm−1.54–56 FMBO showed three typical characteristic infrared peaks at 1127, 1047, and 979 cm−1 before reaction. These peaks corresponded to the bending vibration of the surface hydroxyl groups associated with Fe and Mn oxide and were due primarily to the iron (hydr)oxide (Fe–OH) vibration.57 These peaks disappeared after removing EE2, and a new peak appeared at 1060 cm−1, which was attributed to the C–O angular deformation on FMBO58 as a result of the hydrogen bonding effect. Additionally, a peak due to the stretching vibration peak of M–O (Fe–O and Mn–O) blue shifted from 484 to 567 cm−1 after reaction with EE2, indicating the decrease of manganese oxide30,50,59 that reduced to Mn2+ in the solution. In conclusion, EE2 was adsorbed by the effect of hydrogen bonding. Iron oxide had an adsorption effect, and both adsorption and oxidation occurred on manganese oxide during EE2 removal by FMBO.
In the control experiments, the FTIR spectra of MnO2 and FeOOH before and after reaction were illustrated in Fig. 5b and c, respectively. In Fig. 5b, the peak at 3400 cm−1 due to stretching vibration of hydroxide groups was stronger after reaction as a result of adsorption of EE2. The peak at 1627 cm−1 shifted to 1635 cm−1 and was much stronger after reaction, which might be caused by the C![[double bond, length as m-dash]](https://www.rsc.org/images/entities/char_e001.gif) O (1635 cm−1) and the hydrogen bonding between hydroxyl groups from EE2 and manganese oxide. The new peaks (2915 cm−1, 1394 cm−1) corresponding to the vibration of C–H on EE2 molecules and its intermediates. The C
O (1635 cm−1) and the hydrogen bonding between hydroxyl groups from EE2 and manganese oxide. The new peaks (2915 cm−1, 1394 cm−1) corresponding to the vibration of C–H on EE2 molecules and its intermediates. The C![[double bond, length as m-dash]](https://www.rsc.org/images/entities/char_e001.gif) C and C–O vibration formed the peaks at 1570 cm−1 and 1232 cm−1, respectively. The stronger peak at 1062 cm−1 may be ascribed to the vibration of C–O. The peak at 528 cm−1 corresponding to Mn–O vibration was shifted to 514 cm−1 after EE2 adsorption. These results were similar to those of FMBO.
C and C–O vibration formed the peaks at 1570 cm−1 and 1232 cm−1, respectively. The stronger peak at 1062 cm−1 may be ascribed to the vibration of C–O. The peak at 528 cm−1 corresponding to Mn–O vibration was shifted to 514 cm−1 after EE2 adsorption. These results were similar to those of FMBO.
For the Fe oxide spectra, the peak at 3380 cm−1 was more stronger after reaction with EE2 like the FMBO. The new peaks at 2910 cm−1, 1535 cm−1, 1386 cm−1 and 1226 cm−1 were due to the vibration of aliphatic C–H, the stretching vibration of C![[double bond, length as m-dash]](https://www.rsc.org/images/entities/char_e001.gif) C, the vibration of aromatic C–H and C–O vibration, respectively. The peak at 1635 cm−1 was slightly stronger after reaction, which was different from that of FMBO and MnO2. This could be because the inexistence of C
C, the vibration of aromatic C–H and C–O vibration, respectively. The peak at 1635 cm−1 was slightly stronger after reaction, which was different from that of FMBO and MnO2. This could be because the inexistence of C![[double bond, length as m-dash]](https://www.rsc.org/images/entities/char_e001.gif) O on Fe oxide, which further proved only adsorption occurred for Fe oxide. The peak at 1052 cm−1 correspond to the bending vibration of the hydroxyl group (Fe–OH), and 890 and 796 cm−1 correspond to the stretching vibration.28 After reaction with EE2, the former peaks disappeared, whereas a new peak (1010 cm−1) ascribed to the vibration of C–O emerged. It indicated the hydrogen bonding occurred between the Fe–OH and EE2. These results suggest that iron oxide was the main adsorbent, whereas the manganese oxide also showed adsorption and oxidation ability.
O on Fe oxide, which further proved only adsorption occurred for Fe oxide. The peak at 1052 cm−1 correspond to the bending vibration of the hydroxyl group (Fe–OH), and 890 and 796 cm−1 correspond to the stretching vibration.28 After reaction with EE2, the former peaks disappeared, whereas a new peak (1010 cm−1) ascribed to the vibration of C–O emerged. It indicated the hydrogen bonding occurred between the Fe–OH and EE2. These results suggest that iron oxide was the main adsorbent, whereas the manganese oxide also showed adsorption and oxidation ability.
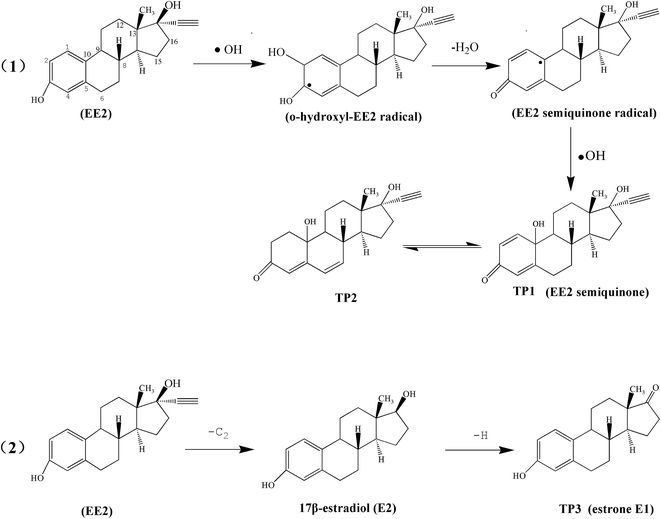
The possible degradation pathways were proposed in Fig. 6 according to the previous study.61 As we can see, in the first reaction pathway, EE2 was firstly attacked on the C2 atoms by hydroxyl radicals and formed o-hydroxyl-EE2 radical which was easy to dehydrate and changed into EE2 semiquinone radical (but both of them were not detected by GC-MS). Then it was further oxidized by ˙OH radical at C10 atom to form quinoid structure (TP1) and cyclohexenone structure (TP2). On the other hand, another possible pathway led to the formation of E1. The ˙OH attacked at C17 atom followed by acetylene removal reaction to form 17β-estradiol, which was not detected but as a reasonable intermediate of E1. Subsequently, further oxidation occurred at C17 atom and the hydroxyl was changed into carbonyl groups by dehydrogenation to form E1. This conclusion is consistent with previous reports by Frontistis.3 Above all, the results indicated that the products are less active than the original target compounds.
4. Conclusion
The Fe–Mn binary oxide (FMBO) employed in this work was successful in removing 17α-ethinylestradiol (EE2) from water and showed a better removal capacity towards EE2 than both MnO2 and FeOOH. The results were shown that the reaction obtained the best removal capacity at pH 6.0 and FMBO rapidly reached equilibrium approximately at 30 min at pH 6. The retarded first-order kinetic model was able to interpret the EE2 removal in the reaction. Besides, it was found that the investigated coexisting ions (SO42−, Ca2+, Mg2+, Fe3+) did not have an obvious effect on the EE2 removal, while phosphate, carbonate, and manganous ions reduced the removal efficiency especially phosphate. XPS and FTIR analysis show that EE2 molecules were firstly adsorbed by hydrogen bonding between EE2 and FMBO (such as Fe–OH and Mn–OH) and then oxidized by MnO2, which illustrated that oxidation and adsorption both occurred during EE2 removal by FMBO. Then the products were investigated by GC-MS and it was confirmed that intermediates retained the core ring structure of estrogen, but the estrogen activity reduced. The results from this study demonstrate that synthetic FMBO successfully composed iron and manganese oxide, and would be a promising material for efficient treatment of EE2.Acknowledgements
This work was supported by the National Natural Science Foundation of China (No. 21107097), the Zhejiang Province Natural Science Foundation of China (No. Y5110118), and the Program for Changjiang Scholars and Innovative Research Team in University.References
- M. H. Yang, M. S. Park and H. S. Lee, J. Environ. Sci. Health, Part C: Environ. Carcinog. Ecotoxicol. Rev., 2006, 24, 183–224 CrossRef CAS PubMed.
- C. H. Kuo, S. N. Yang, P. L. Kuo and C. H. Hung, Kaohsiung J. Med. Sci., 2012, 28, S37–S42 CrossRef CAS PubMed.
- Z. Frontistis, M. Kouramanos, S. Moraitis, E. Chatzisymeon, E. Hapeshi, D. Fatta-Kassinos, N. P. Xekoukoulotakis and D. Mantzavinos, Catal. Today, 2015, 252, 84–92 CrossRef CAS.
- Z. H. Zhang, Y. J. Feng, Y. Liu, Q. F. Sun, P. Gao and N. Q. Ren, J. Hazard. Mater., 2010, 181, 1127–1133 CrossRef CAS PubMed.
- G. G. Ying, R. S. Kookana and Y. J. Ru, Environ. Int., 2002, 28, 545–551 CrossRef CAS.
- R. Lange, T. H. Hutchinson, C. P. Croudace, F. Siegmund, H. Schweinfurth, P. Hampe, G. H. Panter and J. P. Sumpter, Environ. Toxicol. Chem., 2001, 20, 1216–1227 CrossRef CAS PubMed.
- C. E. Purdom, P. A. Hardiman, V. V. J. Bye, N. C. Eno, C. R. Tyler and J. P. Sumpter, Chem. Ecol., 1994, 8, 275–285 CrossRef CAS.
- A. C. Johnson and J. P. Sumpter, Environ. Sci. Technol., 2001, 35, 4697–4703 CrossRef CAS PubMed.
- J. L. Zhou, R. Liu, A. Wilding and A. Hibberd, Environ. Sci. Technol., 2007, 41, 206–213 CrossRef CAS PubMed.
- M. G. Maniero, D. M. Bila and M. Dezotti, Sci. Total Environ., 2008, 407, 105–115 CrossRef PubMed.
- J. Heo, J. R. V. Flora, N. Her, Y. G. Park, J. Cho, A. Son and Y. Yoon, Sep. Purif. Technol., 2012, 90, 39–52 CrossRef CAS.
- M. Bistan, T. Tisler and A. Pintar, Catal. Commun., 2012, 22, 74–78 CrossRef CAS.
- M. Cirja, S. Zuehlke, P. Ivashechkin, J. Hollender, A. Schaffer and P. F. X. Corvini, Water Res., 2007, 41, 4403–4412 CrossRef CAS PubMed.
- H. R. Andersen, M. Hansen, J. Kjolholt, F. Stuer-Lauridsen, T. Ternes and B. Halling-Sorensen, Chemosphere, 2005, 61, 139–146 CrossRef CAS PubMed.
- K. J. McKenzie, D. Asogan and F. Marken, Electrochem. Commun., 2002, 4, 820–824 CrossRef CAS.
- B. H. Gu, J. Schmitt, Z. H. Chen, L. Y. Liang and J. F. Mccarthy, Environ. Sci. Technol., 1994, 28, 38–46 CrossRef CAS PubMed.
- L. Zhao, Z. Q. Yu, P. A. Peng, W. L. Huang and Y. H. Dong, Environ. Toxicol. Chem., 2009, 28, 1120–1129 CAS.
- J. de Rudder, T. Van de Wiele, W. Dhooge, F. Comhaire and W. Verstraete, Water Res., 2004, 38, 184–192 CrossRef CAS.
- W. G. Sunda and D. J. Kieber, Nature, 1994, 367, 62–64 CrossRef CAS.
- H. C. Zhang and C. H. Huang, Environ. Sci. Technol., 2003, 37, 2421–2430 CrossRef CAS PubMed.
- W. Xu, H. J. Wang, R. P. Liu, X. Zhao and J. H. Qu, J. Colloid Interface Sci., 2011, 363, 320–326 CrossRef CAS PubMed.
- L. B. Zhong, J. Yin, S. G. Liu, Q. Liu, Y. S. Yang and Y. M. Zheng, RSC Adv., 2016, 6, 103438–103445 RSC.
- G. S. Zhang, H. J. Liu, J. H. Qu and W. Jefferson, J. Colloid Interface Sci., 2012, 366, 141–146 CrossRef CAS PubMed.
- J. B. Lu, H. J. Liu, X. Zhao, W. Jefferson, F. Cheng and J. H. Qu, Colloids Surf., A, 2014, 455, 11–18 CrossRef CAS.
- H. J. Liu, Y. Yang, J. Kang, M. H. Fan and J. H. Qu, J. Environ. Sci., 2012, 24, 242–247 CrossRef CAS.
- G. S. Zhang, J. H. Qu, H. J. Liu, R. P. Liu and R. C. Wu, Water Res., 2007, 41, 1921–1928 CrossRef CAS PubMed.
- D. G. Kim, S. Jiang, K. Jeong and S. O. Ko, Water, Air, Soil Pollut., 2012, 223, 837–846 CrossRef CAS.
- R. M. Cornell, R. Giovanoli and W. Schneider, J. Chem. Technol. Biotechnol., 2010, 46, 115–134 CrossRef.
- H. C. Zhang and C. H. Huang, Environ. Sci. Technol., 2003, 37, 2421–2430 CrossRef CAS PubMed.
- L. Y. Jiang, S. D. Xiao and J. M. Chen, Colloids Surf., A, 2015, 479, 1–10 CrossRef CAS.
- L. Xu, C. Xu, M. R. Zhao, Y. P. Qiu and G. D. Sheng, Water Res., 2008, 42, 5038–5044 CrossRef CAS PubMed.
- Y. Liu, Y. Guan, T. Mizuno, H. Tsuno and W. Zhu, Chromatographia, 2009, 69, 65–71 CAS.
- P. X. Wu, W. M. Wu, S. Z. Li, N. Xing, N. W. Zhu, P. Li, J. H. Wu, C. Yang and Z. Dang, J. Hazard. Mater., 2009, 169, 824–830 CrossRef CAS PubMed.
- L. Y. Jiang, L. Liu, S. D. Xiao and J. M. Chen, Chem. Eng. J., 2016, 284, 609–619 CrossRef CAS.
- L. L. Wang and H. F. Cheng, Environ. Sci. Technol., 2015, 49, 3473–3481 CrossRef CAS PubMed.
- B. Han, M. Zhang, D. Y. Zhao and Y. C. Feng, Water Res., 2015, 70, 288–299 CrossRef CAS PubMed.
- L. Yu, C. P. Wang, X. H. Ren and H. W. Sun, Chem. Eng. J., 2014, 252, 346–354 CrossRef CAS.
- S. Ben Fredj, J. Nobbs, C. Tizaoui and L. Monser, Chem. Eng. J., 2015, 262, 417–426 CrossRef CAS.
- A. T. Stone, Environ. Sci. Technol., 1987, 21, 979–988 CrossRef CAS PubMed.
- K. Lin, W. Liu and J. Gan, Environ. Sci. Technol., 2009, 43, 3860–3864 CrossRef CAS PubMed.
- J. Lu, H. Liu, X. Zhao, W. Jefferson, F. Cheng and J. Qu, Colloids Surf., A, 2014, 455, 11–18 CrossRef CAS.
- L. S. Balistrieri and J. W. Murray, Geochim. Cosmochim. Acta, 1982, 46, 1041–1052 CrossRef CAS.
- Z. J. Lu, K. D. Lin and J. Gan, Environ. Pollut., 2011, 159, 2546–2551 CrossRef CAS PubMed.
- G. S. Zhang, H. J. Liu, R. P. Liu and J. H. Qu, J. Hazard. Mater., 2009, 168, 820–825 CrossRef CAS PubMed.
- R. P. Liu, H. J. Wang, X. Zhao, S. H. Xiao and J. H. Qu, Catal. Today, 2008, 139, 119–124 CrossRef CAS.
- A. Glisenti, J. Mol. Catal. A: Chem., 2000, 153, 169–190 CrossRef CAS.
- X. Li, K. He, B. C. Pan, S. J. Zhang, L. Lu and W. M. Zhang, Chem. Eng. J., 2012, 193, 131–138 CrossRef.
- M. Toupin, T. Brousse and D. Belanger, Chem. Mater., 2004, 16, 3184–3190 CrossRef CAS.
- M. Soria-Sanchez, A. Maroto-Valiente, J. Alvarez-Rodriguez, V. Munoz-Andres, I. Rodriguez-Ramos and A. Guerrero-Ruiz, Appl. Catal., B, 2011, 104, 101–109 CrossRef CAS.
- V. Sivasankar, T. Ramachandramoorthy and A. Darchen, Desalination, 2011, 272, 179–186 CrossRef CAS.
- G. S. Zhang, J. H. Qu, H. J. Liu, R. P. Liu and G. T. Li, Environ. Sci. Technol., 2007, 41, 4613–4619 CrossRef CAS PubMed.
- J. Han, W. Qiu, S. W. Meng and W. Gao, Water Res., 2012, 46, 5715–5724 CrossRef CAS PubMed.
- J. Y. Park, B. C. Lee, J. S. Ra, J. Lee and S. D. Kim, Environ. Toxicol. Chem., 2008, 27, 535–541 CrossRef CAS PubMed.
- S. Rovani, M. T. Censi, S. L. Pedrotti, E. C. Lima, R. Cataluna and A. N. Fernandes, J. Hazard. Mater., 2014, 271, 311–320 CrossRef CAS PubMed.
- F. Wang, W. L. Sun, W. Y. Pan and N. Xu, Chem. Eng. J., 2015, 274, 17–29 CrossRef CAS.
- X. Q. Zhao, X. M. Dou, D. Mohan, C. U. Pittman, Y. S. Ok and X. Jin, Chem. Eng. J., 2014, 247, 250–257 CrossRef CAS.
- Y. Zhang, M. Yang, X. M. Dou, H. He and D. S. Wang, Environ. Sci. Technol., 2005, 39, 7246–7253 CrossRef CAS PubMed.
- J. Brugnerotto, J. Lizardi, F. M. Goycoolea, W. Arguelles-Monal, J. Desbrieres and M. Rinaudo, Polymer, 2001, 42, 3569–3580 CrossRef CAS.
- W. B. Xie and D. Y. Zhao, Sci. Total Environ., 2016, 542, 1020–1029 CrossRef CAS PubMed.
- R. O. Pereira, C. Postigo, M. L. de Alda, L. A. Daniel and D. Barcelo, Chemosphere, 2011, 82, 789–799 CrossRef CAS PubMed.
- X. Zhang, P. Y. Chen, F. Wu, N. S. Deng, J. T. Liu and T. Fang, J. Hazard. Mater., 2006, 133, 291–298 CrossRef CAS PubMed.
Footnote |
| † Electronic supplementary information (ESI) available. See DOI: 10.1039/c7ra02022h |
| This journal is © The Royal Society of Chemistry 2017 |

