 Open Access Article
Voltammetric determination of iron with catalytic system at a bismuth bulk annular band electrode electrochemically activated
Krystian Węgiela,
Justyna Robakb and
Bogusław Baś *a
*a
aFaculty of Materials Science and Ceramics, AGH University of Science and Technology, al. A. Mickiewicza 30, 30-059 Krakow, Poland. E-mail: bas@agh.edu.pl; Fax: +48 12 634 1201; Tel: +48 12 634 1201
bDepartment of Inorganic and Analytical Chemistry, Faculty of Chemistry, University of Lodz, Tamka 12, 91-403 Lodz, Poland
First published on 19th April 2017
Abstract
The short-time activated bismuth bulk annular band working electrode (BiABE) has been applied for catalytic differential pulse voltammetric (DPV) determination of trace concentrations of iron in an alkaline solution, preceded by complexation of triethanolamine. The reduction current of Fe(III) was catalytically enhanced in the presence of bromate. The experimental variables such as potential and time of activation, composition of the supporting electrolyte, differential pulse (DP) mode parameters, and influence of possible interferences on the Fe(III) signal response were tested. In the optimized conditions, the peak current was found to be proportional to the concentration of Fe(III) over the range from 1 to 476 μg L−1 (1.8 × 10⁻⁸ to 8.5 × 10⁻⁶ mol L−1) with R = 0.9993. The limit of detection (LOD) was 0.28 μg L−1 (5.0 × 10⁻⁹ mol L−1) (at S/N = 3), and sensitivity was 0.011 μA μg−1 L−1. The relative standard deviation (RSD) for 40 μg L−1 of Fe(III) was 3.3% (n = 5). The presented results were obtained without any preconcentration time. Finally, the proposed method was successfully applied for the determination of the total amount of Fe in the certified reference surface water, as well as tap and river water samples.
1. Introduction
Iron is one of the most abundant elements on earth and an essential micro-nutrient for almost all organisms. Both, its deficiency and excess from the normal permissible limit can cause serious disorders.1–3 Iron is essential for biological processes, oxidative processes of living tissues, haemoglobin and chlorophyll synthesis, oxygen transport in human bodies, mitochondrial electron transfer, nitrate reduction, and detoxification of reactive oxygen species in plants; it also provides a fundamental structure of hem enzymes, several co-factors involved in enzyme activities and myoglobin.4–7 It plays an important role in limiting growth nutrients for phytoplanktons in some parts of the ocean.8,9Iron permeates to environment as a result of industrial activities. It is used for wide range of applications, particularly in the production of steel, construction of water pipes, and as pigments in paints and plastics. Iron compounds are used as food colors and in the treatment of iron deficiency in humans.4 Iron levels in air are about 50–90 ng m−3, whereas at urban sites, levels are about 1.3 μg m−3. The median concentration in rivers has been reported to be 0.7 mg L−1. Concentrations of iron in drinking-water are normally less than 0.3 mg L−1 but may be higher where non-galvanized iron pipes are used for water distribution. Higher percentage of iron can cause food and water discoloration and may impart a metallic taste. Furthermore, it can also promote the growth of “iron bacteria”, which is an undesirable effect. Bacterial growth and multiplication in the pipes of the plumbing may also ultimately lead to their overgrowing and obstruction. According to the Regulation of the Polish Minister of Health, the maximum concentration of iron in drinking water should be 200 μg L−1.10 The World Health Organization (WHO) does not issue a health-based guideline value for iron; however, permissible values in drinking water range from 0.3 to 3 mg L−1. The average lethal dosage of iron is 200–250 mg kg−1 of body weight.11
The evaluation of iron content in environmental samples with various matrices, particularly in surface waters, is helpful and highly recommended. For this purpose, a variety of well-established methods such as inductively coupled plasma optical emission spectrometry (ICP-OES), inductively coupled plasma mass spectrometry (ICP-MS), atomic absorption spectrometry (AAS), spectrofluorometry, UV-vis spectrophotometry, chemiluminescence, ion chromatography, capillary and electrophoresis have been reported.12–14 Spectrophotometric methods have been widely used; however, these are relatively expensive for use in the ultra-trace determination of metal ions and may suffer from interferences. Moreover, the preliminary steps that can enhance the selectivity and sensitivity are essential. As an alternative to these techniques, electrochemical methods can be applied. The electrochemical methods provide very low detection limit, good selectivity, and most importantly, direct determination without any additional procedures of separation and preconcentration.
The most widely accepted method used in the determination of iron is adsorptive cathodic stripping voltammetry (Ad CSV). In this method different ligands for the complexation of iron ions are applicable and the formed complex are adsorbed onto the surface of the working electrode.15 For several years, the most sensitive working electrode used for trace-level iron detection has been the hanging mercury drop electrode. As complexing agents triethanolamine,16 cupferron,17 tributylammonium perchlorate,18 dimethylglyoxime,19 1-nitroso-2-naphthol,20 solochrome violet RS,21 catechol22 and 2,3-dihydroxynaphthalene23 have been used. Due to the intrinsic drawback of mercury electrodes, such as toxicity, great efforts have been taken to develop mercury-free solid electrodes, for example platinum electrode,24 gold 2-mercaptosuccinic acid self-assembled monolayer electrode (Au-MSA SAM),8 multi-walled carbon nanotubes (MWCNTs) modified glassy carbon electrode,25 gold nanoparticles modified carbon paste electrode26 and bismuth film electrode (BiFE).27 Several studies have reported, catalytic enhancement of the iron signal that was achieved in an alkaline solution with different oxidizers such as BrO3−, ClO2− and P2O84−.16,27–29
In the present study, for the first time, electrochemically activated bismuth bulk annular band working electrode (BiABE) has been utilized as a new type of mercury free electrode for DPV iron determination without any preconcentration time. The construction of ex situ activated BiABE and its application for Ni(II) and Co(II) determination have been precisely described previously.30 The main advantage of this electrode is easy regeneration of its surface by electrochemical activation (Eact = −1.9 V, tact = 20 s) in the presence of a tested solution (in situ method) without using of another separate activation cell (Fig. 1). Moreover, measurements at the BiABE can be carried out without the removal of oxygen from the solution. The developed method is based on Fe(III) complexation using triethanolamine (TEA) and its reduction in cathodic direction. In addition, 10-fold amplification of the Fe signal was obtained in the presence of the bromate catalytic system. The LOD obtained at the BiABE was comparable to those achieved for mercury and bismuth film electrodes. The proposed procedure was applied for the determination of total iron in certified reference materials (CRM's), river and tap water samples.
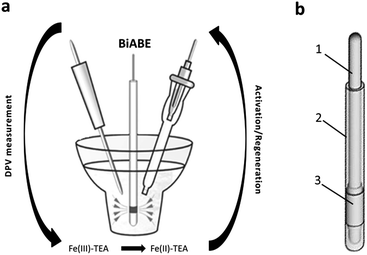 | ||
| Fig. 1 (a) Scheme of measurement system. (b) Construction of the BiABE: (1) stainless steel wire, (2) epoxy resin and (3) bismuth tube. | ||
2. Experimental
2.1. Apparatus
The voltammetric measurements were carried out using M20 multipurpose electrochemical analyser equipped with M164 electrode stand (both mtm-anko, Kraków, Poland). Data acquisition and experimental control were processed using EALab 2.1 software. The quartz cell of 10 mL volume was used with a conventional three-electrode system. The in situ activated bismuth bulk annular band electrode (BiABE, surface: 12.6 mm2) served as working electrode and prepared according to detailed description reported in our previous study.30 The Ag/AgCl/3 mol L−1 KCl double junction was used as reference electrode and a platinum wire was used as an auxiliary electrode. The results obtained at the BiABE were then compared with values obtained using hanging mercury drop electrode (HMDE, surface: 1.8 mm2) and the cyclic renewable mercury film silver-based electrode (Hg(Ag)FE, surface: 6.0 mm2) (both mtm-anko, Kraków, Poland). A magnetic stirrer (ca. 400 rpm) was used during the measurement. Water samples were mineralized using UV-digester with 400 W UV lamp (Mineral, Warszawa, Poland).2.2. Reagents and solutions
All chemicals were of analytical reagent grade. Standard solutions of Fe(III), Pb(II), Cd(II), Zn(II), Cu(II), Sn(IV), Ni(II), Co(II), Cr(III), Cr(VI), Mg(II) and Mn(II) were purchased from Merck (Certipur®, 1000 mg L−1) and diluted as required. The solutions of 1 mol L−1 sodium hydroxide, 5 mmol L−1 triethanolamine and 5 mmol L−1 potassium bromate were prepared by mixing appropriate amounts of NaOH (99.99% trace metals basis, Sigma-Aldrich), TEA·HCl (99.5%, Sigma-Aldrich) and KBrO3 (analytical grade reagent, Merck) in fourfold distilled water (with two last stages performed using a quartz still). In addition, triethanolamine and potassium bromate were purified by recrystallization. Triton X-100 purchased from Fluka was used. Furthermore, 36% fuming hydrochloric acid (for trace analysis, Sigma-Aldrich) and 30% hydrogen peroxide (for ultratrace analysis, Sigma-Aldrich) were used for the mineralization of water samples. The certified standard reference materials, Spectrapure standards surface water (SPS-SW1 Batch 114 and SPS-SW2 Batch 118) were obtained from National Institute of Standards and Technology, USA. Glassware was immersed in 6 mol L−1 hot nitric acid and rinsed repeatedly with distilled water.2.3. Sample preparation
The developed method was assessed by determination of Fe in CRMs, tap water and river water samples. The tap water samples, obtained from the laboratory, originated from the Dobczyce water reservoir. The Dobczyce reservoir is situated on Raba River, to the south of Kraków (Poland). Rudawa river water samples were collected in clean polypropylene bottles from outskirts of Kraków, and the pre-treatment consisted of successive filtration through a filter paper: Whatman® No. 1 (Sigma-Aldrich) and 0.45 μm cellulose acetate membrane filter in the Sartorius device. Recovery tests were carried out for spiked tap and river water samples. The standard solutions, to increase the Fe(III) concentration of 20 μg L−1, were added about one hour before filtration. Next, 10 mL of each water sample was transferred into a quartz tube and digested via UV irradiation for 2 h (400 W Hg lamp). To speed up the process, 0.010 mL of 30% H2O2 and 0.010 mL of 36% HCl were added. The certified surface water samples did not require pre-treatment and mineralization.2.4. Measurement procedure
The optimization of electrochemical parameters and quantitative determination of Fe(III) were performed using differential pulse voltammetry (DPV) and standard addition method. Before each series of measurements, the BiABE was polished using 0.3 or 0.05 μm alumina slurries on a Buehler polishing pad and rinsed with distilled water. Then, an aliquot of distilled water or analysed sample was pipetted into the electrochemical cell, followed by the addition of 0.150 mL of 30 mmol L−1 NaOH, 0.050 mL of 5 mmol L−1 TEA and 0.100 mL of 5 mmol L−1 KBrO3. The final volume of the tested solution was 5 mL.The determination of iron was performed with electrochemical cleaning and activation of the BiABE surface by applying activation potential (Eact) of −1.9 V with activation time (tact) of 20 s. A magnetic stirrer (ca. 200 rpm) was used during the activation step. After a rest period of 5 s, DP voltammograms were recorded, while the potential was scanned from −0.7 V to −1.3 V in the same voltammetric cell vs. Ag/AgCl/3 mol L−1 KCl electrode. For each measurement, three repetitive scans were recorded. The experiments were carried out for non-deaerated solutions at room temperature.
3. Results and discussion
3.1. Activation conditions of the BiABE
The bismuth bulk electrode (BiBE) requires renovation of their surface before each measurement for ensuring reliable results. In particular, purification of the adsorbed surface-active compounds and products of electrochemical reactions is necessary. Moreover, Bi(III) ions are very susceptible to hydrolysis in neutral and alkaline solutions. In highly alkaline media (pH > 10), it has been shown that Bi(III), instead of hydrolysing, forms stable complexes with OH− ions (Bi(OH)2+) that are soluble in aqueous media and can undergo electrochemical reduction on the electrode surface.31 Hence, the bismuth film electrode must be obtained by applying a constant charge in a separate solution (ex situ method).27 It should be noted that in similar conditions mercury ions were also hydrolysed, and hence mercury film electrodes (MFEs) are inoperative. In addition to these forms, bismuth formed oxides such as Bi2O3, particularly when in contact with atmospheric air. At a potential around −1.0 V, Bi2O3 could be reduced to metallic bismuth and be deposited on the surface of the electrode. The studies presented herein have shown that applying more negative activation potential resulted in a fast reduction of these bismuth compounds and effective cleaning of the electrode surface in the tested solution.The influence of activation potential and time on the peak current Fe(III)–TEA complex was investigated for supporting electrolyte containing 40 μg L−1 of Fe(III). The voltammograms shown in Fig. 2 were recorded without activation potential (curve a) and after applying activation potential in the range from −1.3 to −2.3 V vs. Ag/AgCl/3 mol L−1 KCl (curves b–g). The Fe(III) signals increased in the tested range, but above −1.9 V there was a significant deformation and the appearance of disruption. Furthermore, repeatability of the recorded subsequent signals got worse. The effect of activation time on Fe(III) peak height was studied in the range from 5 to 120 s with activation potential of −1.9 V. As illustrated in Fig. 2 (inset), initially the peak current increased linearly, and after 40 s, it increased slightly. Based on these experiments, it was established that activation potential of −1.9 V and activation time of 20 s provided the best regeneration effect of the BiABE.
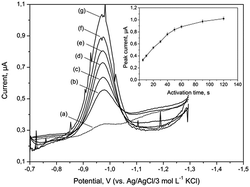 | ||
| Fig. 2 DP voltammograms of 40 μg L−1 of Fe(III) recorded at BiABE for the following activation potential (Eact): (a) without activation; (b) −1.3; (c) −1.5; (d) −1.7; (e) −1.9; (f) −2.1 and (g) −2.3 V. Inset: dependence of striping peak current on activation time in the range from 5 to 120 s. Other conditions were the same as shown in Table 1. The error bars represent standard deviation (n = 3). | ||
3.2. Effect of sodium hydroxide, ligand (TEA) and potassium bromate concentrations
Formation of Fe(III)–TEA complexes and their stability were dependent on pH and composition of the supporting electrolyte. Performed studies and available literature data have indicated that the highest sensitivity and reproducibility of results were obtained in an alkaline solution. Sodium hydroxide was used as the main component of the supporting electrolyte. The effect of NaOH concentrations was tested in the range from 12 to 112 mmol L−1 (Fig. 3a) for a solution containing 5 mmol L−1 of TEA, 5 mmol L−1 of KBrO3 and 40 μg L−1 of Fe(III). Highest sensitivity, well-shaped peaks and high ratio of peak currents to the background level were achieved for 30 mmol L−1 of NaOH, and therefore this concentration was therefore chosen for subsequent experiments.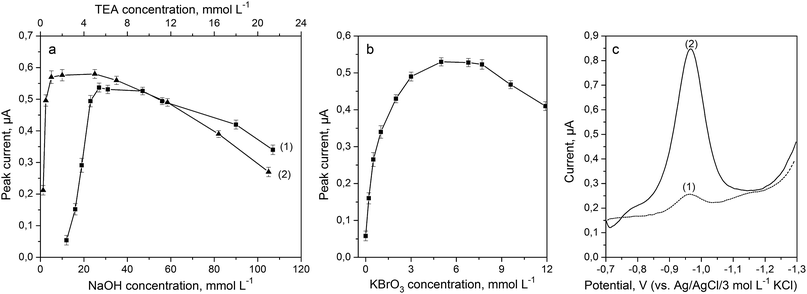 | ||
| Fig. 3 Effect of the concentration of NaOH (a-1), TEA (a-2) and KBrO3 (b) on the striping peak current in the presence of 40 μg L−1 of Fe(III). (c) DP voltammograms recorded at the BiABE in a solution containing 40 μg L−1 of Fe(III) (1) and after addition of 5 mmol L−1 of KBrO3 (2). Other parameters were the same as shown in Table 1. The error bars represent the standard deviation (n = 3). | ||
Triethanolamine was used as a complexing agent for Fe(III) determination. The effect of TEA concentration on Fe(III) peak heights was examined in the range from 0.25 to 21 mmol L−1 for a solution containing 30 mmol L−1 of NaOH, 5 mmol L−1 of KBrO3 and 40 μg L−1 of Fe(III); the results are presented in Fig. 3a. The stripping peak current increased with an increase in the concentration of the ligand and was maximum for 5 mmol L−1 of TEA. Hence, this concentration was used for subsequent experiments.
The addition of potassium bromate into the supporting electrolyte caused catalytic enhancement of the Fe(III) signal. Effect of KBrO3 concentration was examined in the range from 0 to 12 mmol L−1 for a solution containing 30 mmol L−1 of NaOH, 5 mmol L−1 of TEA and 40 μg L−1 of Fe(III), and the obtained results are illustrated in Fig. 3b. It can be observed that Fe(III)–TEA peak height increased up to 5 mmol L−1 of bromate and then gradually decreased for concentrations above 7 mmol L−1. Fig. 3c has depicted voltammograms recorded for Fe(III)–TEA complex before (curve 1) and after (curve 2) addition of KBrO3 into the solution. It was notable that Fe(III) response increased about 10-fold. Thus, a KBrO3 concentration of 5 mmol L−1 was chosen for subsequent experiments.
3.3. Influence of DP parameters
To optimize the conditions of DPV determination of iron, the following instrumental parameters were varied: step potential (Es), pulse amplitude (dE), and pulse width (timp). Optimal values applied in subsequent studies are summarized in Table 1.| Parameter | Value | Unit |
|---|---|---|
| Activation potential (Eact vs. Ag/AgCl) | −1.9 | V |
| Activation time (tact) | 20 | s |
| Pulse amplitude (dE) | 30 | mV |
| Step potential (Es) | 3 | mV |
| Current sampling time (ts) | 15 | ms |
| Waiting time (tw) | 15 | ms |
| Pulse period (timp = tw + ts) | 30 | ms |
| Sodium hydroxide | 30 | mmol L−1 |
| Triethanolamine | 5 | mmol L−1 |
| Potassium bromate | 5 | mmol L−1 |
Influence of step potential (Es) on the stripping peak current of Fe(III) was tested in the range of 1–7 mV. Higher values of Es resulted in an increase of stripping peak current and the background level. Further studies were therefore carried out using a step potential of 3 mV.
Influence of the pulse amplitude (dE) on the analytical signal was studied in the range of 10–60 mV. The effect of amplitude values on the stripping peak current was almost linear in the tested range, but the background current increased above 30 mV particularly on the right side of the peak. Hence, dE value of 30 mV, which was characterized by the best signal-to-background ratio, was chosen in all further work.
The effect of pulse width (timp = tw (waiting time) + ts (current sampling time)) was examined in the range from 10 to 60 ms. In each case, tw = ts. It was found that stripping peak values of Fe(III)–TEA complexes as well as the background level decreased for longer pulse times. In view of these results, pulse width of 30 ms was chosen for further experiments.
3.4. Comparison of the BiABE with mercury electrode
One of the most sensitive methods was based on the adsorption of a metal ion complex with suitable ligands on a hanging mercury drop electrode (HMDE). The proposed method has exhibited advantages in terms of high sensitivity, reproducibility and linearity. However, use of mercury has to be avoided because of its toxicity. The limitation of mercury or its soluble salts from the analytical procedure was partially overcome by the use of cyclic renewable mercury film silver based electrode (Hg(Ag)FE). Both the mentioned electrodes were compared with BiABE. Fig. 4 displays current densities from the HMDE, Hg(Ag)FE and BiABE recorded in supporting electrolyte containing 30 mmol L−1 of NaOH, 5 mmol L−1 of TEA, 5 mmol L−1 of KBrO3 and 40 μg L−1 of Fe(III), in addition to Hg(Ag)FE 0 and 20 μg L−1 of Fe(III). The highest value was achieved for the BiABE. A well-shaped and symmetrical reduction peak of Fe(III)–TEA complex was observed at −0.96 V, and the width of the peak at half-height was 101 ± 8 mV. The peak potentials for HMDE (Ep,Fe ≈ −0.99 V) and Hg(Ag)FE (Ep,Fe ≈ −1.05 V) were shifted towards much negative potential than that for the BiABE. In case of Hg(Ag)FE, an additional peak in the background was recorded at potential −1.15 V. Thus, determination of iron using this electrode was problematic and required the use of additional background subtraction procedure.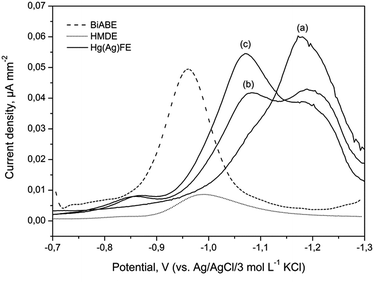 | ||
| Fig. 4 Comparison of DPV current densities at the HMDE (dotted line), BiABE (dashed line) for 40 μg L−1 of Fe(III) and Hg(Ag)FE (solid line) for (a) 0, (b) 20 and (c) 40 μg L−1 of Fe(III). Other conditions were the same as shown in Table 1. | ||
3.5. Analytical performance and stability of the BiABE
A series of DP voltammograms for increasing Fe(III) concentration with corresponding calibration curve were recorded without any preconcentration time (Fig. 5). The presented voltammograms were obtained after automatic background subtraction. The sensitivity of DPV determination of Fe(III) was 0.011 μA μg−1 L−1. The calibration plot was linear from 1 to 476 μg L−1 (1.8 × 10⁻⁸ to 8.5 × 10⁻⁶ mol L−1) and was in agreement with equation y = (0.011 ± 0.001)c + (0.002 ± 0.001), where y and c represent peak current (μA) and Fe(III) concentration (μg L−1), respectively. The correlation coefficient R was 0.9993. LOD was calculated as 3 times the standard deviation of the intercept over the slope of the calibration curve and was 0.27 μg L−1 (5.0 × 10⁻⁹ mol L−1). Obtained results were compared with results achieved for other electrodes and have been summarized in Table 2. The estimated LOD was much lower than the concentration of iron in natural samples of drinking water and surface water, which proved that the BiABE electrode could be used for the analysis. Moreover, the presented results were comparable to those obtained at the bismuth film electrode (BiFE).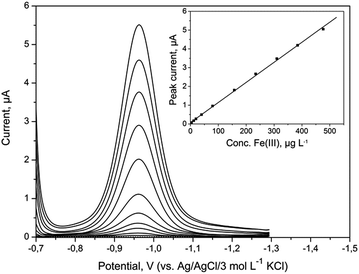 | ||
| Fig. 5 DP voltammograms obtained at BiABE in non-deaerated supporting electrolyte containing increasing concentrations of Fe(III). Concentration of Fe(III) from bottom to top: blank, 1, 4, 12, 20, 40, 79, 157, 234, 310, 385 and 476 μg L−1. Inset: corresponding calibration plot. Other parameters were the same as shown in Table 1. | ||
| Method/(electrode) | Linear range [μmol L−1] | LOD/tacc [nmol L−1]/[s] | Ref. |
|---|---|---|---|
| DP AdSV/(HMDE) | 0.003–0.107 | 0.9/20 | 19 |
| DP AdSV/(HMDE) | — | 0.4/30 | 32 |
| SW SV/(Au-MSA SAM) | 0.0001–0.006 | 0.03/600 | 8 |
| FIA/(GCE-MWCNTs) | 0–10![[thin space (1/6-em)]](https://www.rsc.org/images/entities/char_2009.gif) 000 000 |
3.0/0 | 25 |
| DP ASV/(CPE-DTDA) | 0.0001–0.100 | 0.05/40 | 26 |
| DPV/(BiFE) | 0.25–1.0 | 7.7/0 | 27 |
| DPV/(BiABE) | 0.18–8.5 | 5.0/0 | This work |
Short-term stability of this electrode was checked by recording successive DP voltammograms for the supporting electrolyte. For twenty runs, voltammetric profiles of the BiABE remained unaltered. Afterwards, height of peak currents obtained for five different samples with the supporting electrolyte containing 40 μg L−1 of Fe(III) was compared. The calculated RSD was equal to 3.3%. The response of the BiABE is stable when the electrode is used continuously, which prevents oxidation from taking place on the electrode's surface. Storage of the BiABE under oxygen, easy access and use of alkaline electrolyte causes the formation of oxides and hydroxides on the surface. Hence, the BiABE requires mechanical polishing (0.05 μm Al2O3) before and after each long measurement cycle.
3.6. Tolerance to interfering species
Possible interferences in the determination of 40 μg L−1 Fe(III) were examined under optimum experimental conditions, as described in Table 1. The number of metal ions that could potentially interfere were examined: Zn(II), Cu(II), Sn(IV), Ni(II), Co(II), Mn(II), Mg(II) and Cr(III) added at 100-fold mass concentration excess over Fe(III) did not interfere and no signals were observed over the potential range from −0.7 to −1.3 V. Interferences were observed in the presence of Cr(VI) and Cd(II). It was found that 50-fold excess of Cr(VI) resulted in a decrease of Fe(III) signal to 35% of its original value. The effect of Pb(II) and Cd(II) concentration on Fe(III) peak heights was examined in the range from 0.0 to 4.0 mg L−1 and 0.0 to 3.5 mg L−1, respectively. The results are presented in Fig. 6. Pb(II) gave a peak at −0.78 V, which was distinct from the Fe(III) peak. Hence, the proposed procedure can be applied to simultaneous determinations of lead and iron. As can be seen in Fig. 6, the peak potential of Cd(II) was found to be very close to that of Fe(III) peak. For about 87-fold Cd(II) excess, both the measured signals overlap. However, concentration of cadmium in the environmental samples was much lower than that of iron.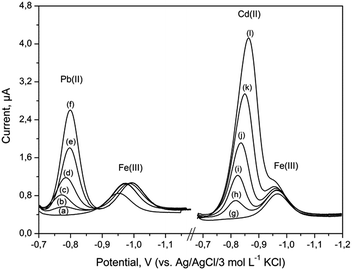 | ||
| Fig. 6 DP voltammograms for 40 μg L−1 of Fe(III) recorded at the BiABE after addition of (a) 0, (b) 2.0, (c) 2.5, (d) 3.0, (e) 3.5, (f) 4.0 mg L−1 of Pb(II) and (g) 0, (h) 0.5, (i) 1.0, (j) 1.5, (k) 2.5, (l) 3.5 mg L−1 of Cd(II). Other parameters were the same as shown in Table 1. | ||
Voltammetric methods are particularly susceptible to organic matter and the presence of different types of surfactants in natural samples. To study the influence of surface-active substances on the voltammetric response of Fe(III), a nonionic surfactant Triton X-100 was used. Effect of Triton X-100 concentration was examined in the range from 0.25 to 2 mg L−1 for solution containing 40 μg L−1 of Fe(III). The addition of Triton X-100 at concentrations 0.5 and 1.0 mg L−1 caused a decrease in the stripping peak current up to 30% and 70%, respectively. Addition of 2 mg L−1 of Triton X-100 caused complete loss of the signal. Therefore, when performing determination of iron in natural water samples as per the proposed procedure, a mineralisation by UV irradiation of the sample is necessary.
3.7. Analytical application of the BiABE
The described method allows the determination of the total content of iron. Smaller quantities of Fe(II) ions present in real samples were immediately oxidized to Fe(III) ions by given procedure of mineralization and under the influence of bromate. Hence, the speciation analysis of iron was not possible using this method.The proposed procedure was utilized for the determination of iron at various concentrations in CRMs: SPS-SW1 and SPS-SW2 (surface waters). Voltammograms obtained for the determination of iron in SPS-SW2 sample are presented in Fig. 7. Four analytical scans were recorded for each sample after addition of standard solutions.
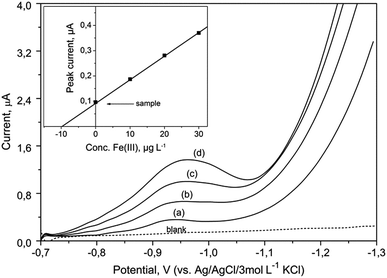 | ||
Fig. 7 DP voltammograms recorded for determination of iron in the certified reference waters (SPS-SW2) using the BiABE in the supporting electrolyte without deaeration. Curves: blank, (a) SPS-SW2 diluted (1![[thin space (1/6-em)]](https://www.rsc.org/images/entities/char_2009.gif) : :![[thin space (1/6-em)]](https://www.rsc.org/images/entities/char_2009.gif) 10), (b) 10, (c) 20 and (d) 30 μg L−1 of Fe(III). Other parameters were the same as shown in Table 1. The inset figure illustrates the corresponding standard addition plot. 10), (b) 10, (c) 20 and (d) 30 μg L−1 of Fe(III). Other parameters were the same as shown in Table 1. The inset figure illustrates the corresponding standard addition plot. | ||
The concentrations of Fe in all the water samples were calculated by means of 3 standard additions method. The results of determination for all samples are presented in Table 3. The obtained results for iron are in good agreement with total reference value in the CRM samples. The tap and river water samples, prepared as described in Section 2.3, were also analyzed. The presented values of iron concentrations were lower than 200 μg L−1 for drinking water, which was in accordance with the Regulation of the Polish Minister of Health. Obtained recovery results were satisfactory for both the spiked samples.
| Sample | Concentration of Fe [μg L−1] | |||
|---|---|---|---|---|
| Added | Found x ± s | Recovery [%] | Certified value | |
| Tap water | 0 | 23.2 ± 1.2 | — | — |
| 20.0 | 41.4 ± 1.9 | 91.0 | — | |
| Rudawa river water | 0 | 72.5 ± 2.7 | — | — |
| 20.0 | 90.2 ± 3.1 | 88.5 | — | |
| SPS-SW1 | 0 | 19.1 ± 1.1 | — | 20.0 ± 1.0 |
| SPS-SW2 | 0 | 97.3 ± 3.8 | — | 100.0 ± 1.0 |
4. Conclusions
The proposed study is the first of its kind wherein short-time activated bismuth bulk annular band electrode has been used for iron determination by means of DPV method without any preconcentration time. The benefits of sensor are easy cleaning and regeneration of the BiABE surface in the presence of an alkaline solution by applying activation potential before each measurement. The presented method shows better sensitivity and lower detection limit than that obtained for the hanging mercury drop electrode utilizing Fe(III)–TEA detection system. The detection limit at the BiABE was 0.28 μg L−1 (5.0 × 10⁻⁹ mol L−1), and it was comparable to the value achieved for bismuth film electrode. Moreover, measurements at BiABE could be carried out without removing oxygen from the solution. The proposed procedure can be applied to total iron determination in natural water samples, combined with low toxicity of bismuth and offered improved scope for extensive use of the BiABE.Acknowledgements
This study was supported by Polish National Science Centre (Project No. 2015/19/B/ST5/01380).References
- S. Schnell, R. Ratering and K. H. Jansen, Environ. Sci. Technol., 1998, 32, 1530 CrossRef CAS.
- P. Ugo, L. M. Moretto, A. D. Boni, P. Scopece and G. A. Mazzocchin, Anal. Chim. Acta, 2002, 474, 147 CrossRef CAS.
- H. Zhanga, G. Zhanga, J. Xub, Y. Wena, B. Lua, J. Zhanga and W. Ding, Sens. Actuators, B, 2016, 230, 123 CrossRef.
- S. A. A. Elsuccary and A. A. Salem, Talanta, 2015, 131, 108 CrossRef CAS PubMed.
- E. S. Gurzau, C. Neagu and A. E. Gurzau, Ecotoxicol. Environ. Saf., 2003, 56, 190 CrossRef CAS PubMed.
- T. H. Bothwell, R. W. Charlton, I. D. Cook and C. A. Finch, Iron Metabolism in Man, Blackwell, Oxford, 1979, p. 576 Search PubMed.
- A. Cotton and G. Wilkinson, The Biochemistry of Iron in Advanced Inorganic Chemistry, Wiley Interscience, USA, 5th edn, 1988, p. 1336 Search PubMed.
- R. K. Shervedani, A. H. Mehrjardi and A. A. Farsani, Anal. Chim. Acta, 2007, 601, 164 CrossRef CAS PubMed.
- W. G. Sunda and S. A. Huntsman, Mar. Chem., 1995, 50, 189 CrossRef CAS.
- Polish Ministry of Health Regulation on the quality of water intended for human consumption, Journal of Laws of 6 April 2007.
- World Health Organization (WHO), Iron in drinking-water, in Background document for development of WHO guide lines for drinking-water quality, WHO/SDE/WSH/03.04/08, 2003 Search PubMed.
- V. K. Gupta, R. Dobhal, A. Nayak, S. Agarwal, D. P. Uniyal, P. Singh, B. Sharma, S. Tyagi and R. Singh, Crit. Rev. Anal. Chem., 2012, 42, 245 CrossRef CAS.
- S. Khan, R. Dashora, A. K. Goswami and D. N. Purohit, Rev. Anal. Chem., 2004, 23, 1 CrossRef CAS.
- E. P. Achterberg, T. W. Holland, A. R. Bowie, R. F. C. Mantoura and P. J. Worsfold, Anal. Chim. Acta, 2001, 442, 1 CrossRef CAS.
- M. Lu, N. V. Rees, A. S. Kabakaev and R. G. Compton, Electroanalysis, 2012, 24, 1693 CAS.
- J. Golimowski, Anal. Lett., 1989, 22, 481 CrossRef CAS.
- J. Wang, J. Lu, D. Luo, J. Wang and B. Tian, Electroanalysis, 1997, 9, 1247 CrossRef CAS.
- M. H. P. Azar and B. M. Fatemi, Microchem. J., 2000, 65, 199 CrossRef.
- A. Bobrowski and A. Królicka, Electroanalysis, 2003, 15, 591 CrossRef CAS.
- T. Nagai, A. Imai, K. Matsushige, K. Yokoi and T. Fukushima, Limnology, 2004, 5, 87 CrossRef CAS.
- P. C. Nascimento, L. D. Del-Fabro, D. Bohrer, L. M. de Carvalho, M. B. Rosa and S. M. Noremberg, Electroanalysis, 2008, 20, 1078 CrossRef CAS.
- J. S. Echeandia, Talanta, 2011, 85, 506 CrossRef PubMed.
- L. M. Laglera, G. Battaglia and C. M. G. van den Berg, Mar. Chem., 2011, 127, 134 CrossRef CAS.
- N. Scheers, T. Andlid, M. Alminger and A. Sandberg, Electroanalysis, 2010, 22, 1090 CrossRef CAS.
- D. I. Anguiano, M. G. Garcia, C. Ruiz, J. Torres, I. A. Lemus, L. A. Contreras, Y. V. Gomez and E. Bustos, Int. J. Electrochem., 2012, 739408, 6 Search PubMed.
- M. B. Gholivand, B. Geravandi and M. H. Parvin, Electroanalysis, 2011, 23, 1345 CrossRef CAS.
- A. Bobrowski, K. Nowak and J. Zarębski, Anal. Bioanal. Chem., 2005, 382, 1691 CrossRef CAS PubMed.
- J. Zarębski, Fresenius' J. Anal. Chem., 1996, 356, 299 Search PubMed.
- O. Fisher and A. Votanova, Collect. Czech. Chem. Commun., 1974, 39, 2920 CrossRef.
- B. Baś, K. Węgiel and K. Jedlińska, Anal. Chim. Acta, 2015, 881, 44 CrossRef PubMed.
- A. Economou, Trends Anal. Chem., 2005, 24, 334 CrossRef CAS.
- M. M. Ghoneim, A. M. Hassanein, E. Hammam and A. M. Beltagi, Fresenius. J. Anal. Chem., 2000, 367, 378 CrossRef CAS PubMed.
| This journal is © The Royal Society of Chemistry 2017 |
