 Open Access Article
Creative Commons Attribution 3.0 Unported Licence
Tribochemistry of unsaturated fatty acids as friction modifiers in (bio)diesel fuel
Maria Isabel De Barros Bouchet *a,
Jean Michel Martin
 a,
Cyrielle Foresta,
Thierry le Mogne
 a,
Michaël Mazarinb,
José Avilac,
Maria C. Asensioc and
Gregory L. Fisher
 d
d
aUniversity of Lyon, Ecole Centrale de Lyon, LTDS, 69380, Ecully, France. E-mail: maria-isabel.de-barros@ec-lyon.fr
bTotal Marketing Services, CReS, BP22, 69360 Solaize, France
cAntarès Beamline, Synchrotron SOLEIL, University Paris-Saclay, France
dPhysical Electronics, 18725 Lake Drive East, Chanhassen, MN 55317, USA
First published on 29th June 2017
Abstract
The impact of fatty acids on the lubricity of diesel and biodiesel fuels was investigated in steel/steel contacts at two different temperatures of 40 °C and 100 °C. The addition of 7% v/v Fatty Acid Methyl Esters (FAMEs) to fuels, to form biodiesel, lubricates the steel–steel contact and the friction coefficient is reduced by about 30%. Further addition of fatty acids leads to a significant reduction in friction by a factor of 2 at the highest temperature of 100 °C. Some unsaturated fatty acid additives boost the friction reduction by a synergistic effect with the biofuel. The analysis of worn surfaces by XPS revealed the formation of an insulating film mainly located at the center of the tracks and the disappearance of carboxylic groups. PM-IRRAS analysis demonstrated the lack of carbon double bonds in the tribofilm and the presence of some esters (iron and/or organic soaps). By combining high-resolution photoemission soft X-ray absorption and SIMS studies, we found that the extreme surface of the tribofilm is formed by planar arrangements of sp2-rich molecules such as quinones and/or graphene oxides. It is thought that under the effects of shearing, temperature and possibly oxygen from air or fuel, complex chemical reactions between FAME and unsaturated additives occur in the diesel matrix generating a new tribofilm material on the steel surface. As double bonds are involved in the process, the basic tribochemistry mechanism is thought to be related to a reticulation process catalyzed by the formation of oxide particles in the sliding interfacial contact zone accompanied by an aromatization of the fatty acids at the extreme surface.
I. Introduction
Over recent decades, fuel economy and the long-term impact of exhaust greenhouse gas emissions on the environment have become major issues of concern, especially in the automotive industry. The development of new fuels directly from renewable natural raw materials and the design of new mechanical components for ever more efficient combustion engines (lightweight body structures, direct-injection systems for engines)1–3 are crucial steps in order to address current economical and environmental concerns in transportation. As an example, new low cost biodiesels such as BTL which is already implemented need the presence of lubricity additives to enhance their own natural lubricating properties and optimize fuel economy.4,5The lubricating properties of biodiesel formulated for fuel injection systems are now mainly evaluated using a High-Frequency Reciprocating Rig (HFRR) according to international standards.6,7 However, it would also be interesting to evaluate the friction properties of biofuels under different stress conditions in order to investigate their impact on other mechanical parts of the engine where they may be present, together with the lubricant oil, and have a long term action. This is the case of the piston ring/cylinder liner contact where the sliding speed in relative motion varies over a broad range and the contact pressure is moderate leading to the existence of mixed and boundary lubrication regimes.
This paper investigates the effects of fatty acid additives on the lubricating properties of biodiesel fuels containing Fatty Acid Methyl Esters (FAMEs). FAMEs which constitute the major components of so-called biodiesel are produced by a trans-esterification process where the glycerol in triglycerides is replaced by methanol.8–10 They can be used directly as a substitute for diesel fuels, or in a blend “BX” (where X is percentage by volume of FAME in the final blend) with a conventional diesel fuel matrix.8 FAMEs are molecules composed of a polar head and a long fatty acid chain and therefore provide good mixed and boundary lubrication effects even when blended at very low concentrations.8 However, some authors have pointed out that fuel quality is highly dependent on oil source and, in particular, that the chain length of FAME molecules has a strong impact on fuel properties.9,11 Moreover, the lubricating capability is also governed by the contaminants present in the FAME mixtures12 or is linked to the residual acidity of the biodiesel.13 Fuel quality and efficiency therefore need to be continuously improved for reliable usage in automotive technical systems.
In this paper, the improvement in the lubricating properties of biodiesel by fatty acid additives was investigated at 100 °C. Special attention was paid to the formation of the protective lubricating tribofilm on steel contact surfaces and the mechanism by which friction and wear are reduced. The commercial friction modifier (FM) additive used in this study was composed of a mixture of fatty acids containing both saturated (stearic acid) and unsaturated acids (including oleic acid). To obtain a better understanding of the reaction mechanism of this commercial additive in the B7 matrix, some pure fatty acids (nonanoic, stearic, oleic and linoleic) were also studied as reference compounds.
II. Methodology
Materials and methods for tribometry
The lubricating properties of diesel fuel B0 and biodiesel fuel B7 (7% v/v FAMEs in conventional diesel fuel) were investigated. The FAMEs used to form the biodiesel were derived from rapeseed oil and the 7% level by volume corresponds to the maximum value marketed in gas stations in France. We first studied the action of a commercial additive package used as a friction modifier (FM) containing a mixture of saturated and unsaturated fatty acids at a concentration of 800 mg kg−1. We then studied three pure fatty acids with a chain length composed of 18 carbon atoms![[thin space (1/6-em)]](https://www.rsc.org/images/entities/char_2009.gif) :
:![[thin space (1/6-em)]](https://www.rsc.org/images/entities/char_2009.gif) stearic acid (C18
stearic acid (C18![[thin space (1/6-em)]](https://www.rsc.org/images/entities/char_2009.gif) :
:![[thin space (1/6-em)]](https://www.rsc.org/images/entities/char_2009.gif) 0), oleic acid (C18
0), oleic acid (C18![[thin space (1/6-em)]](https://www.rsc.org/images/entities/char_2009.gif) :
:![[thin space (1/6-em)]](https://www.rsc.org/images/entities/char_2009.gif) 1) and linoleic acid (C18
1) and linoleic acid (C18![[thin space (1/6-em)]](https://www.rsc.org/images/entities/char_2009.gif) :
:![[thin space (1/6-em)]](https://www.rsc.org/images/entities/char_2009.gif) 2), alone or in a mixture at the same concentration. All chemicals were from Sigma-Aldrich. To improve understanding, we used methyl mono-oleate compound (Sigma-Aldrich) to model the FAME additive. Considering the very low viscosity of diesel fuel compared with engine oils, the calculation of the lambda ratio using the classical EHL equations showed that lubrication mainly operated in the boundary and mixed regimes.
2), alone or in a mixture at the same concentration. All chemicals were from Sigma-Aldrich. To improve understanding, we used methyl mono-oleate compound (Sigma-Aldrich) to model the FAME additive. Considering the very low viscosity of diesel fuel compared with engine oils, the calculation of the lambda ratio using the classical EHL equations showed that lubrication mainly operated in the boundary and mixed regimes.
For tribological tests, a reciprocating cylinder-on-flat tribometer was used in order to simulate the piston ring/cylinder liner contact geometry and dynamics in thermal engines. Friction pairs were made of AISI 52100 steel and both sliding surfaces had a mirror surface finish (Ra equal to 2 nm). The wear track was 5 mm long and the sinusoidal sliding speed was 120 mm s−1 at its maximum value (corresponding to a frequency of 7 Hz). A normal load of 50 N was applied ensuring an initial maximum contact pressure of 270 MPa, which is in good agreement with practical values in the target application. In a previous study, we investigated the effect of temperature and showed that friction reduction does not occur at ambient temperature.14 The temperature in this study was therefore fixed at 100 °C. Using diesel fuels as lubricants in the tribometer, higher temperatures cannot be used because of strong evaporation. The test duration was 2000 cycles and all tests were reproduced three times in order to have a good repeatability. The diesel fuel solution was deposited in a small reservoir surrounding the contact area and the two surfaces (cylinder and flat) were completely immersed in the solution prior to the test. The temperature of the whole system was controlled by a thermocouple. At 100 °C, as there is little evaporation of diesel fuel during the friction test there was no need to replenish the reservoir during the test.
Surface characterization
After friction tests with blended (bio)diesels, the flat samples were first washed with pure diesel (B0) in an ultrasonic bath to remove excess fatty acid additives from the surface. However, a thin layer of B0 was found to remain on the surface and did not evaporate easily so that the tribofilm was optically invisible. The surface was therefore further washed in n-heptane to remove the excess fuel layer and the tribofilm islands could then be clearly revealed by optical imaging. We noticed that gently rubbing of the worn surface with paper partially removed the tribofilm and concluded that the tribofilm was not strongly attached to the surface. X-Ray Photoelectron Spectroscopy (XPS), IR spectroscopy and Atomic Force Microscopy (AFM) surface analyses were carried out to characterize the tribofilm and also the adsorbed layers outside the wear track.XPS surface analysis was carried out using an ULVAC-PHI Versa Probe II spectrometer equipped with a monochromatized AlKα X-ray source at 1486.6 eV on neat additives and tribofilms, respectively. The size of the X-ray spot was set to 50 μm and the energy scale was calibrated with reference to the C 1s peak at a binding energy (BE) of 284.8 eV (C–C, C–H). The chemical elements present in the tribofilm were first identified on a survey spectrum over a wide binding energy range of 0–1200 eV. Afterwards, a detailed scan of the individual elements identified was acquired over a smaller range of 15–25 eV to establish their different chemical states and to perform quantitative analysis using PHI multipack software. The chemical species corresponding to each binding energy were attributed using standard materials and the XPS handbook and online database. XPS photo-peaks were fitted with a Shirley background, and quantification was done using Scofield's sensitivity factors. All parameters needed for fitting such as the peak area ratio, the difference between doublet binding energies and the Full-Width at Half-Maximum (FWHM) were fixed to obtain the most appropriate chemical meaning. To determine the chemistry of the additives and binary mixtures, a drop of liquid was deposited on the relevant sample-holder mounted on a heat exchanger system provided with a thermocouple. The “sample holder + lubricant droplet” system was then cooled to a temperature of −120 °C under an argon gas pressure of about 105 Pa by the circulation of liquid nitrogen. This cooling procedure takes a few minutes (around 10 min) before the solid state is obtained. A pumping system providing a primary and secondary vacuum in the inlet chamber was then run until the desired pressure below 10−8 hPa was obtained, and the sample holder was transferred from the inlet chamber into the ultrahigh vacuum XPS analysis chamber. Although the liquid freezing procedure was relatively fast, some molecular re-organization at the surface may occur.
In addition to standard laboratory XPS, a tunable X-ray energy beam was used from a synchrotron radiation source (ANTARES line in SOLEIL synchrotron in Paris). High resolution photoemission spectra (PES) and X-ray Absorption Near-Edge Structure (XANES) were recorded on carbon and oxygen 1s levels using 350 eV and 700 eV X-ray energies, respectively. The advantage of using low energy X-rays for XPS analysis is the reduction of the effective attenuation length (EAL) that was calculated to be 0.65 nm for the carbon C 1s peak under our conditions compared with around 4 nm for the laboratory equipment with an X-ray energy of 1486.6 eV. The beam diameter was set to 100 microns allowing accurate analysis of the inside and outside wear scar. The photo-peaks were fitted using a Shirley background, and quantification was done using Scofield's sensitivity factors. Photoelectron emission microscopy (PEEM) was successfully performed inside the wear scar using a 0.1 μm diameter X-ray beam and retrospective analysis made it possible to obtain chemical maps at specific energies corresponding to the different chemical states present in the C 1s and O 1s photo-peaks.
The IR technique used in this study was Polarization Modulation-Infrared Reflection-Adsorption Spectroscopy (PM-IRRAS). This is used for the characterization of thin films or monolayers on metal substrates, because it has the advantage of high surface sensitivity, and because of the surface selection rule. In addition, it has the advantage over the conventional IRRAS mode in that the modulated reflectivity is independent of the isotropic adsorption from gas or bulk water. Consequently the interfering effect of water vapor and carbon oxide can be more or less eliminated. PM-IRRAS spectra were recorded from 4 different regions of the tribofilm to check the reproducibility of the measurements.
AFM observations and measurements were made to estimate the film aspect and thickness. A VEECO® CP-II atomic force microscope was used in tapping mode with a sharp silicon probe. The AFM was also equipped to measure the electrical contact resistance between the tip and the surface.
TOF-SIMS analysis was performed using a PHI nanoTOF II (Physical Electronics, Chanhassen, Minnesota, USA) equipped with a 30 kV cluster liquid metal ion gun (LMIG). The cluster LMIG column was oriented at 40° from surface normal and was operated so that the sample was interrogated by a mass-pure Bi3++ analytical ion beam. The DC current of the Bi3++ analytical ion beam was 1 nA, and the analytical field-of-view (FOV) was 300 μm × 300 μm for each mosaic tile. A primary ion dose density (PIDD) of 1.53 × 10¹⁰ Bi3++ per cm2, averaged over 256 × 256 image pixels, was delivered to each mosaic tile in a 6.0 mm × 2.4 mm image area. Data in both positive and negative secondary ion polarities was collected from the same 6.0 mm × 2.4 mm image area, and this area contained both worn and unworn regions about the tribo-test wear-track. Charge compensation was achieved using 10 eV electrons, and the sample was nominally maintained at room temperature throughout each analysis. The total time to obtain each large area image was approximately 3 hours 50 minutes. The resulting mass resolution (m/Δm) over the entire image area was >4000 (FWHM) and the average mass accuracy (W) was <20 ppm over the mass calibration range. In the course of each acquisition, mass spectral information at each image pixel was collected in the mass-to-charge (m/z) range of 0–1850 and saved in a raw data stream file. Saving the complete mass spectrum at each image pixel allowed off-line data reduction (i.e. retrospective analysis and data mining) for post-acquisition generation of 2D chemical and molecular maps. All spectral and image data was produced using TOF-DR software (Physical Electronics, Chanhassen, Minnesota, USA). No data preconditioning was employed, and the only enhancements used were image addition and image intensity scaling for visualization.
III. Results
Friction results
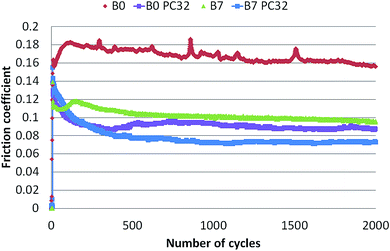
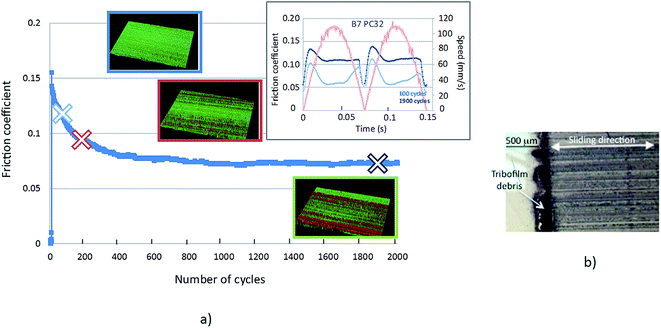
Fig. 1 shows the lubricated friction tests at 100 °C carried out in the presence of B0 and B7 matrixes. The effect of the commercial friction modifier (FM) is also shown for both matrixes. It can be clearly seen that the presence of FM in the fuel led to a drastic decrease in the friction coefficient by a factor 2 after only 200 cycles and it then stabilized at about 0.1. Moreover, adding both FAME and the friction modifier FM to B0 (B7 FM) further decreased the friction down to 0.07, a low value under the boundary lubrication regime. Clearly the addition of both FAME and FM to the diesel matrix had a synergistic effect.A more detailed examination of the shape of the friction curves recorded for selected cycles is shown in Fig. 2 in the case of the B7 + FM test. Starting at 100 friction cycles, the topographic image did not show a significant tribofilm on the polished steel substrate and the corresponding CoF was about 0.12. At 200 cycles, some patchy areas were formed and seem to be oriented in the sliding direction leading to the reduction of CoF to 0.09. At 1900 friction cycles, large areas of tribofilm were present in the track and were therefore responsible for the low friction coefficient obtained, around 0.06, and wear resistance. The change in speed from 0 to 120 mm s−1 had a sinusoid shape.
A detailed analysis of the friction curve on one cycle shows that the friction became lower and lower in the center of the track where the sliding speed was maximum (120 mm s−1). However, the friction was also reduced at the site of change of sliding direction where the speed is zero (boundary regime) as the tribofilm grows. Based on these findings, different CoF values were evaluated for one reciprocating sliding test to better interpret the friction behavior as a function of kinematic conditions. An average CoF value was calculated taking into account the whole sliding cycle, a minimum CoF value was calculated taking into account the center of the track alone and a maximum CoF value was calculated taking into account only the edges of the track corresponding to severer lubrication conditions. The friction coefficient reported on Fig. 2 corresponds to the average values.
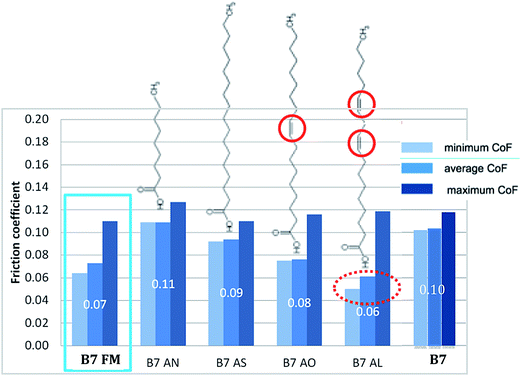
Because FM additive is composed of a mixture of several fatty acids, complementary friction experiments were carried out in order to investigate the respective role of each FM additive component (both saturated and unsaturated C18 fatty acids). Firstly, each fatty acid was tested as a friction modifier in a B7 diesel fuel matrix. The different acids tested were nonanoic acid (C9![[thin space (1/6-em)]](https://www.rsc.org/images/entities/char_2009.gif) :
:![[thin space (1/6-em)]](https://www.rsc.org/images/entities/char_2009.gif) 0), (AN), stearic acid (C18
0), (AN), stearic acid (C18![[thin space (1/6-em)]](https://www.rsc.org/images/entities/char_2009.gif) :
:![[thin space (1/6-em)]](https://www.rsc.org/images/entities/char_2009.gif) 0), (AS), oleic acid (C18
0), (AS), oleic acid (C18![[thin space (1/6-em)]](https://www.rsc.org/images/entities/char_2009.gif) :
:![[thin space (1/6-em)]](https://www.rsc.org/images/entities/char_2009.gif) 1), (AO) and linoleic acid (C18
1), (AO) and linoleic acid (C18![[thin space (1/6-em)]](https://www.rsc.org/images/entities/char_2009.gif) :
:![[thin space (1/6-em)]](https://www.rsc.org/images/entities/char_2009.gif) 2), (AL).
2), (AL).
Fig. 3 summarizes the results obtained at 100 °C for B7 and B7 blended with the different additives. FM is the commercial package of fatty acids already tested in Fig. 1 and its performance was compared to those of pure fatty acids added at a concentration of 800 mg kg−1 to the B7 diesel fuel. The friction coefficients reported were determined over the last 500 test cycles at steady state. Firstly, the results show that the addition of a fatty acid to B7 tends to reduce the friction during the test. Highly unsaturated long chain linoleic acid (AL) gave the best performance in terms of friction reduction whereas saturated chain acids such as nonanoic acid (AN) and stearic acid (AS) led to higher friction.
Characterization of the B7 + FM derived tribofilm
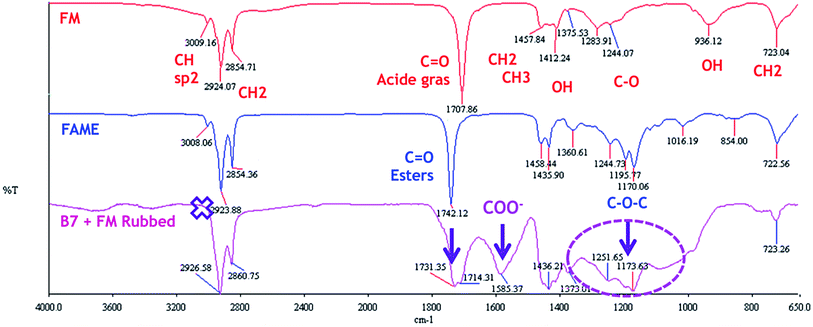
We first performed chemical analyses by IR spectroscopy. This is not a surface sensitive technique and the whole tribofilm was therefore probed by the technique. Fig. 4 shows an IR spectrum recorded on the pure FM additive. It displays the characteristic signatures of unsaturated fatty acids: carbon double bonds (C![[double bond, length as m-dash]](https://www.rsc.org/images/entities/char_e001.gif) C) at 3009 cm−1 and an OH peak at 936 cm−1. The methyl and carbonyl groups of the acid functional groups are also present on the spectrum. The analysis of the FAME compound shows the signature of esters at 1742 cm−1 and also the presence of oleic acid double bonds at 3009 cm−1. By comparison, the IR spectrum of the tribofilm was significantly different. First the unsaturation at 3009 cm−1 and the OH peak at 936 cm−1 disappeared and there was an increase in the large band near 1600 cm−1. According to the literature, this large peak corresponds to the presence of functional ester groups and/or carboxylate compounds (O
C) at 3009 cm−1 and an OH peak at 936 cm−1. The methyl and carbonyl groups of the acid functional groups are also present on the spectrum. The analysis of the FAME compound shows the signature of esters at 1742 cm−1 and also the presence of oleic acid double bonds at 3009 cm−1. By comparison, the IR spectrum of the tribofilm was significantly different. First the unsaturation at 3009 cm−1 and the OH peak at 936 cm−1 disappeared and there was an increase in the large band near 1600 cm−1. According to the literature, this large peak corresponds to the presence of functional ester groups and/or carboxylate compounds (O![[double bond, length as m-dash]](https://www.rsc.org/images/entities/char_e001.gif) C–O–X) where X can be iron or an organic chain. These results show that significant tribochemical reactions took place, involving saponification of acid groups and addition on the double bond of the unsaturated fatty acids.
C–O–X) where X can be iron or an organic chain. These results show that significant tribochemical reactions took place, involving saponification of acid groups and addition on the double bond of the unsaturated fatty acids.
The tribofilm was then analyzed by XPS and PES surface analyses. We first analyzed the pure liquid compounds by XPS using the cold stage holder to obtain reference data for chemical shifts of carbon and oxygen elements. Fig. 5 shows the main chemical contributions of carbon and oxygen 1s photo-peaks for B0, FAME and FM compounds. The spectrum of B0 only presented the C–C peak at 284.8 eV as expected (not shown here). The spectrum of FM (a mixture of fatty acids) was distinguished by other peaks characteristic of carboxylic groups: HO–C![[double bond, length as m-dash]](https://www.rsc.org/images/entities/char_e001.gif) O at 289.5 eV, O
O at 289.5 eV, O![[double bond, length as m-dash]](https://www.rsc.org/images/entities/char_e001.gif) C– at 532.5 eV and HO–C– peaking at 533.7 eV. In addition to the peaks present in FM additive, the spectrum of the FAME (a methyl ester) had the characteristic –O–CH3 peak at 287.1 eV. The XPS data were in good agreement with the theoretical molecular composition of these organic species. Unfortunately, the double bonds in the fatty acid chain were not detectable by XPS.
C– at 532.5 eV and HO–C– peaking at 533.7 eV. In addition to the peaks present in FM additive, the spectrum of the FAME (a methyl ester) had the characteristic –O–CH3 peak at 287.1 eV. The XPS data were in good agreement with the theoretical molecular composition of these organic species. Unfortunately, the double bonds in the fatty acid chain were not detectable by XPS.
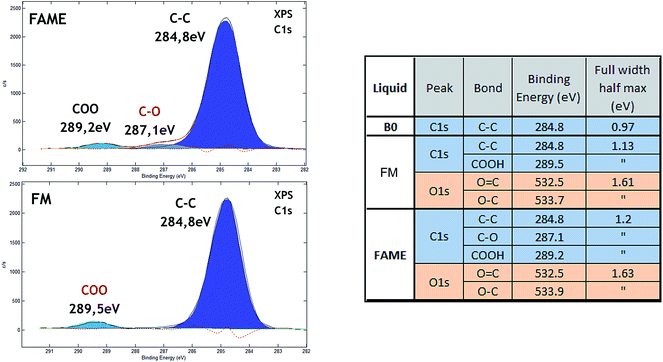 | ||
| Fig. 5 (a) XPS carbon (C 1s) spectra recorded on pure FAME and FM liquid compounds and (b) table reporting the XPS quantitative analyses for the different chemical states of C and O elements. | ||
Regarding the tribofilm analysis, we observed a significant charge effect in the XPS spectrum, indicating that the worn steel surface was coated by a thin electrically insulating layer. Fig. 6 shows the high resolution XPS spectra of carbon (C 1s) and oxygen (O 1s) recorded inside the tribofilm using X-rays with an energy of 1486.6 eV and corresponding to a calculated EAL of about 4 nm. The tribofilm XPS spectra had two major differences in comparison with reference data in Fig. 5. Firstly, there was a new peak in the C 1s spectrum at 286.4 eV which was attributed to –C–O chemical bonds. In the literature such a chemical shift is generally attributed to ether (–C–O–C) or alcohol (–C–OH) chemical bonding. Secondly, a (C![[double bond, length as m-dash]](https://www.rsc.org/images/entities/char_e001.gif) O) contribution was visible at 287.4 eV characteristic of the carbonyl group, not present in the C 1s spectra in Fig. 5. The O 1s spectrum clearly showed the contribution of iron oxides peaking at 529.9 eV. The other peaks in the oxygen XPS spectrum were more difficult to accurately assign. However, the peak at 531.5 eV was not present in reference compounds (Table in Fig. 5) and could be associated with the C 1s contribution at 286.4 eV (ether/alcohol).
O) contribution was visible at 287.4 eV characteristic of the carbonyl group, not present in the C 1s spectra in Fig. 5. The O 1s spectrum clearly showed the contribution of iron oxides peaking at 529.9 eV. The other peaks in the oxygen XPS spectrum were more difficult to accurately assign. However, the peak at 531.5 eV was not present in reference compounds (Table in Fig. 5) and could be associated with the C 1s contribution at 286.4 eV (ether/alcohol).
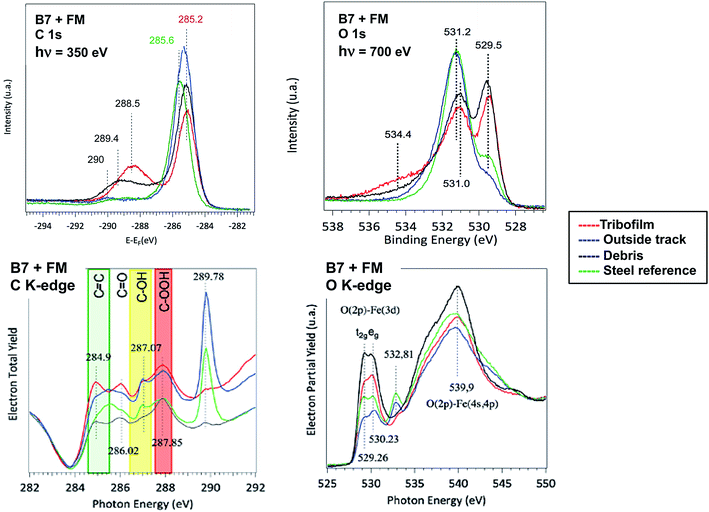
Extreme surface sensitive PES and XANES analyses were used to accurately probe the electronic and chemical composition of the tribofilm generated with FM in biofuel matrix. The coupling of the two techniques reveals the degree of carbon hybridization with a very high depth resolution (less than 1 nm) and the distribution of the species on the surface using the mesoscopic lateral spatial resolution. Spectra recorded on similar samples using the same cleaning procedure are shown in Fig. 7. Data recorded inside and outside the wear scar, on the debris located at the end of the track (see Fig. 1(b)) and on the virgin steel surface just after the polishing step were compared. In this particular case (synchrotron radiation) the thickness probed was much smaller than in the previous case and the calculated EAL was typically 0.65 nm for the carbon spectrum recorded for an X-ray energy of 350 eV.
Examination of the carbon spectra (PES and XANES) provided new insights into the chemical composition of the extreme surface of the tribofilm. Firstly, there was a slight shift in the C 1s peak near 285 eV which depended on the sample analyzed. In this case, the maximum peak energies were determined by positioning the Fermi vacuum level at the same energy for all the spectra. The sp3 hybridization state peaking at 285.6 eV was observed on the virgin steel surface contaminated by saturated carbonaceous material. The pure sp2-rich contribution is known to give a peak at 284.5 eV for graphite. The C 1s spectra recorded inside the wear scar and in the wear debris showed a similar shift of the C 1s peak energy at a lower energy of 285.2 eV, intermediate between sp3 and sp2 carbon species. Outside the track, the peak energy was intermediate, probably because of the signature of adsorbed unsaturated fatty acids. The PES results therefore suggest an excess of sp2 carbon on the very top surface of the tribofilm and in the debris. Another relevant result was the presence of a strong peak inside the tribofilm and debris at 288.5 eV and other peaks at higher energies. Outside the wear scar and on the virgin steel, these peaks attributed to oxygenated species were negligible.
Examination of the XANES C K-edge spectra confirmed the increase in C![[double bond, length as m-dash]](https://www.rsc.org/images/entities/char_e001.gif) C bonds at the extreme surface. The characteristic 1s–π* transition at 284.9 eV was only present in the tribofilm and debris. It was not present outside the wear scar and on virgin steel substrate. The two peaks at 284.9 eV (C
C bonds at the extreme surface. The characteristic 1s–π* transition at 284.9 eV was only present in the tribofilm and debris. It was not present outside the wear scar and on virgin steel substrate. The two peaks at 284.9 eV (C![[double bond, length as m-dash]](https://www.rsc.org/images/entities/char_e001.gif) C) and 286 eV (C
C) and 286 eV (C![[double bond, length as m-dash]](https://www.rsc.org/images/entities/char_e001.gif) O) were correlated and were characteristic of the tribofilm material. These two peaks were generally attributed to a planar quinone structure that is known to occur in graphene oxide, for example.15 Other peaks lying between 287 eV and 290 eV were more difficult to accurately assign. The two peaks at 287 eV and 288 eV were attributed to alcohol and carboxylic acid groups. The strong peak at 289.8 eV was only seen outside the wear scar and on polished steel. It can be attributed to contamination by solvents containing alcohols. We checked that this peak disappears after heating the steel sample in the vacuum (not shown here).
O) were correlated and were characteristic of the tribofilm material. These two peaks were generally attributed to a planar quinone structure that is known to occur in graphene oxide, for example.15 Other peaks lying between 287 eV and 290 eV were more difficult to accurately assign. The two peaks at 287 eV and 288 eV were attributed to alcohol and carboxylic acid groups. The strong peak at 289.8 eV was only seen outside the wear scar and on polished steel. It can be attributed to contamination by solvents containing alcohols. We checked that this peak disappears after heating the steel sample in the vacuum (not shown here).
The oxygen spectra (PES and XANES) also showed interesting features. Firstly, the strong peak in the O 1s PES spectrum near 531.2 eV was always present in particular in the polished steel sample, covering the oxide layers. This peak is not therefore related to a tribo-chemical reaction between additives. The contribution of iron oxides at 529.5 eV dominates the spectra in the tribofilm and in wear debris, confirming the importance of iron oxides in the tribofilm composition. Peaks present near 535 eV in the O 1s spectrum are characteristic of the tribofilm composition and perhaps correspond to esters groups. The small peak at 532.8 eV on the O K-edge spectrum and mainly present outside the wear track and on the polished steel sample is correlated with the strong peak at 289.8 eV on the C K-edge spectrum and is not associated with tribofilm chemistry.
Finally, PEEM imaging of carbon and oxygen was then carried out using the different peaks visible in PES analysis in Fig. 7. The probe size was fixed at about 0.5 micron with a step of 2 microns between each spectrum. The chemical maps are shown in Fig. 8. It can be seen that the surface composition is not homogeneous at a level of one micron. The tribofilm is patchy and the iron oxide (O chemical image at 530 eV) is not located at the same place as in the organic material (C chemical maps at 287.5 eV). Moreover the image at 290 eV (esters) is different from the one at 287 eV (carbonyl) suggesting that the tribofilm is composed of different oxygenated chemical species.
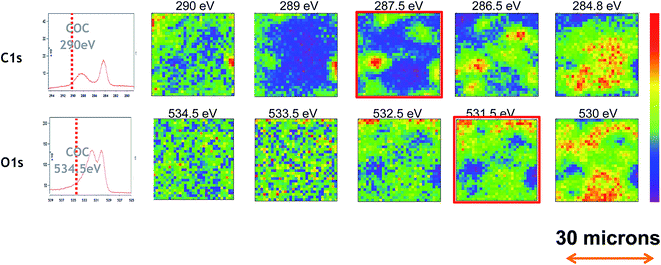 | ||
| Fig. 8 Photoemission Electron Microscopy (PPEM) carried out on tribofilm obtained with FM in B7 biodiesel at 100 °C. Chemical maps of carbon and oxygen in different oxidation states. | ||
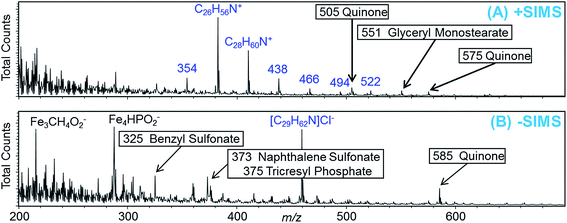
Samples for TOF-SIMS analysis were first cleaned with B0 and heptane in an ultrasonic bath, then stored in glass vials with B0 and nominally maintained at room temperature prior to analysis. TOF-SIMS analysis was conducted on samples “as received” without any treatment such as sputter cleaning of the surface. The TOF-SIMS spectra are given in Fig. 9 revealing the mass range m/z = 200–700 in each ion polarity. These spectral regions contained several salient features representative of the total mass spectra. It should be noted at the outset that no intact fatty acid additives were detected, either inside or outside the wear track. The TOF-SIMS analysis area is shown in Fig. 10(A) and (B) with the areas inside and outside the wear track identified in each ion polarity.
The positive ion polarity mass spectrum shown in Fig. 9(A) contains an ion distribution, indicated in blue, arising from an ammonium molecule. A singular feature, also indicated in blue, appears in the negative ion polarity mass spectrum shown in Fig. 9(B) that, with the present mass accuracy, we can only surmise to be a corresponding chlorine adduct. These spectral features map to the high wear areas within the track shown in Fig. 10(C), as does the glyceryl monostearate shown in Fig. 10(E). These molecular moieties, which are fairly common antistatic additives, may originate from the polymer cap of the glass storage container.
Several other molecular species were identified by TOF-SIMS, including benzyl sulfonate, naphthalene sulfonate and tricresyl phosphate. These species are more abundant within the wear track where the abundance of sulfate and phosphate from the steel is greater following the removal of the surface oxide. We directly observed that the abundance of sulfate, i.e. SO3−, and phosphate, i.e. PO3−, was greater within the wear track region of the sample. It should be pointed out that benzyl sulfonate, naphthalene sulfonate and tricresyl phosphate contain aromatic rings bound to SOx and POx functional groups. In addition, we observed mass spectral features that are consistent with quinone and mellitate chemistry as determined by reference library matching. However, in the present analysis, we lacked the required mass accuracy (W) to arrive at specific compositions for these high m/z moieties. Sulfates and phosphates mapped, in general, to areas within the wear track as indicated by Fig. 10(F). Quinones very specifically mapped to friction areas within the wear track as shown in Fig. 10(D), (G) and (H). We consider the aromatic components to be products of the FA additives, produced during the friction test, which form part of the protective tribofilm. This suggestion is supported by the PES and XANES data which indicate a greater C sp2 content within the wear track. Both TOF-SIMS and PEEM imaging demonstrated that the tribofilm was patchy and nonuniform.
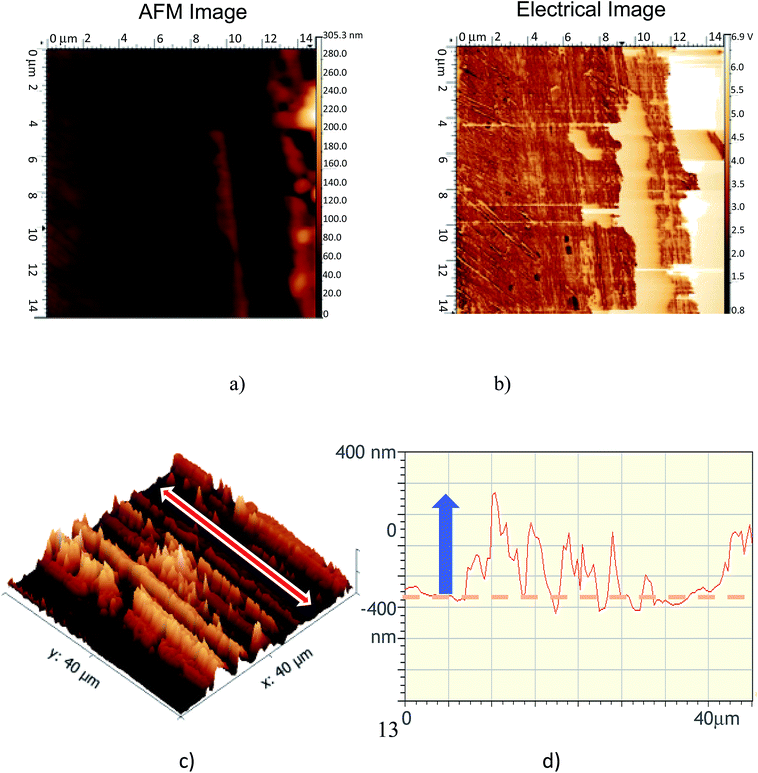
Finally, we used AFM imaging to get topographical and electrical images of the tribofilm. Fig. 11 shows AFM images generated inside the wear scar. They clearly show the presence of pads of tribofilm material inside the wear track. These pads are composed of insulating material about 10 micrometers wide and about 100 nm thick. No pads were detected outside the wear track. The thickness profile confirmed that no wear has occurred and that the tribofilm was superimposed on the virgin steel surface. Visible scratches after imaging show that the tribofilm material was very soft because it was removed by the AFM tip during the scans.
IV. Discussion
Both PES and IR analyses clearly indicate that several complex tribochemical reactions occurred with the formation of the bulk of the tribofilm material on the steel surface. The result suggests a reticulation reaction involving unsaturated fatty acids from the FM additive and FAME from B7 and possibly oxygen, as several authors have reported that large amounts of this molecule are dissolved in the fuel.16–18 The temperature is therefore an important parameter governing the reaction. The presence of a very thin top layer on the tribofilm rich in sp2-carbon may therefore be responsible for the low friction observed in the case of the B7 + FM matrix. Indeed the surface aromatization of unsaturated fatty acids is a mechanism also envisaged in the literature.19Our data show that the structure of the bulk 100 nm-thick tribofilm is very different from that of its extreme surface (about 1 nm in depth). This is discussed in more detail below:
(a) IR analyses have shown that the disappearance of double bonds present in the fatty acid and FAME is associated with the formation of esters or iron salts. Moreover the presence of iron oxide material suggests that a reticulation process is induced by the combination of metal oxide, molecular oxygen in the air and/or fuel and high temperature. This mechanism is similar to a siccative process involved in the reticulation of linseed oil and drying of paintings and lacquers.
To confirm this hypothesis, a small part of the tribofilm jelly was collected and placed on a copper grid covered by a carbon film for HRTEM observation. Fig. 12 shows images of the jelly structure of the organic material that did not evaporate in the vacuum of the microscope. Small iron oxide crystallites are clearly visible embedded in the organic material and are clearly observed by HRTEM. The presence of iron oxide particles is therefore necessary to promote the formation of the tribofilm.
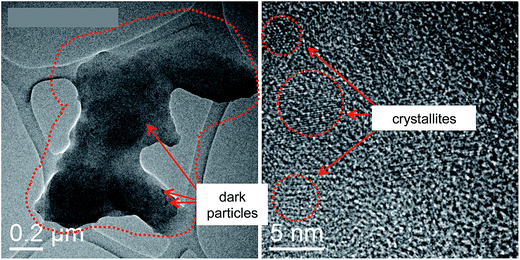 | ||
| Fig. 12 HRTEM image of tribofilm material deposited on a carbon film mounted on a copper grid. Small iron oxide crystallites are embedded in the organic material. | ||
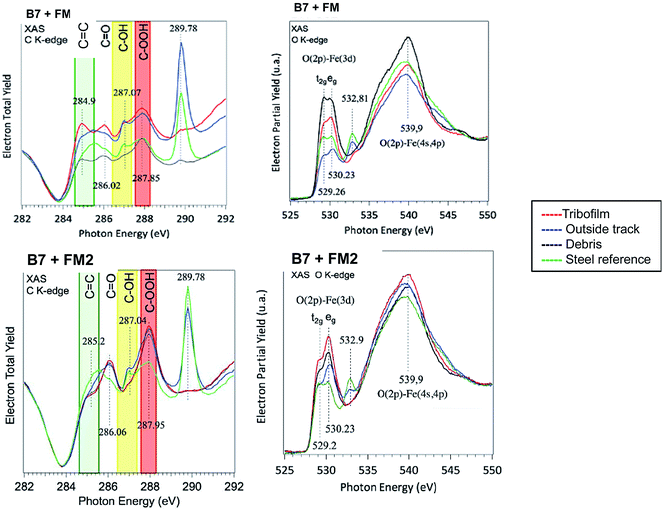
(b) Extreme surface sensitive analyses of the tribofilm show the presence of aromatic structures (quinones, carbon rings) similar to those present in graphene oxide for example.15 We postulate that these lamellar compounds are very important for the friction reduction in the lubricated test. To confirm this hypothesis, we analyzed by XANES, under the same conditions, a tribofilm generated with a different commercial friction modifier additive FM2 (containing sorbitan tri-oleate instead of fatty acids) that had poor friction reduction capabilities compared to FM. As shown by the C K-edge fine structure presented in Fig. 13, there a much lower signal corresponding to C![[double bond, length as m-dash]](https://www.rsc.org/images/entities/char_e001.gif) C bonding at 284.9 eV in the case of FM2 than with FM. On the contrary, the surface of FM2 derived tribofilm contains many more carboxylic acid groups. This result strongly supports the role of sp2 lamellar structures in friction reduction.
C bonding at 284.9 eV in the case of FM2 than with FM. On the contrary, the surface of FM2 derived tribofilm contains many more carboxylic acid groups. This result strongly supports the role of sp2 lamellar structures in friction reduction.
V. Conclusions
The impact of fatty acids on the lubricity of diesel and biodiesel fuels was investigated in steel/steel contact. The tribological conditions were chosen in order to simulate the mechanical parameters of the piston ring/cylinder liner system. The following conclusions can be drawn:(1) B0 diesel fuel alone (with no FAMEs and no fatty acid additives) does not lubricate well the steel contact, whatever the temperature used. Friction is high and wear occurs.
(2) The presence of 7% v/v of FAMEs in B0 (so called B7) lubricates the steel contact to a certain extent. The friction coefficient is reduced by about 30%.
(3) The addition of fatty acids to B7 leads to further significant friction reduction. The FM commercial additive composed of a mixture of different fatty acids added to B7 offers the best performance (friction is reduced by 2 compared with B0 diesel).
(4) The effect of pure C18 fatty acids on friction reduction was also investigated. This included a comparison of two saturated species (nonanoic and stearic acids) with two unsaturated ones (oleic and linoleic acids). All these additives helped reduce friction whatever the diesel fuel (B0 or B7). However, the mixture of B7 and FM provides a very low friction coefficient of about 0.07 under a severe boundary lubrication regime. It should be underlined that diesel fuel is not viscous compared to engine oils and that EHL lubrication is not likely to occur in all our cases.
(5) The analysis of worn surfaces by XPS first reveals that an insulating film is present in the center of the tracks (where friction is low). The XPS spectra of carbon show chemical changes in the tribofilm for the fatty acid composition. The carboxylic group is no longer present.
(6) The analysis of tribofilm by PM-IRRAS gives more insights in its chemical composition. An important feature is the disappearance of carbon double bonds in the tribofilm and the presence of some esters (iron soaps or/and organic). This is an evidence of stress-induced reticulation process promoted by temperature, oxygen and iron oxide nanoparticles.
(7) The analysis of the extreme surface (0.65 nm depth) of the tribofilm by PES, XAS and ToF-SIMS shows the presence of planar sp2-carbon rich molecules such as quinone and/or graphene oxides. This tribofilm termination is involved in friction reduction and these planar sp2-carbon rich species are not present in the XAS features of another friction modifier additive giving less friction reduction.
(8) To conclude, under the effects of friction, temperature and possibly oxygen from air and/or fuel, complex chemical reactions of all additives are thought to occurs on the metal oxide surface generating a new solid-like species. Some worn metal oxide particles may have a catalyst effect on the formation of these solid-like species. Because double bonds are involved in the process, the basic mechanism of tribochemistry is a reticulation process in the bulk and aromatization of unsaturated fatty acids at the extreme surface.
Acknowledgements
The authors would like to thank T. Buffeteau and G. Le Bourdon from the Molecular Spectroscopy Group at Bordeaux University in France for performing PM-IRRAS analyses and interpreting the data. The authors would like also to thank Dr F Dalhem and B. Vacher from the Laboratory of Tribology and System Dynamics at Ecole Centrale de Lyon.References
- M. Hoshi, Tribol. Int., 1984, 17(4), 185 CrossRef.
- R. C. Rosenberg, SAE Paper 821576, 1982 Search PubMed.
- A. Katoh and Y. Yasuda, SAE Paper 940992, 1994 Search PubMed.
- Chevron corporation, Diesel Fuels Technical Review, 2007 Search PubMed.
- M. Le Pera, The lubricity of fuels. Tribology & Lubrication Technology, February 2007 Search PubMed.
- ISO 12156–1:2006, Diesel fuel – Assessment of lubricity using the HFRR-Part 1: Test Method, 2006 Search PubMed.
- ASTM D 6079–11, Standard test method for evaluating lubricity of Diesel fuels by HFRR, 2011 Search PubMed.
- National Renewable Energy Laboratory, BioDiesel Handling and Use Guide – Fourth edition, NREL/TP-540–43672, 2009 Search PubMed.
- A. F. Lee, J. A. Bennett, J. C. Manayil and K. Wilson, Chem. Soc. Rev., 2014, 43(22), 7887–7916 RSC.
- Y. Liu, E. Lotero, J. G. Goodwin and X. Mo, Appl. Catal., A, 2007, 33, 138–148 CrossRef.
- M. A. A. Silva, et al., Fuel, 2015, 143, 16–20 CrossRef CAS.
- G. Knothe, Fuel Process. Technol., 2005, 86, 1059–1070 CrossRef CAS.
- R. Sarin, Lubr. Sci., 2007, 19, 151–157 CrossRef CAS.
- J. M. Martin, et al., Friction, 2013, 1(3), 252–258, DOI:10.1007/s40544-013-0022-2.
- D. Zhan, et al., Carbon, 2011, 49, 1362 CrossRef CAS.
- M. Habibullah, et al., Ind. Crops Prod., 2015, 76, 188–197 CrossRef CAS.
- K. S. Wain, J. M. Perez, E. Chapman and A. L. Boehman, Tribol. Int., 2005, 38(3), 313–319 CrossRef CAS.
- L. Havet, J. Blouet, F. RobbeValloire, E. Brasseur and D. Slomka, Wear, 2001, 248(1–2), 140–146 CrossRef CAS.
- D. E. Floyd, R. F. Paschke, D. H. Wheeler and W. S. Baldwin, J. Am. Oil Chem. Soc., 1956, 33(12), 609–614 CrossRef CAS.
| This journal is © The Royal Society of Chemistry 2017 |

