DOI:
10.1039/C7RA02893H
(Paper)
RSC Adv., 2017,
7, 28366-28372
One-step hydrothermal preparation of Ce-doped MoO3 nanobelts with enhanced gas sensing properties†
Received
10th March 2017
, Accepted 24th May 2017
First published on 30th May 2017
Abstract
Rare earth ions are considered as the ideal dopants to modify the crystal structure, electronics structure, and gas sensing performance of metal oxides semiconductors. In this paper, Ce-doped MoO3 nanobelts were successfully synthesized via a one-step hydrothermal method. The morphology and microstructure were characterized by X-ray diffraction (XRD), field emission scanning electron microscopy (FESEM), energy-dispersive X-ray spectroscopy (EDS), and X-ray photoelectron spectra (XPS). FESEM images demonstrate that the as-prepared products are uniform nanobelts with length of about 20 μm and width of 100–200 nm. EDS, XRD, and XPS spectroscopy show that Ce atoms were uniformly distributed in the crystal structure of MoO3 nanobelts. In comparison with pure samples, Ce-doped MoO3 nanobelts exhibited superior trimethylamine (TMA) sensing properties at a lower working temperature. The effects of Ce-doping on the trimethylamine sensing performance of MoO3 nanobelts were discussed based on the experimental results. In addition, this study provided insights and strategies for designing high performance TMA gas sensors.
Introduction
Trimethylamine (TMA) is widely used in many fields as a raw material in the chemical industry. It exists as a colorless gas with a fishy ammonia-like odour at normal temperature. Exposure to TMA gas will result in coughing, irritation of the upper respiratory system, difficulty in breathing and lung oedema.1,2 Thus, it is very important to detect TMA accurately and quickly. Using gas sensors based on metal oxide semiconductors (MOS) is a typical method for TMA detection, such as P. M. Perillo et al. prepared TiO2 membrane nanotubes to detect TMA within a concentration range of 40–400 ppm.3 Y. H. Cho et al. have synthesized WO3 hollow spheres by ultrasonic spray pyrolysis of a citric-acid-containing precursor solution, which showed high response to TMA gas.4
As a wide band gap semiconductor material, molybdenum trioxide (MoO3) has corner/edge/face-sharing MoO6 octahedron units which are capable of forming zigzag chain and unique layer/tunnel structure. It has been investigated over the past decades due to its distinctive properties of electrochromism, thermochromism and photochromism, as smart materials, catalysts and host materials for intercalation.5–9 Furthermore, many researchers have reported the gas-sensing properties of MoO3-based gas sensors.10–13 For instance, using spray pyrolysis method, R. Pandeeswari et al. prepared MoO3 thin films with excellent TMA sensing performance.14 J. H. Lee et al. reported MoO3 nanoplates as TMA sensing material via ultrasonic spray pyrolysis technique.15 Chu et al. prepared MoO3 micro-rods and the detection limit to trimethylamine was 0.01 ppm with a sensitivity of 1.5 at 300 °C.16 Compared with other morphologies, one-dimensional (1-D) nanostructures such as nanowires, nanobelts, and nanotubes have been demonstrated to be promising candidates for ultrasensitive sensors because of their single crystal nanostructure, high surface-to-volume ratios, specially physical and chemical properties.17–22 S. Yang et al. reported ultralong MoO3 nanobelts with length of 200 μm with excellent TMA sensing performance.23 Our group have synthesized MoO3 nanobelts decorated with Au nanoparticles, which exhibited highly sensitive and selective properties to trimethylamine gas.24 Obviously, further investigation is necessary for enhancing TMA sensing performance of 1-D MoO3 nanomaterials.
Doping, the addition of specific extrinsic element, is another effective approach to enhance the gas-sensing properties of metal oxide semiconductors.25–31 In particularly, cerium (Ce), as a dopant to improve gas sensing performance of metal oxide, has caused widely concern and achieved certain achievements, such as Ce-doped In2O3 nanospheres,32 Ce-doped SnO2 hollow nanofibers,33 Ce-doped ZnO thin film,34 Ce-doped iron oxide.35 However, to the best of our knowledge, there is a few reports on the TMA sensing characteristics of Ce-doped 1-D MoO3 nanomaterials. Based on the above mentioned advantages of 1-D MoO3 nanomaterials for gas sensing, as well as those associated with Ce doping, we synthesized pure and Ce-doped MoO3 nanobelts by a one-step hydrothermal route. The morphology, microstructure and chemical state of as-obtained samples are characterized. In addition, the TMA sensing properties of pure and Ce-doped MoO3 nanobelts were tested. Experimental results show that the introduction of Ce-doping is an effective way to enhance the sensing characteristic MoO3 nanobelts toward TMA gas.
Experimental
Synthetic procedures
All the reagents we used in this experiment were of analysis grade and used without further purification. In a typical hydrothermal synthesis route, MoO3 powders were firstly obtained by calcining (NH4)6Mo7O24·4H2O at 500 °C for 240 min. Then, 3.6 g of as-prepared MoO3 powders were dissolved in 27 mL of 30% aqueous H2O2 under vigorous stirring. Subsequently, a mixture solution of certain amount of cerium nitrate (with a mole ratio of 4%) dissolved in 13 mL concentrated nitric acid and 85 mL deionized water was added. After stirring 20 minutes at room temperature, the above solution was transferred into a Teflon-lined stainless-steel autoclave and under heat treatment at 170 °C for 48 h. After the hydrothermal reaction, the autoclave cooled naturally down to room temperature. The precipitates were collected by centrifugation, washed several times with distilled water and absolute ethanol, respectively, and dried at 60 °C for 12 h. For comparison, the pure MoO3 nanobelts were also synthesized with the same techniques without adding cerium nitrate. The gas sensing properties were tested based on a computer-controlled WS-30A system with a static process.24 For the target gases obtained from liquid, the concentration of target gas was calculated by the following formula,| | |
C = (22.4 × ρ × d × V1)/(M × V2)
| (1) |
where C (ppm) is the target gas concentration, ρ (g mL−1) is the density of the liquid, d is the purity of the liquid, V1 (μL) is the volume of the liquid, V2 (L) is the volume of the glass chamber, and M (g mol−1) is the molecular weight of the liquid. By the formula, we can calculate the different gas concentrations.
Characterization
The crystal structure and phase composition of as-prepared samples were identified by X-ray diffraction (XRD, Bruker D8 Advance) using CuKa1 radiation (λ = 0.15406 nm) at 30 kV and 40 mA at a scanning rate of 2° at 2θ min−1. The morphology and nanostructure of the products were characterized using FEI Sirion 200 field emission gun scanning electron microscope (FESEM, Hitachi S4800), and transmission electron microscopy (TEM, Hitachi H-800). The energy-dispersive X-ray spectroscopy (EDS) analysis was performed by the FESEM attachment. The X-ray photoelectron spectra (XPS) were obtained on an X-ray photoelectron spectrometer (PHI 5300) to determine the electronic structure of the surface of the Ce-doped MoO3 nanobelts.
Results and discussion
Structure characterization
The representative morphology and microstructure of as-obtained samples are observed by FESEM. Fig. 1(a) illustrates typical FESEM image of the MoO3 powders obtained from (NH4)6Mo7O24·4H2O calcined at 500 °C. It can be seen that the samples are irregularly shaped particles with micron-scale size. After one-step hydrothermal treatment, the surface morphology of the pure MoO3 samples could be clearly observed from typical FESEM image (Fig. 1(b)). From the overall morphology, it can be found that the products are uniform nanobelts with an average length of about 20 μm and width of 100–200 nm. From Fig. 1(c), the morphology of Ce-doped MoO3 nanobelts has no obvious variation. In our experiments, the MoO3 powders were dissolved in H2O2 and a transparent yellow solution was obtained after magnetic stirring. In this process, the solution-soluble precursor compound MoO2(OH)(OOH) could form easily.36,37 In the subsequent hydrothermal growth stage, tiny MoO3 nuclei were generated by dehydration of the dissolved yellow Mo-complex. The formation mechanism of α-MoO3 nanobelts can be explained by the anisotropic growth of material itself. The strong preferential growth of (010) crystal plane in the [001] direction of orthorhombic α-MoO3 forming one-dimensional structure is determined by its structural characteristics.38–40 In the structure of α-MoO3, distorted MoO6 octahedra interconnect via co-edges in [001] direction (c-axis) and co-vertices in the [100] direction (a-axis). The interaction of the adjacent layers in the b-axis depends on the weak van der Waals force, whereas that replayed on the strong covalent bond in the c-axis. If the MoO3 crystal grows in the [001] direction, the system will release more energy, in other words, the growth in the c-axis is favorable in accordance with principle of minimum energy. The energy-dispersive X-ray spectroscopy (EDS) analysis was used to further explore the existence of Ce in the doped samples. The corresponding EDS elemental mappings (Fig. 1(d–f)) indicate that the as-obtained nanobelts are composed of Mo, O, and Ce elements, and as expected, Ce is uniform distribution in the elemental mapping of Ce-doped MoO3 nanobelts, which provide the direct evidence of the successful doping of Ce into the bulk MoO3.
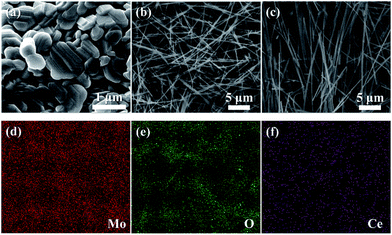 |
| | Fig. 1 (a) Typical FESEM image of MoO3 powders; (b and c) FESEM images of pure and Ce-doped MoO3 nanobelts, and (d–f) EDS elemental mapping of Ce-doped MoO3 nanobelts (Mo, O, and Ce). | |
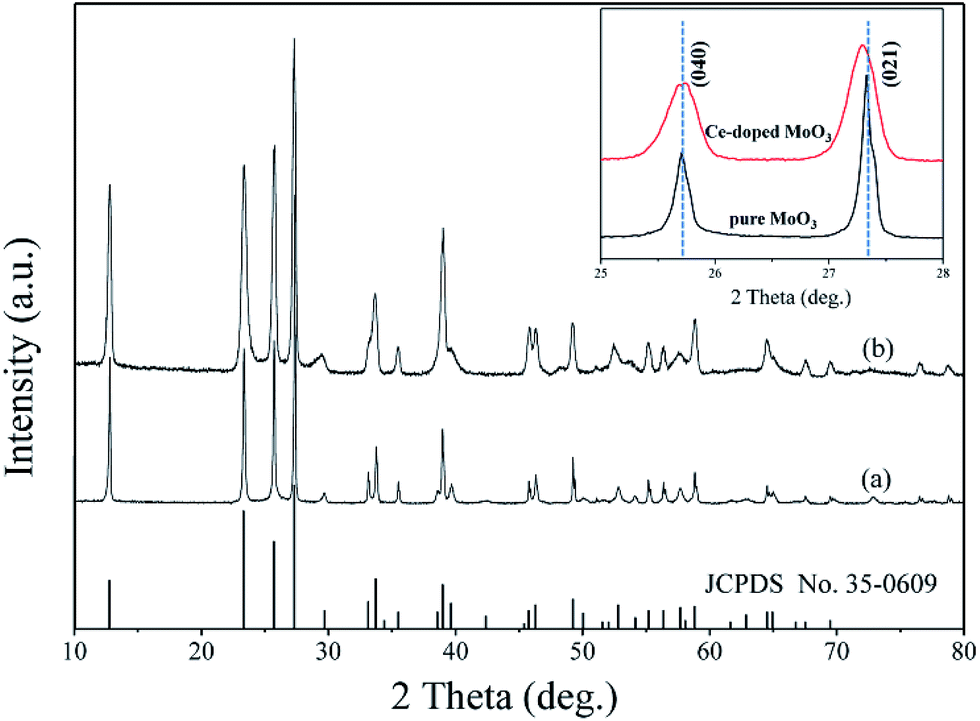
The phase purity of as-synthesized samples was characterized by XRD. As shown in Fig. 2(a), all the peaks in XRD pattern are readily agree with orthorhombic α-MoO3 (corresponding JCPDS card No. 35-0609). For the as-prepared Ce-doped MoO3 nanobelts, no additional diffraction peaks of cerium oxide and its related secondary or impurity phase were detected in the Fig. 2(b). The results indicated that Ce could be incorporated into the lattice of MoO3 without affecting the orthorhombic structure of molybdenum trioxide. In order to investigate the effect of doping on the phase structures of the MoO3 nanobelts, the (040) and (021) diffraction peaks were monitored, as shown in the inset of Fig. 2. It can be seen that the (040) and (021) diffraction peaks of Ce-doped MoO3 shift slightly compared to the pure MoO3. The result proved that the incorporation of Ce ions led to lattice deformation due to the difference between ionic radius of Ce [0.87 Å] and Mo [0.65 Å]. Furthermore, it can be observed that the half-width of diffraction peaks of Ce-doped MoO3 are slightly increase compared with those of pure MoO3. The average grain sizes are estimated using the Scherrer formula, which are about 27.64 and 23.76 nm for pure and doped samples, respectively, confirming that Ce-doping can cause the inhibition effect on crystallite size from growing up during the hydrothermal treatment, which is consistent with previous research.41–43
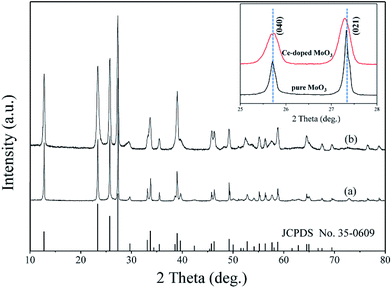 |
| | Fig. 2 XRD patterns of (a) pure and (b) Ce-doped MoO3 nanobelts. The inset is the comparison of (040) and (021) peaks from XRD patterns. | |
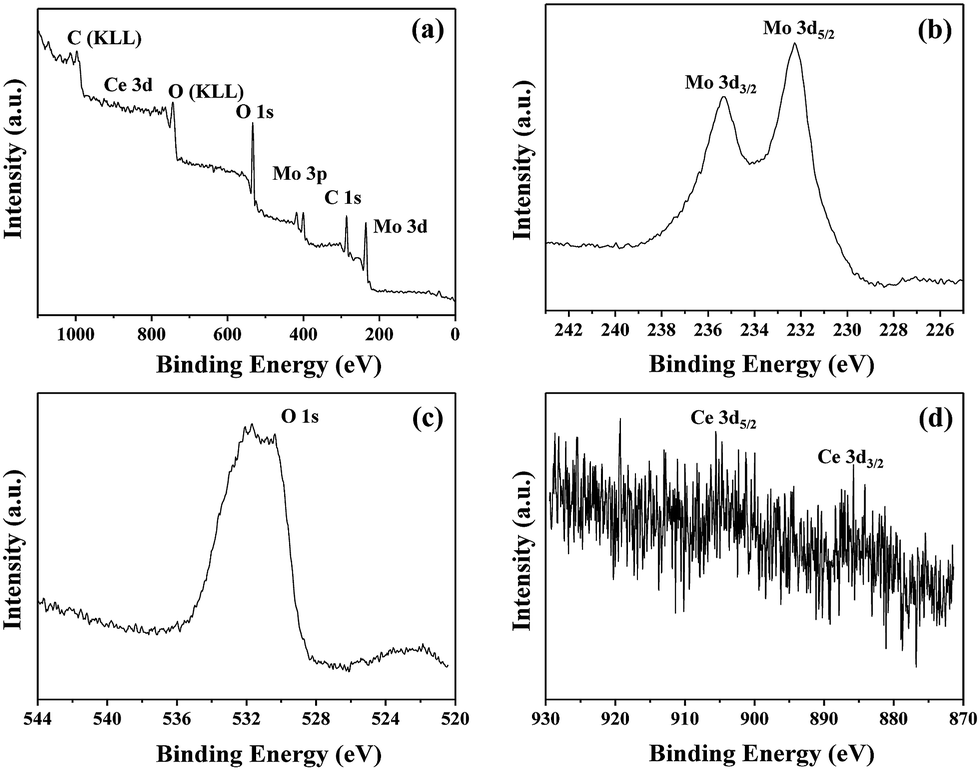
In order to investigate the chemical composition and valence state of elements, XPS analysis was characterized and the patterns are shown in Fig. 3. The XPS survey spectrum for Ce-doped MoO3 nanobelts is presented in Fig. 3(a). The spectrum exhibits the preference of all expected core levels due to Mo 3d, O 1s, Ce 3d and C 1s. And the corresponding high resolution spectra are shown in Fig. 3(b–d). The doublets of Mo 3d5/2 and Mo 3d3/2 peaks, located at 232.3 and 235.4 eV in Fig. 3(b), correspond to Mo6+ in MoO3 stoichiometric.44 Fig. 3(c) displays the O 1s XPS spectrum of Ce-doped MoO3 nanobelts. Two components are observed: a low binding energy (530.5 eV) is originated from the lattice oxygen in MoO3,45–47 and that at high binding energy (531.6 eV) is usually is assigned to the oxygen vacancies in the matrix of metal oxide,48–50 formed due to Ce ions substitution. The results indicated that Ce-doping modified the surface state of MoO3 nanobelts by producing oxygen vacancies, and such defects will have great influence on the gas sensing properties. Fig. 3(d) shows the Ce 3d XPS of the Ce-doped MoO3 sample. It was reported that the Ce 3d spectra can be attributed to two sets of spin orbital multiples, 3d5/2 and 3d3/2.51,52 As shown in Fig. 4(d), the presence of Ce3+ in the hybrid is confirmed by the appearance of weak signals at 885.6 and 905.1 eV.53–55 However, the diffraction peaks of Ce3+ were not observed from the XRD pattern in Fig. 2, indicating that the Ce3+ was incorporated into the lattice of MoO3 and had a very low content (4 mol%).
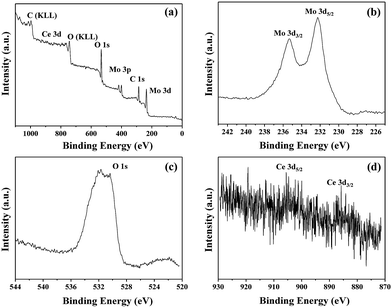 |
| | Fig. 3 XPS spectra of Ce-doped MoO3 nanobelts. (a) Survey spectrum; (b) Mo 3d binding energy spectrum; (c) O 1s binding energy spectrum; (d) Ce 3d binding energy spectrum. | |
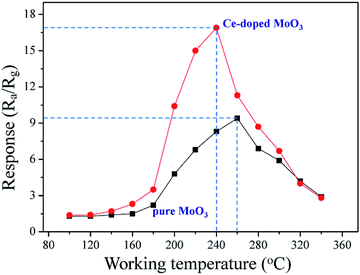 |
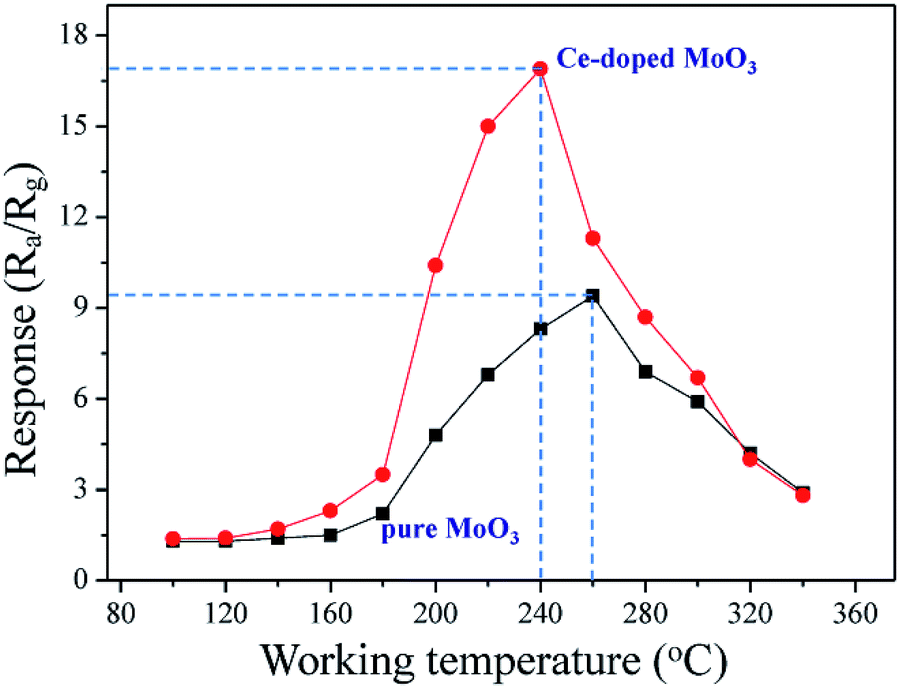
| | Fig. 4 Sensor response of pure and Ce-doped MoO3 nanobelts to 50 ppm TMA gas versus working temperature. | |
Gas-sensing properties
As is well-known, the operating temperature is a very important parameter for gas sensors based on metal oxide. To confirm the optimum operating temperature of as-synthesized samples, we investigate the variations of the sensor response as a function of the operating temperature. As shown in Fig. 4, it can be observed that sensor based on pure MoO3 nanobelts show relatively low response to 50 ppm TMA at the operating temperature in the range from 100 to 340 °C, with the maximum response of 4.6 at 280 °C. For compact, sensor response of Ce-doped MoO3 nanobelts displays significant increase, reaching the maximum value of 17.4 at the operating temperature of 240 °C. Compared with pure MoO3 nanobelts, the optimum operating temperature of the Ce-doped MoO3 nanobelts sensor has a notable decrease. These results demonstrate that the Ce-doped MoO3 nanobelts display about fourfold enhancement in sensor response compared to pure MoO3, which is caused by the promotion effect of Ce-doping.
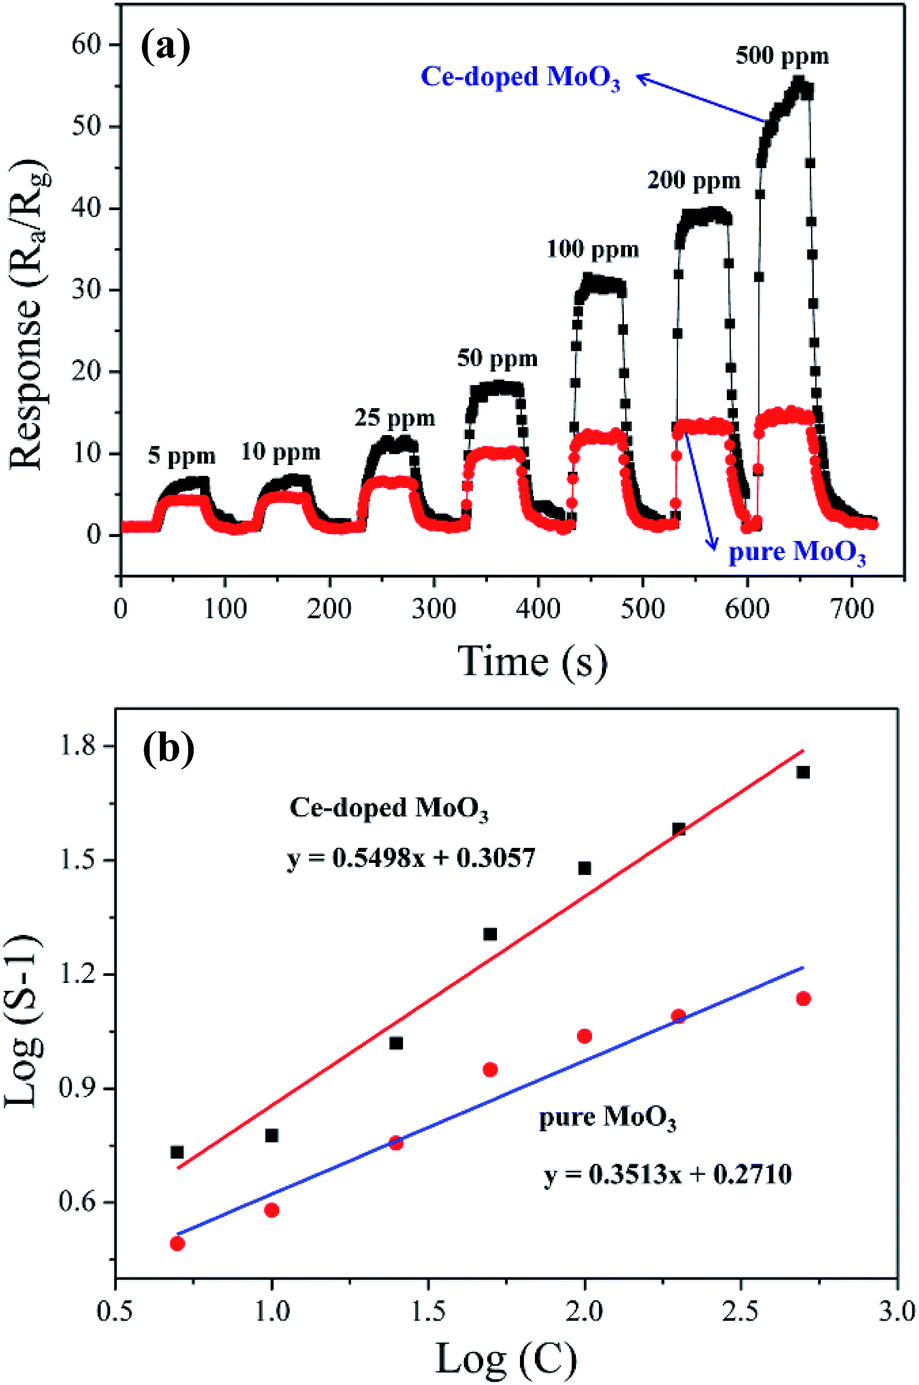
Fig. 5(a) illustrates the dynamic response and recovery curves of the sensor based on pure and Ce-doped MoO3 nanobelts to different TMA concentrations (from 5 to 500 ppm) at 260 and 240 °C, respectively. From the curves, it is obviously found that the response increased with an increase in TMA concentration. Specifically, the sensor based on Ce-doped MoO3 nanobelts exhibited higher response to TMA at different concentrations compared with that of pure MoO3 nanobelts. Previous research suggests that the concentration (C) of detected gas and the corresponding response (S) of metal oxide can be empirically represented as S = a[C]b + 1. Generally for n-type semiconductor, the exponent b has an ideal value of 0.5 to 1.56–58 As shown in Fig. 5(b), the straight lines were the calibration curves and the experimental data were fitted as:
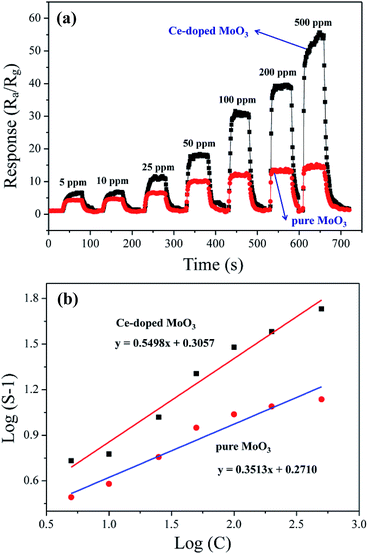 |
| | Fig. 5 (a) Relationships between sensor response of pure and Ce-doped MoO3 nanobelts and TMA concentration and (b) the corresponding log(S − 1) vs. log(C) of the sensor based on pure and Ce-doped MoO3 nanobelts. | |
where y is log(S − 1) and x is log(C). The response of both sensors have good linear relationship with the TMA concentration (5–500 ppm range) in logarithmic forms, which is in good agreement with the theory of power laws for semiconductor sensors.59 The slope of Ce-doped MoO3 nanobelts sensor is 0.5498, which is larger than that of pure MoO3 nanobelts (0.3513). It indicates that the Ce-doped MoO3 nanobelts sensor is more sensitive than the pure one, and the response of Ce-doped MoO3 nanobelts based sensor increase faster than that of pure one accompanied with the increase of gas concentration. Gas sensing tests highlight potential application of the Ce-doped MoO3 nanobelts in detecting TMA vapor.
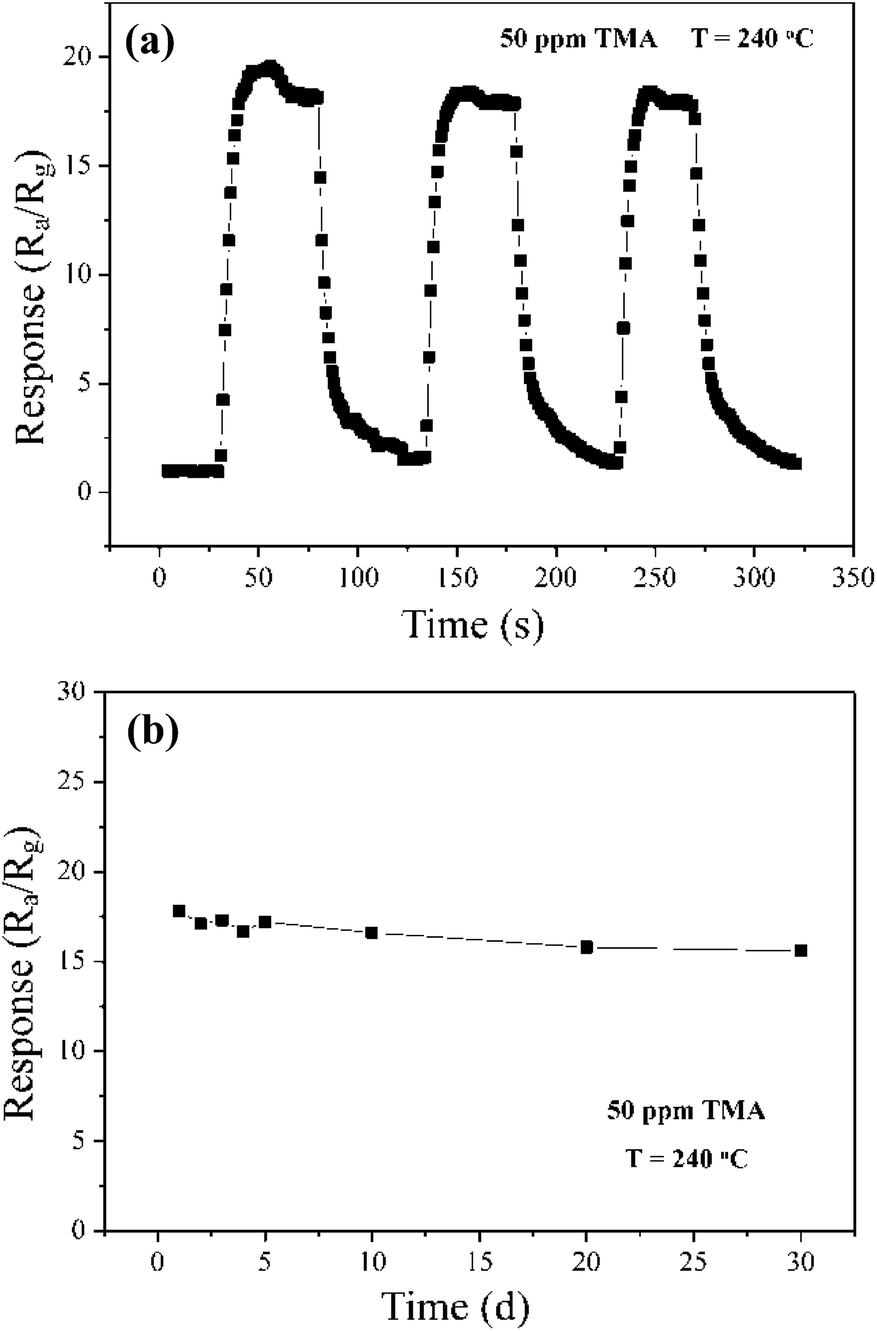
Fig. 6(a) illustrates the reproducibility of the sensor based on Ce-doped MoO3 nanobelts, revealing that the sensor maintains its initial response amplitude without obvious changes upon three successive sensing measurements to 50 ppm of TMA. In addition, within the 3 cycles, the sensor still maintains fast response and recovery state, which are demanded for practical application. The response and recovery times of Ce-doped MoO3 nanobelts sensor to 50 ppm TMA are less than 10 and 20 s, respectively, accords with practical application of gas sensors. Moreover, the response as a function of the number of testing days was investigated and shown in Fig. 6(b). The result further indicated the splendid long-term stability of the sensor based on Ce-doped MoO3 nanobelts.
 |
| | Fig. 6 (a) Three periods of response curve of Ce-doped MoO3 nanobelts to 50 ppm TMA at 240 °C and (b) long-term stability of Ce-doped MoO3 nanobelts sensor on successive exposure to 50 ppm TMA at 240 °C. | |
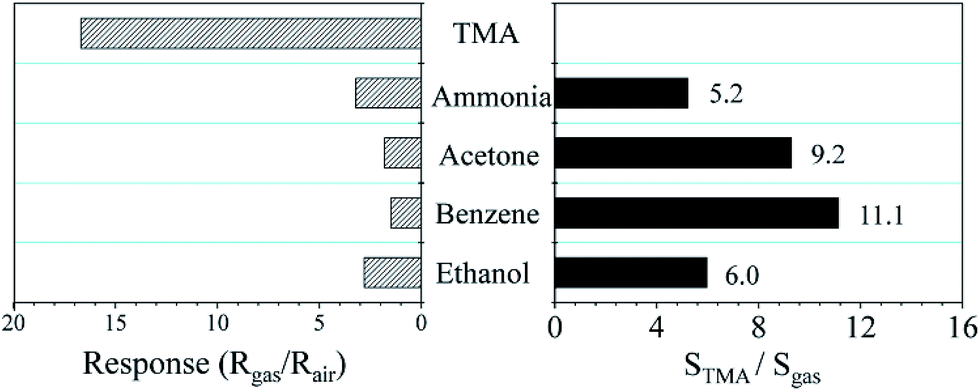
Selectivity is an important indicator of gas sensors in practical applications. The gas responses of Ce-doped MoO3 nanobelts towards different testing gases of 50 ppm TMA, ammonia, acetone, benzene, and ethanol are tested at 240 °C. As shown in Fig. 7, sensor response towards TMA is significantly higher than those of other gases. The selectivity of TMA is evaluated by the selectivity coefficient, which can be defined as:
where
STMA and
Sgas are sensor response towards TMA and any other gas. The selectivity coefficients for Ce-doped MoO
3 nanobelts based sensor were 5.2 to ammonia, 9.2 to acetone, 11.1 to benzene, and 6.0 to ethanol, indicating that Ce-doped MoO
3 nanobelts exhibit good selectivity to TMA gas.
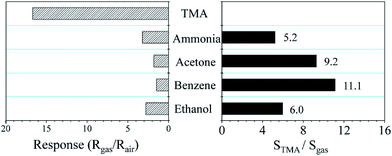 |
| | Fig. 7 Sensor response of Ce-doped MoO3 nanobelts towards 50 ppm TMA, ammonia, acetone, benzene, and ethanol at 240 °C and the selectivity to TMA (STMA and Sgas, gas responses to TMA and other gases, respectively). | |
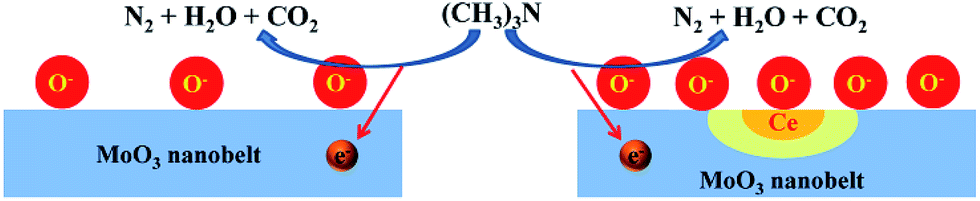
As generally mentioned earlier, the gas sensing mechanism of MoO3-based sensors belongs to the surface-controlled type, which is based on the change in sensor resistance, mainly caused by the adsorption and desorption of gas molecules on the surface of MoO3 structure.60–62 Fig. 8 shows the adsorption and reaction model of the sensing process on the surface of pure and Ce-doped MoO3 nanobelt. Generally, when MoO3 nanobelts are exposed to air atmosphere, oxygen molecules are adsorbed on the surface of nanobelts, and capture electron in the surface region, forming reactive oxygen species O(ads)−. When injected into testing chamber, TMA gases (reducing gas) can react with reactive oxygen species O− and release the trapped electrons back to the conduction band of MoO3, leading to the decrease of sensor resistance, which can be written as:63–66
| | |
2(CH3)3N + 21O(ads)− → N2 + 6CO2 + 9H2O + 21e−
| (5) |
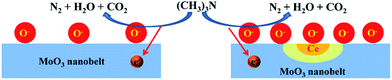 |
| | Fig. 8 Adsorption and reaction model of the sensing process on the surface of pure and Ce-doped MoO3 nanobelt. | |
In this work, the huge improvement in gas response by Ce-doping may be due to the promotion effect of oxygen vacancy, which will be produced when Ce atom replaces Mo atom. The forming of oxygen vacancy with double positive charge can be expressed by the Kröger–Vink notation:67
| |
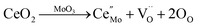 | (6) |
This result accords with the experiment of XPS (Fig. 3(c)). Based on the above formula, the relatively higher concentration surface oxygen vacancies can be formed due to Ce ions substitution, which is very important to the adsorption of oxygen on the surface of MoO3 nanobelts. On exposure to air, oxygen vacancies will be reduced by the incorporation of gaseous O2. Furthermore, as one of the most important rear-earth compounds, ceria has widely application in automobile exhaust catalysts for its stability to take and release oxygen under oxidizing and reducing conditions.68,69 Accordingly it is also conducive to more oxygen adsorption. Thus, we believe that the Ce site works as O2 absorbers and to some extent generate O− adsorption sites around Ce atoms, as shown in Fig. 8. Accordingly more electrons produced by the reaction between TMA and O− are released back to the conduction band of nanobelts, leading to higher gas response.
Conclusions
In summary, we developed a facile one-step hydrothermal route for the synthesis of pure and Ce-doped MoO3 nanobelts. Characterizations based on XRD, EDS, and XPS displayed that Ce atoms replaced into the crystals of MoO3 without destroying the original crystal structure. The Ce-doping is very important to the adsorption of oxygen on the surface of MoO3 nanobelts, which is conducive to the promotion of TMA sensing properties, including lower operating temperature and enhanced gas response. Therefore, it is expected Ce-doped MoO3 nanobelts may provide a new pathway to develop novel TMA gas sensors.
Acknowledgements
This work was financially supported by National Natural Science Foundation of China (No. 61102006 and 51672110), Natural Science Foundation of Shandong Province, China (No. ZR2015EM019 and ZR2014EL006), and Shandong Province Higher Educational Science and Technology Program (No. J15LA56).
Notes and references
- T. Hu, X. F. Chu, F. Gao, Y. P. Dong, W. Q. Sun and L. S. Bai, J. Solid State Chem., 2016, 237, 284 CrossRef CAS.
- K. Mitsubayashi, Y. Kubotera, K. Yano, Y. Hashimoto, T. Kon, S. Nakakura, Y. Nishi and H. Endo, Sens. Actuators, B, 2004, 103, 463 CrossRef CAS.
- P. M. Perillo and D. F. Rodriguez, J. Alloys Compd., 2016, 657, 765 CrossRef CAS.
- Y. H. Cho, Y. C. Kang and J. H. Lee, Sens. Actuators, B, 2013, 176, 971 CrossRef CAS.
- H. S. Kim, J. B. Cook, H. Lin, J. S. Ko, S. H. Tolbert, V. Ozolins and B. Dunn, Nat. Mater., 2017, 16, 454–460 CrossRef CAS PubMed.
- E. D. Hanson, L. Lajaunie, S. Q. Hao, B. D. Myers, F. Y. Shi, A. A. Murthy, C. Wolverton, R. Arenal and V. P. Dravid, Adv. Funct. Mater., 2017, 27, 1605380 CrossRef.
- X. F. Yang, C. Y. Lu, J. L. Qin, R. X. Zhang, H. Tang and H. J. Song, Mater. Lett., 2011, 65, 2341 CrossRef CAS.
- X. F. Yang, H. Y. Ding, D. Zhang, X. H. Yan, C. Y. Lu, J. L. Qin, R. X. Zhang, H. Tang and H. J. Song, Cryst. Res. Technol., 2011, 46, 1195 CrossRef CAS.
- X. F. Yang, H. Tang, R. X. Zhang, H. J. Song and K. S. Cao, Cryst. Res. Technol., 2011, 46, 409 CrossRef CAS.
- S. S. Sunu, E. Prabhu, V. Jayaraman, K. I. Gnanasekar, T. K. Seshagiri and T. Gnanasekaran, Sens. Actuators, B, 2004, 101, 161 CrossRef CAS.
- S. Barazzouk, R. P. Tandon and S. Hotchandani, Sens. Actuators, B, 2006, 119, 691 CrossRef CAS.
- W. S. Kim, H. C. Kim and S. H. Hong, J. Nanopart. Res., 2010, 12, 1889 CrossRef CAS.
- H. H. Yan, P. Song, S. Zhang, Z. X. Yang and Q. Wang, RSC Adv., 2015, 5, 72728 RSC.
- R. Pandeeswari and B. G. Jeyaprakash, Biosens. Bioelectron., 2014, 53, 182 CrossRef CAS PubMed.
- Y. H. Cho, Y. N. Ko, Y. C. Kang, D. Kim and J. H. Lee, Sens. Actuators, B, 2014, 195, 189 CrossRef CAS.
- X. F. Chu, S. M. Liang, W. Q. Sun, W. B. Zhang, T. Y. Chen and Q. F. Zhang, Sens. Actuators, B, 2010, 148, 399 CrossRef CAS.
- M. J. S. Spencer, Prog. Mater. Sci., 2012, 57, 437 CrossRef CAS.
- K. J. Choi and H. W. Jang, Sensors, 2010, 10, 4083 CrossRef CAS PubMed.
- N. Lu, X. Q. Gao, C. Yang, F. Xiao, J. D. Wang and X. T. Su, Sens. Actuators, B, 2016, 223, 743 CrossRef CAS.
- W. Jin, S. L. Yan, L. An, W. Chen, S. Yang, C. X. Zhao and Y. Dai, Sens. Actuators, B, 2015, 206, 284 CrossRef CAS.
- G. M. Peng, S. Q. Wu, J. E. Ellis, X. Q. Xu, G. Xu, C. L. Yu and A. Star, J. Mater.
Chem. C, 2016, 4, 6575 RSC.
- W. Zeng, B. Miao, T. F. Li, H. Zhang, S. Hussain, Y. Q. Li and W. J. Yu, Thin Solid Films, 2015, 584, 294 CrossRef CAS.
- S. Yang, Y. L. Liu, W. Chen, W. Jin, J. Zhou, H. Zhang and G. S. Zakharova, Sens. Actuators, B, 2016, 226, 478 CrossRef CAS.
- J. Zhang, P. Song, Z. Q. Li, S. Zhang, Z. X. Yang and Q. Wang, J. Alloys Compd., 2016, 685, 1024 CrossRef CAS.
- P. Li, H. Q. Fan, Y. Cai and M. M. Xu, CrystEngComm, 2014, 16, 2715 RSC.
- P. Li, H. Q. Fan, Y. Cai, M. M. Xu, C. B. Long, M. M. Li, S. H. Lei and X. W. Zou, RSC Adv., 2014, 4, 15161 RSC.
- B. R. Koo, I. K. Park and H. J. Ahn, J. Alloys Compd., 2014, 603, 52 CrossRef CAS.
- N. D. Singh, C. Y. Yan and P. S. Lee, Sens. Actuators, B, 2010, 150, 15 Search PubMed.
- N. Han, X. F. Wu, D. W. Zhang, G. L. Shen, H. D. Liu and Y. F. Chen, Sens. Actuators, B, 2011, 152, 324 CrossRef CAS.
- S. L. Bai, C. Chen, D. F. Zhang, R. X. Luo, D. Q. Li, A. F. Chen and C. C. Liu, Sens. Actuators, B, 2014, 204, 754 CrossRef CAS.
- T. Zhang, F. B. Gu, D. M. Han, Z. H. Wang and G. S. Guo, Sens. Actuators, B, 2013, 177, 1180 CrossRef CAS.
- D. Han, P. Song, S. Zhang, H. H. Zhang, Q. Xu and Q. Wang, Sens. Actuators, B, 2015, 216, 488 CrossRef CAS.
- P. Mohanapriya, H. Segawa, K. Watanabe, J. Watanabe, S. Samitsu, T. S. Natarajan, N. V. Jaya and N. Ohashi, Sens. Actuators, B, 2013, 188, 872 CrossRef CAS.
- C. Q. Ge, C. S. Xie and S. Z. Cai, Mater. Sci. Eng., B, 2007, 137, 53 CrossRef CAS.
- G. Neri, A. Bonavita, G. Rizzo, S. Galvagno, S. Capone and P. Siciliano, Sens. Actuators, B, 2006, 114, 687 CrossRef CAS.
- S. Balendhran, S. Walia, H. Nili, J. Qu, S. Zhuiykou, R. B. Kaner, S. Sriram, M. Bhakaran and K. Kalantarzadeh, Adv. Funct. Mater., 2013, 23, 3952 CrossRef CAS.
- K. Segawa, K. Ooga and Y. Kurusu, Bull. Chem. Soc. Jpn., 1984, 57, 2721 CrossRef CAS.
- X. L. Li, J. F. Liu and Y. D. Li, Appl. Phys. Lett., 2002, 81, 4832 CrossRef CAS.
- L. Seguin, M. Figlarz, R. Cavagnat and J. C. Lassegues, Spectrochim. Acta, Part A, 1995, 51, 1323 CrossRef.
- X. W. Lou and H. C. Zeng, Chem. Mater., 2002, 14, 4781 CrossRef CAS.
- Z. Jiang, Z. Guo, B. Sun, Y. Jia, M. Q. Li and J. H. Liu, Sens. Actuators, B, 2010, 145, 667 CrossRef CAS.
- C. Ge, C. Xie and S. Cai, Mater. Sci. Eng., B, 2007, 137, 53 CrossRef CAS.
- P. Song, Q. Wang and Z. X. Yang, Sens. Actuators, B, 2012, 173, 839 CrossRef CAS.
- S. S. Sunu, E. Prabhu, V. Jayaraman, K. I. Gnanasekar, T. K. Seshagiri and T. Gnanasekaran, Sens. Actuators, B, 2004, 101, 161 CrossRef CAS.
- H. Y. Chen, H. C. Su, C. H. Chen, K. L. Liu, C. M. Tsai, S. J. Yen and T. R. Yew, J. Mater. Chem., 2011, 21, 5745 RSC.
- O. Y. Khyzhun, T. Strunskus and Y. M. Solonin, J. Alloys Compd., 2004, 366, 54 CrossRef CAS.
- M. S. Yao, F. Ding, Y. B. Cao, P. Hu, J. M. Fan, C. Lu, F. L. Yuan, C. Y. Shi and Y. F. Chen, Sens. Actuators, B, 2014, 201, 255 CrossRef CAS.
- M. Chen, X. Wang, Y. H. Yu, Z. L. Pei, X. D. Bai, C. Sun, R. F. Huang and L. S. Wen, Appl. Surf. Sci., 2000, 158, 134 CrossRef CAS.
- G. J. Yang, D. Q. Gao, Z. H. Shi, Z. H. Zhang, J. Zhang, J. L. Zhang and D. S. Xue, J. Phys. Chem. C, 2010, 114, 21989 CAS.
- Y. C. Mao, W. Li, X. F. Sun, Y. J. Ma, J. Xia, Y. F. Zhao, X. H. Lu, J. Y. Gan, Z. Q. Liu, J. Chen, P. Liu and Y. X. Tong, CrystEngComm, 2012, 14, 1419 RSC.
- T. Sukonket, A. Khan, B. Saha, H. Ibrahim, S. Tantayanon, P. Kumar and R. Idem, Energy Fuels, 2011, 25, 864 CrossRef CAS.
- L. Jalowiecki-Duhamel, H. Zarrou and A. D'Huysser, Catal. Today, 2008, 138, 124 CrossRef CAS.
- Z. L. Liu, B. Guo, L. Hong and H. Jiang, J. Phys. Chem. Solids, 2005, 66, 161 CrossRef CAS.
- M. R. Benjaram, A. Khan, Y. Yamada, T. Kobayashi and S. Loridant, J. Phys. Chem. B, 2008, 107, 5162 Search PubMed.
- Y. L. Kuo, C. Lee, Y. S. Chen and H. Liang, Solid State Ionics, 2009, 180, 1421 CrossRef CAS.
- M. Arienzo, L. Armelao, C. M. Mari, S. Polizzi, R. Ruffo, R. Scotti and F. Morazzoni, J. Am. Chem. Soc., 2011, 133, 5296 CrossRef PubMed.
- L. X. Zhang, J. H. Zhao, H. Q. Lu, L. Li, J. F. Zheng, H. Li and Z. P. Zhu, Sens. Actuators, B, 2012, 161, 209 CrossRef CAS.
- X. J. Liu, Z. Chang, L. Luo, X. D. Lei, J. F. Liu and X. M. Sun, J. Mater. Chem., 2012, 22, 7232 RSC.
- N. Yamazoe and K. Shimanoe, Sens. Actuators, B, 2008, 128, 566 CrossRef CAS.
- Q. Y. Ouyang, L. Li, Q. S. Wang, Y. Zhang, T. S. Wang, F. N. Meng, Y. J. Chen and P. Gao, Sens. Actuators, B, 2012, 169, 17 CrossRef CAS.
- L. N. Wang, X. Zhang, Y. Ma, M. Yang and Y. X. Qi, Mater. Lett., 2016, 164, 623 CrossRef CAS.
- A. T. Güntner, M. Righettoni and S. E. Pratsinis, Sens. Actuators, B, 2016, 223, 266 CrossRef.
- W. H. Zhang and W. D. Zhang, Sens. Actuators, B, 2008, 134, 403 CrossRef CAS.
- R. Zhang, L. L. Wang, J. N. Deng, T. T. Zhou, Z. Lou and T. Zhang, Sens. Actuators, B, 2015, 220, 1224 CrossRef CAS.
- K. M. Kim, K. I. Choi, H. M. Jeong, H. J. Kim, H. R. Kim and J. H. Lee, Sens. Actuators, B, 2012, 166–167, 733 CrossRef CAS.
- C. H. Kwar, H. S. Woo and J. H. Lee, Sens. Actuators, B, 2014, 204, 231 CrossRef.
- F. A. Kröger and H. J. Vink, Solid State Phys., 1956, 3, 307 Search PubMed.
- I. Shinji, O. Hironobu, M. Takanori and K. Noriyoshi, J. Rare Earths, 2004, 44, 188 Search PubMed.
- C. Li, K. Domen, K. I. Maruya and T. Onishi, J. Am. Chem. Soc., 1989, 111, 7683 CrossRef CAS.
Footnote |
| † Electronic supplementary information (ESI) available: TG-DSC curves of the conversion of (NH4)6Mo7O24·4H2O. See DOI: 10.1039/c7ra02893h |
|
| This journal is © The Royal Society of Chemistry 2017 |
Click here to see how this site uses Cookies. View our privacy policy here. 
 Open Access Article
 This Open Access Article is licensed under a
  *
*