
 Open Access Article
 This Open Access Article is licensed under a Creative Commons Attribution-Non Commercial 3.0 Unported Licence
Charge/discharge characteristics of Jahn–Teller distorted nanostructured orthorhombic and monoclinic Li2MnSiO4 cathode materials
Prince Babbara,
Brajesh Tiwarib,
Bhagyesh Purohita,
Aleksandr Ivanishchevcd,
Alexei Churikovd and
Ambesh Dixit *a
*a
aDepartment of Physics, Center for Solar Energy, Indian Institute of Technology, Jodhpur, Rajasthan 34211, India
bDepartment of Physics, Institute of Infrastructure Technology, Research and Management, Ahmedabad, Gujarat 380026, India
cCenter for Electrochemical Energy Storage, Skolkovo Institute of Science and Technology, Skolkovo Innovation Center, 3 Nobel str., Moscow, 143026, Russia
dInstitute of Chemistry, National Research Saratov State University named after N. G. Chernyshevsky, 83 Astrakhanskaya str., 410012, Russia
First published on 26th April 2017
Abstract
Li2MnSiO4 is a promising cathode material for lithium ion rechargeable batteries, however, synthesizing the desired crystallographic phase is challenging. We report the synthesis and electrochemical charge/discharge studies of carbon coated nanostructured Li2MnSiO4 in orthorhombic and monoclinic crystallographic phases. Li2MnSiO4 has been synthesized using solid state and sol–gel processes in bulk and nano-geometries without and with carbon coatings. The electrochemical performance of these Li2MnSiO4 samples was measured at a C/20 charge/discharge rate within 1.5–4.8 V voltage window. The first charge specific capacities are ∼290 mA h g−1 and ∼180 mA h g−1 for Li2MnSiO4 orthorhombic and monoclinic phase cathode materials. Charging–discharging of cells suggests that the degradation is lower for monoclinic Li2MnSiO4 cathode materials compared to that of orthorhombic Li2MnSiO4 cathode materials. This can be understood in terms of the relatively large electronic band gap and associated Jahn–Teller distortion observed in Li deficient Li2MnSiO4 materials, where Mn3+ intrinsically may lead to irreversible effective lithium insertion in distortion free starting Li2MnSiO4 materials for monoclinic materials.
Introduction
Efficient electrical storage is a challenge, not only for technological advancements but also to understand fundamental issues such as the design of materials, which may provide high operating voltage and high energy density simultaneously. Technological advancement has increased the demand for electrical energy storage at different levels. Recently rechargeable lithium-ion batteries have shown promise and are used in various small electronic gadgets (laptops, mobiles etc.), and power applications including hybrid vehicles, electric vehicles etc. Such developments rely on efficient cathode materials, which should exhibit high energy/power density, temperature stability, non-toxicity, long lifetime and lower material cost.1,2There are two important cathode materials, LiCoO2 and LiFePO4, used in commercial rechargeable lithium ion batteries. Among these, LiCoO2 is expensive and toxic material. In addition, LiCoO2 is not stable at higher temperatures,3 which further hinders its' use in power electronics and hybrid electric vehicle applications. The polyanion LiFePO4 and its derivative systems have shown promise and are commercialized due to its' stronger P–O bond stability, non-toxic nature and relatively lower materials' cost with large specific capacity ∼170 mA h g−1.4,5 However, the specific capacity requirements are on the higher side for high power applications. Thus, this provides room for design and development of alternative cathode materials, which should provide higher specific capacity and also have other materials' advantages simultaneously. Recently, orthosilicate based polyanion materials such as Li2TMSiO4 (TM = Fe, Mn, Co, Ni) are gaining attention and may fill the gaps for high energy density cathode materials. The theoretical high specific capacity (∼333 mA h g−1) of these materials is due to 2Li+ contribution for ionic exchange during Li2TM2+SiO4 ↔ TM4+SiO4 + 2Li+ + 2e−, electrochemical reaction. This simultaneously provides the two electron transfers during each charge/discharge cycle. These materials provide high thermal stability due to the strong Si–O covalent bonds, enhancing safety.6,7
There are four possible Li2TMSiO4 polymorphs, two orthorhombic (Pmn21 (ref. 8) and Pmnb;9 Gummow et al., 2012) and two monoclinic (P21/n and Pn)10 (Politaev et al., 2007). These materials fall into the family of tetrahedral structures, consisting of closed pack oxygen tetragonal with cations at the tetrahedral sites. The different cation distribution possibilities at tetrahedral sites may lead to the different structures, posing challenges in realizing single-phase materials. However, these can be overcome by optimizing pre and post synthesis process conditions such as using different initial precursors, annealing temperature, heating/cooling rates, environmental conditions.
The orthorhombic system provides two-dimensional lithium network, whereas monoclinic provides the three-dimensional connected network for lithium ion transport during charge/discharge cycles.1,2 These networks may provide the efficient lithium ion transport, making them suitable for next generation high energy density electrode materials. Among different transition metals, Li2FeSiO4 (LFS)41–43 and Li2MnSiO4 (LMS) have been explored widely because of their suitable operating voltage window. This lies within the existing electrolyte stability voltage range for the deintercalation of 2Li+ ions in these materials. LMS material has an advantage over LFS because of relatively easier deintercalation process and thus may provide higher specific capacity at higher cell voltage, and higher energy density than that of LFS material system.11–13 With all these advantages, LMS system suffers from various disadvantages such as poor electronic conductivity, low lithium diffusion coefficient and poor electrochemical performance.1–8 Table 1 summarizes the performance of Li2MnSiO4 materials, as observed from different research groups, including the present work, as discussed later. The important point is that performance of the Li2MnSiO4 material in any geometrical pristine or carbon composite forms has shown degradation from the initial cycle. The degradation has been observed in only few cycles, as listed in Table 1.
| S. no. | Material | Initial capacities (mA h g−1) | Degaraded capacities (mA h g−1) | Degradation (%) | Cycle number | Reference |
|---|---|---|---|---|---|---|
| 1 | Monodisperse LMS nanoparticles | 292 | 183 | 37.32 | 5 | 40 and 44 |
| 2 | Hierarchical LMS nanostructures | 283 | 235 | 16.96 | 5 | |
| 3 | 30–50 nm LMS nanoparticles | 222 | 172 | 22.52 | 5 | |
| 4 | 70–100 nm LMS nanopoarticles | 125 | 110 | 12 | 5 | |
| 5 | C/LMS nanocomposite | 192 | 115 | 40.1 | 30 | 39 |
| 6 | 5–10 nm C/LMS nanocomposite | 100 | 90–100 | 10 | 10 | 38 |
| 7 | Li2MnSiO4 (pure) | 245 | 80 | 67.34 | 10 | 37 |
| 8 | Li2.5Mn1SiO4 (lithium rich) | 186 | 40 | 78.49 | 10 | |
| 9 | Li2MnSiO4/C composite | 240 | 109 | 54.58 | 30 | 36 |
| 10 | Li2MnSiO4/C composites | 268 | 136 | 49.25 | 140 | 35 |
| 11 | Li2Mn0.94Ni0.06SiO4/C | 182.9 | 128.9 | 29.52 | 20 | 34 |
| 12 | Pure LMS | 209 | 140 | 33.01 | 10 | 7 |
| 13 | Pure LMS | 81 | 45 | 44.44 | 30 | 33 |
| 14 | C/LMS | 144 | 111 | 22.91 | 30 | |
| 15 | LMS/C composite compound | 132 | 118 | 10.60 | 10 | 32 |
| 16 | LMS | 142 | 62 | 56.33 | 50 | 31 |
| 17 | LMS pure | 141 | 102 | 27.65 | 10 | 30 |
| 18 | Solid state orthorhombic LMS | 94 | 65 | 30.85 | 10 | Present work |
| 19 | Sol–gel orthorhombic LMS | 286 | 50 | 82.52 | 10 | |
| 20 | Sol–gel monoclinic LMS | 100 | 65 | 35.00 | 10 |
Bulk LMS synthesized by solid state reaction route material exhibits low ∼10–40 mA h g−1 charge/discharge capacity. This poor performance has been attributed to the low electrical and ionic conductivities and also the structural instabilities during charge/discharge cycles.7 This material is not stable with large number of charge/discharge cycles due to its structural changes during cycling, which is responsible for the observed large capacity fading in these materials. This fading of electrochemical capacity in these compounds has been suggested to be due to the associated Jahn–Teller active Mn3+ ion, leading to the amorphous phase after few cycles of crystalline LMS.14
Numerous approaches have been investigated and utilized for different cathode materials to increase the electrochemical performance, such as particle size reduction and a carbon coating on core nanoparticles etc. These can also be integrated during the synthesis of LMS materials. There are several reports from different groups to achieve the theoretical specific capacity including the conventional solid-state route,15,16 sol–gel combustion,6,17 pechini sol–gel route,18 supercritical solvothermal method,19 graphene assisted synthesis,20 and microwave-solvothermal synthesis13 etc. The materials synthesized using any of these processes resulted in a relatively poor electrochemical capacity and even worse is the fading of electrochemical performance in few charge/discharge cycles only. In this paper, we are reporting the synthesis of LMS in different phase using the solid-state and sol–gel routes and their electrochemical performances. The structural and optical properties were carried out in order to understand the observed capacity fading during the electrochemical performances. Though, solid-state process has not resulted in the single phase, sol–gel method leads to crystallographically phase pure orthorhombic and monoclinic LMS material with better charge/discharge characteristics.
Experimental details
Sold state and sol–gel methods are used to synthesize LMS materials in different crystallographic phases and geometries. In solid-state synthesis route, lithium acetate dihydrate (LiAc), manganese acetate tetrahydrate (MnAc) and silicon acetate (SiAc) precursors were weighed in stoichiometry and mixed in a stainless steel jar using ball-milling in ethanol medium, at 100 rpm (rounds per minute) for 24 hours. This mixture was dried in oven at 80 °C for 6 hours and annealed at 300 °C for 3 hours under 10% H2 and 90% Ar dynamic atmospheric conditions. The prepared powder was ground and heated again at 650 °C for 6 hours under similar environmental conditions to further characterizations.The two different sol–gel methods were optimized to achieve nanostructured LMS materials orthorhombic (Pmn21) and monoclinic (P21/n) phases. For orthorhombic phase, LiAc, MnAc and silicon dioxide (SiO2) were dissolved separately in ethanol medium, ensuring the desired stoichiometric ratio. Lauric acid (LA) was also dissolved separately in ethanol maintaining the molar ratio of 1![[thin space (1/6-em)]](https://www.rsc.org/images/entities/char_2009.gif) :0.25 for MnAc and LA. Here LA was added as a chelating agent and source of carbon in this solution. LiAc and MnAc solutions were mixed, followed by addition of ethanol based SiO2 solution under continuous stirring for another one hour. This final solution was heated at 80 °C with continuous stirring until dried. The dried powder was ground and heated at 300 °C for 3 hours under 10% H2 and 90% Ar dynamic atmospheric conditions. The obtained powder was further ground and finally heated at 650 °C for 7 hours under similar gaseous environment to achieve the nanostructured carbon coated orthorhombic LMS phase.
:0.25 for MnAc and LA. Here LA was added as a chelating agent and source of carbon in this solution. LiAc and MnAc solutions were mixed, followed by addition of ethanol based SiO2 solution under continuous stirring for another one hour. This final solution was heated at 80 °C with continuous stirring until dried. The dried powder was ground and heated at 300 °C for 3 hours under 10% H2 and 90% Ar dynamic atmospheric conditions. The obtained powder was further ground and finally heated at 650 °C for 7 hours under similar gaseous environment to achieve the nanostructured carbon coated orthorhombic LMS phase.
For monoclinic phase, the process was followed from Dominko et al.'s work.18 LiAc 0.01875 M and MnAc 0.009375 M were dissolved in 25 ml deionized (DI) water separately. SiO2 particles 0.1 M were ultrasonicated for one hour in 100 ml DI water. Then, citric acid (CA) and ethylene glycol (EG) in a molar ratio of 1:3 (0.003125 M of CA and 0.009375 M of EG) were added to the SiO2 solution and stirred for one hour. After that, LiAc and MnAc solutions were added in this solution and left for another one hour under continuous stirring. Here citric acid is acting as a chelating agent and ethylene glycol as the source of carbon. Further, the solution was heated at 80 °C for drying. The obtained powder was ground and heated at 300 °C for 3 hours in 10% H2 and 90% Ar dynamic atmospheric condition, reground and finally heated at 700 °C for 7 hours in the same atmospheric condition to achieve the nanostructured carbon coated monoclinic LMS phase.
The synthesized LMS powder samples were analyzed using X-ray diffraction (D8 advance Bruker diffractometer) with copper Kα (1.5401 Angstrom) incident radiation to investigate the crystallographic phases and related structural parameters. The Fourier Transform Infrared (FTIR) spectroscopy (Bruker make Vertex 70 model) system was used to find out the vibrational modes in these materials. Scanning electron microscope (Carl Zeiss make SEM EVO 18 model) was used to explore the morphology for these synthesized nanostructured materials and energy dispersive X-ray (EDX) spectroscopy measurements were carried out for elemental analysis. The high resolution transmission electron microscopy (TEM) measurements are carried out to understand the microstructural properties and possible carbon shell coating on LMS core. UV-Vis spectroscopy (Varian make Cary 4000 model) was used to evaluate the optical band gap of these synthesized materials. The electrochemical cyclic voltammetry measurements are carried out using METROHM Autolab electrochemical work station. The electrochemical measurements were carried out in half coin cell structures, as described later, for charge/discharge performance using Neware Battery Tester system with lithium metal as a counter electrode.
Results and discussion
The measured X-ray diffraction (XRD) patterns are plotted in Fig. 1 for LMS cathode materials synthesized using different synthesis conditions. These XRD patterns suggest that LMS power sample synthesized via solid state route has crystallized into orthorhombic (space group Pmn21) crystallographic phase with minor Mn2SiO4 phase has been observed and marked in Fig. 1(a). The observation of such impurities has also been reported by other authors and is a common problem with solid-state LMS material.15,21,22 However, sol–gel route has resulted into nanostructured phase pure LMS materials and as explained in section experimental details. Here, two different sol–gel approaches led to the synthesis of phase pure orthorhombic, Fig. 1(b), and monoclinic, Fig. 1(c), crystallographic phases. The crystal plans are indexed according to Vanchiappan et al.21 for orthorhombic and Devaraj et al.6 for monoclinic phase. No impurity phases are observed within the experimental resolutions, including the starting base material in any one of these sol–gel synthesized materials. The crystallite size has been estimated using Scherrer formula and ∼11.38 ± 1.52 and ∼14.65 ± 1.69 nm crystallite size are recorded for orthorhombic and monoclinic LMS samples respectively.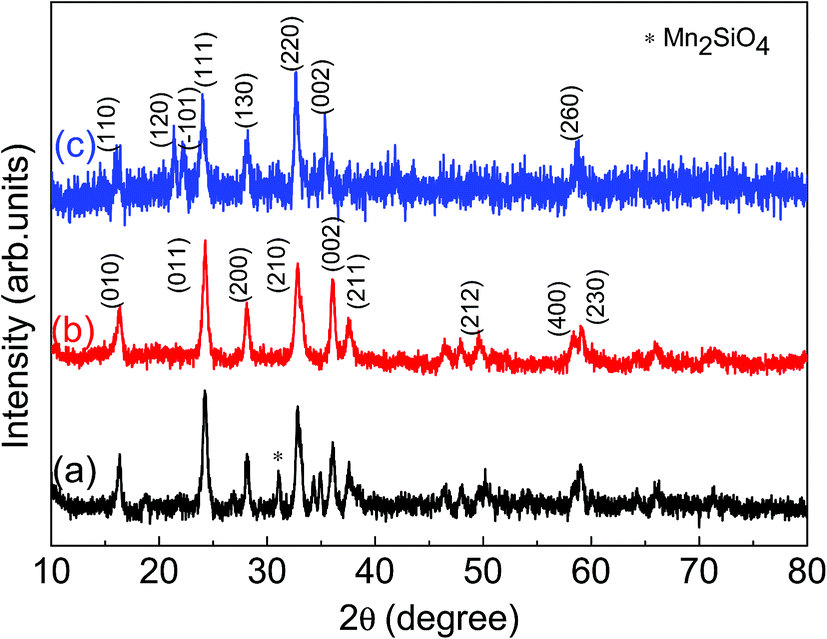 | ||
| Fig. 1 X-ray diffraction (XRD) pattern for (a) solid state orthorhombic (Pmn21) LMS material with minor Mn2SiO4 phase, (b) sol–gel orthorhombic (Pmn21) and (c) sol–gel monoclinic (P21/n) LMS materials. | ||
The phase purity of these synthesized materials has further been confirmed using room temperature FTIR measurements and the measured percent (%) transmittance against wavenumber are plotted Fig. 2. The characteristic vibrational peak ∼447 cm−1 correspond to O–Li–O bending vibration of LiO4 tetrahedra.16–18 The vibrational peaks, within 510–589 cm−1 band, correspond to the bending vibrations of O–Si–O and the vibrational peaks, within 876–929 cm−1 band, correspond to the stretching vibrations of Si–O bonds of SiO4 tetrahedra.20–24 All these frequency bands are marked in Fig. 2 for easy identification. The small peaks ∼733 cm−1 and ∼1054 cm−1 in solid state LMS powder sample may suggest the presence of impurity phases in the material, as also observed in XRD measurements, Fig. 1(a). These characteristic vibrational modes are in agreement with the observed results in literature.23–26 The presence of carbon can noticed from the C–O vibrational modes near 1500 cm−1 for both orthorhombic and monoclinic LMS samples, which is not seen for solid state orthorhombic LMS material. These observations confirm the presence of carbon coating in sol–gel synthesized nanostructured materials.
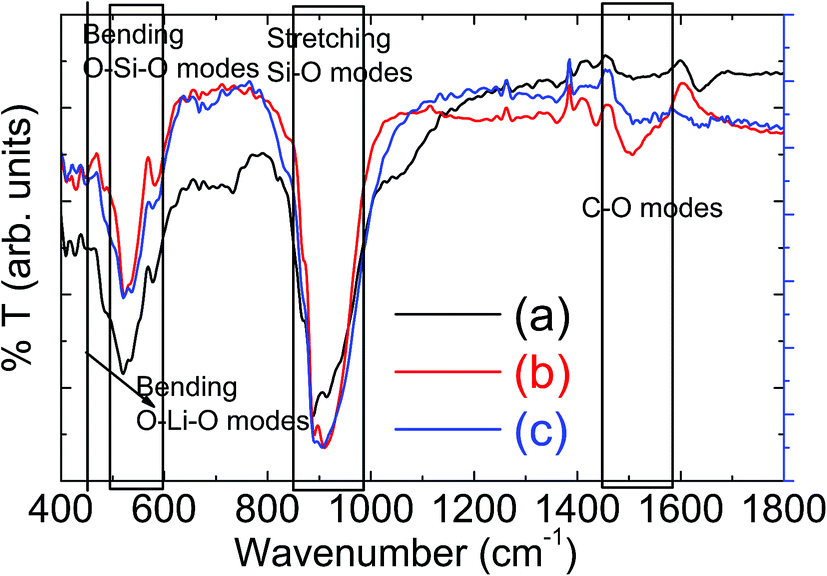 | ||
| Fig. 2 Fourier Transform Infrared (FTIR) spectroscopic measurements on powder samples for (a) solid state orthorhombic LMS (b) sol–gel derived orthorhombic and (c) sol–gel monoclinic LMS material. | ||
The microstructural information has been investigated using SEM and is summarized in Fig. 3 for all the three LMS samples, used in present investigations. All these samples show agglomeration with different agglomerated particulates. The orthorhombic crystallographic phase showed a tendency to form the stacked type agglomerated particulates, synthesized using both solid-state or sol–gel routes (Fig. 3(a) and (b)). These morphologies are not useful for charging/discharging processes, as Li+ ion cannot be intercalated efficiently into such agglomerated materials. The EDX data is summarized in Table 2 for these samples. These observations suggest that the near stoichiometric materials, where Mn and Si atomic fractions are same within the experimental limitations of EDX measurements. The metallic lithium was not possible to detect with the present SEM-EDX due to its low atomic number. In addition, a large fraction of carbon has also been observed, substantiating the fact that initial carbon precursor has reacted forming a shell on LMS core materials in nanoparticle geometries.
 | ||
| Fig. 3 Scanning Electron Microscopic (SEM) measurements for (a) solid state orthorhombic (b) sol–gel derived orthorhombic and (c) sol–gel derived monoclinic LMS materials' powder samples. | ||
| Elemental% fraction | Solid-state LMS | Orthorhombic LMS | Monoclinic LMS |
|---|---|---|---|
| Mn | 3.6 | 6.405 | 3.41 |
| Si | 3.75 | 5.83 | 3.52 |
| O | 41.5 | 55.1 | 44.94 |
| C | 32.66 | 48.135 |
The carbon coating was further confirmed by carrying out transmission electron microscopic (TEM) measurements, as shown in Fig. 4. The left panel of Fig. 4 suggests that average particle size is ∼40 nm ± 5 nm, a bit larger than what inferred from X-ray diffraction measurements, as discussed earlier in the text. A thin coating of carbon can be observed on these LMS nanoparticles. This is clearly noticeable in high resolution TEM image, as shown in right panel Fig. 4 and thickness of this carbon coating is ∼1–2 nm. This is consistent with FTIR measurements where high wavenumber C![[double bond, length as m-dash]](https://www.rsc.org/images/entities/char_e001.gif) O bonds vibrational frequencies have been observed for all these LMS materials.
O bonds vibrational frequencies have been observed for all these LMS materials.
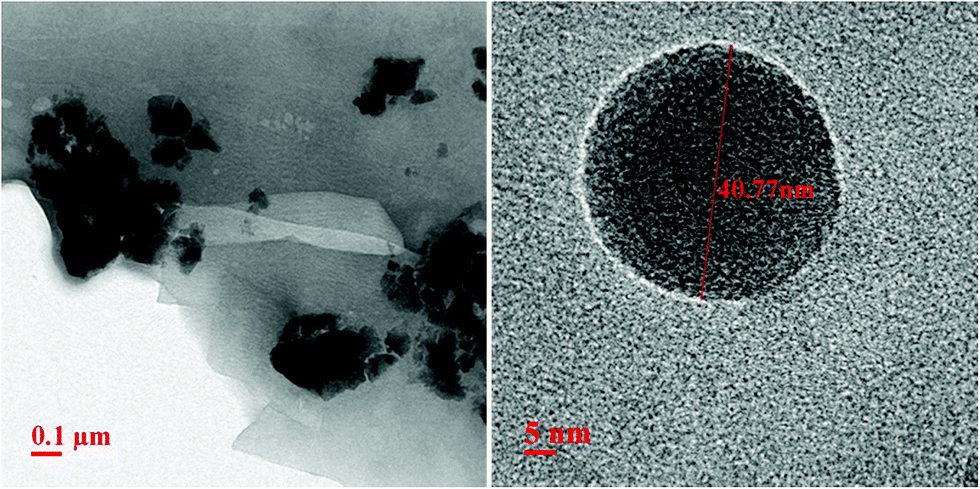 | ||
| Fig. 4 Transmission electron microscopic (TEM) measurements of sol–gel derived LMS materials, showing agglomerated lumps (left panel) and individual nanoparticle high resolution TEM image showing carbon coating of few nanometer (right panel). | ||
The electronic properties of synthesized powder materials have been investigated using diffuse reflectance spectroscopic measurements. The diffuse reflectance versus wavelength has been recorded and used to calculate the absorption using Kubelka–Munk model as F(R) = α(λ) = (1 − R)2/2R; where R is the measured diffuse reflectance for the sample. The calculated (αE)2 versus energy E (=hc/λ); h is Planck constant (=6.626 × 10⁻³⁴ Js); c is the speed of light (=3 × 10⁸ ms−1) and λ is the corresponding wavelength are plotted in Fig. 4 for all the three LMS samples. These measurements suggest that both orthorhombic and monoclinic LMS materials exhibit the direct band gaps. The linear extrapolation with E = 0 lines, as shown in Fig. 5, are used to estimate the band gap values and are ∼1.26 and 1.19 eV for orthorhombic and monoclinic LMS materials respectively. Thus, monoclinic phase is showing relatively lower band gap value. The inset of Fig. 5 (top panel) also shows (αE)0.5 versus energy E plots, excluding the possibility of indirect band gap for these materials. These band gap values are in agreement with theoretical reports with relatively lower band gap values for monoclinic (P21/n) LMS phase as compared to the orthorhombic (Pmn21) LMS crystallographic phase.27,28 The low band gap of monoclinic (P21/n) LMS may be more beneficial in achieving the higher electrical conductivity and electron mobility, which may assist towards enhanced electrochemical performance. In addition, the effective chemical doping with higher valence states at manganese or silicon cation sites can be used to tailor the electrical conductivity at the desired level.
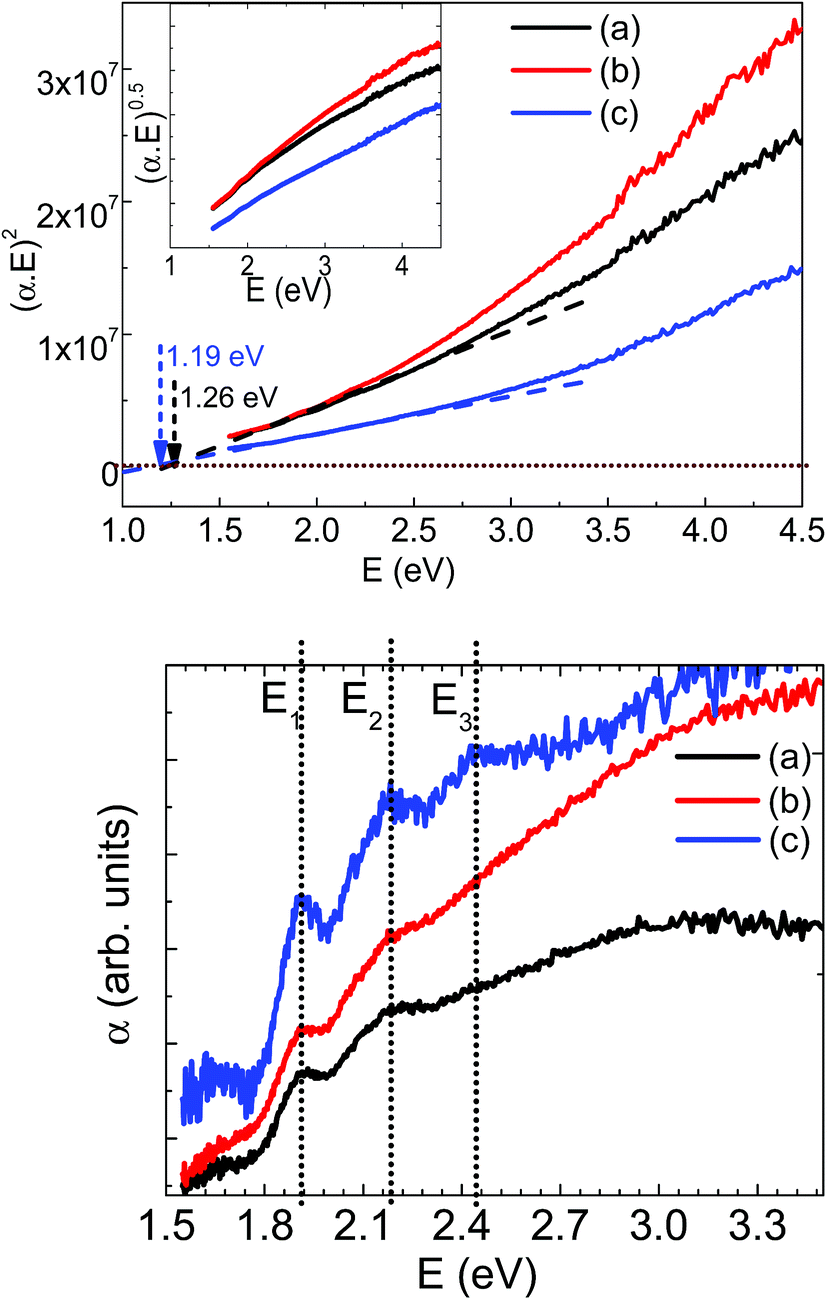 | ||
| Fig. 5 Top panel: (αE)2 versus energy measurements for (a) solid state orthorhombic, (b) sol–gel derived orthorhombic and (c) sol–gel derived monoclinic LMS materials. The linear extrapolation at E = 0 has been used for estimating the optical band gap of these materials with inset showing (αE)0.5 versus energy for respective samples. Bottom panel: absorption versus energy, showing possible manganese interband absorption peaks. | ||
The absorption spectra can be used as a tool to confirm the oxidation state of Mn which in turn related to Li content in LMS. Further to trace down any possibility for the presence of mixed valence of Mn cations, absorption versus energy data is plotted in the bottom panel, Fig. 5. The orthorhombic LMS materials showed only two E1 and E2 absorption peaks at 1.913 eV, and 2.185 eV respectively and monoclinic LMS materials showed three absorption peaks at 1.913, 2.185 and 2.446 eV as marked by E1, E2 and E3 in the respective figure. The observation of these absorption peaks confirms the presence of mixed valence Mn ions in LMS materials and thus, substantiating the possibility of Jahn–Teller distortion in these LMS materials.
Further, to understand the electrochemical properties of synthesized materials, the cathode electrodes were prepared by mixing the active LMS material, carbon super P as an electrical conductor and polyvinylidene fluoride as a binder in the ratio of 77:15:8 and grinding using mortar–pestle for ensuring the homogeneity. N-methyl-2-pyrrolidone (NMP) solution was added to this mixture to make slurry of the electrode material. The LMS cathodes were prepared by coating this slurry on aluminum foil using doctor blade technique. After homogeneous thick coating, the aluminum foil with LMS material was dried in an oven at 80 °C for 8 hours. The dried electrode material on aluminum foil was punched in circular discs of 16 mm diameter. The cathode and coin cell components with lithium metal as anode were assembled in inert Ar-filled glove box. The LiPF6 in EC:DC:DMC (1:1:1) solvent has been used as an electrolyte, in conjunction with a separator. Finally, the assembled components were crimped to get the coin cell, which was taken out from the Ar filled glove box for electrochemical measurements. These measurements were carried out at 1.5–4.8 V operating voltage window at C/20 rate in CR2032 half coin cell configuration.
The cyclic voltammetry measurements were carried out at 0.5 mV s−1 scan rate and results are summarized in Fig. 6 for orthorhombic LMS material. The three small signatures at 3.8 V, 4.5 V and 4.7 V in the first C–V cycle represent the oxidation states. The 2.9 V and 3.5 V signatures are attributed to Mn2+/Mn3+ and Mn3+/Mn4+ redox transitions respectively.11 The transitions at 3.2 V and 2.2 V may correspond to Mn4+/Mn2+ and Mn3+/M2+ respectively. These transitions are overlapping and thus, suggesting nearly voltage independent redox reactions. However, there is a large gap in redox transition voltages, and thus, may be a probable reason for the observed lower reversibility of orthorhombic LMS material.
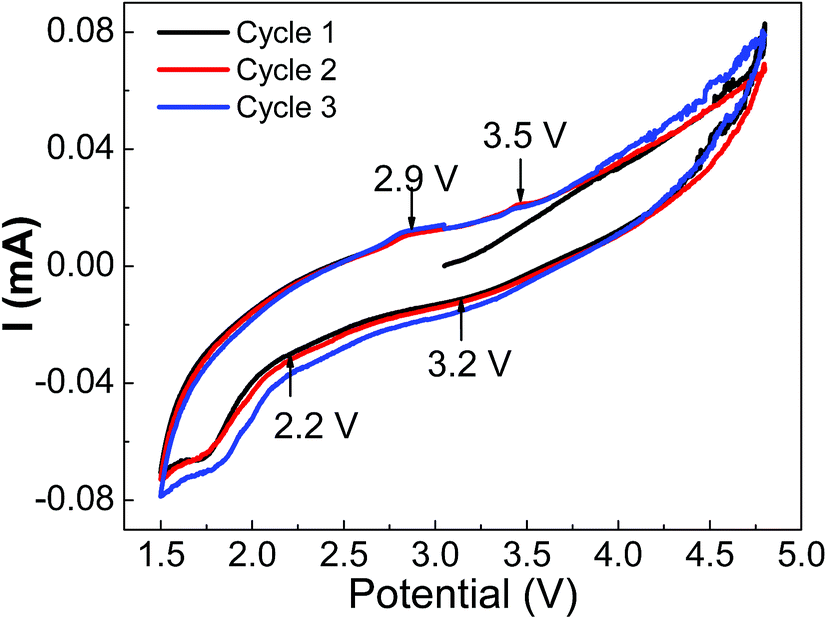 | ||
| Fig. 6 The cyclic voltammetry performance of orthorhombic LMS cathode materials in half coin cell geometry, showing the probable redox potentials. | ||
The measured charge/discharge capacities are summarized in Fig. 7 for these samples with capacity fading versus number of cycles as an inset in the respective figures. The solid-state synthesized orthorhombic (Pmn21) phase LMS material has also been subjected to electrochemical charge/discharge measurements and results are summarized in Fig. 7(a). The first charge/discharge cycle capacities are ∼94 mA h g−1 and ∼82 mA h g−1 respectively (shown in Fig. 7(a)), and the charge/discharge capacities faded after ten cycles up to 65 mA h g−1 and 60 mA h g−1 respectively. These measurements on solid state derived electrode materials suggest that minority Mn2SiO4 phase in LMS is not playing any significant role except the volumetric density reduction in electrochemical capacity. The sol–gel derived orthorhombic LMS electrode has shown 286 mA h g−1 electrochemical capacity during the first charge cycle, Fig. 7(b). The observed high charging capacity suggests that approximately ∼1.72 Li+ ions have taken part effectively in this process. However, only one Li+ ion could intercalate back during the first discharge cycle, giving rise to the relatively poor specific capacity of 170 mA h g−1, which is nearly half of the theoretical capacity (333 mA h g−1). The depleted Li resulted in Mn4+ in MnSiO4, which is Jahn–Teller active on tetrahedral site destabilizing the structure and fading performance upon few cycles only. In the subsequent charging/discharging cycles, capacities decreased and only in ten such charge/discharge cycles, electrochemical capacities reduced up to 50 mA h g−1, a very low value as compared to the initially observed charge/discharge capacity. The monoclinic (P21/n) LMS electrode showed 181 mA h g−1 capacity during the first charging cycle and 100 mA h g−1 capacity in the first discharge cycle, Fig. 7(c), which are relatively lower to that observed for orthorhombic LMS electrode material. These measurements suggest that capacity has reduced up to ∼65 mA h g−1 in ten charge/discharge cycles. The relatively lower capacity fading for monoclinic LMS electrode material has been attributed to its' higher Li+ ionic mobility as compared to that of orthorhombic LMS electrode material because of nanostructured porous material as observed in SEM micrographs, Fig. 3(c).29
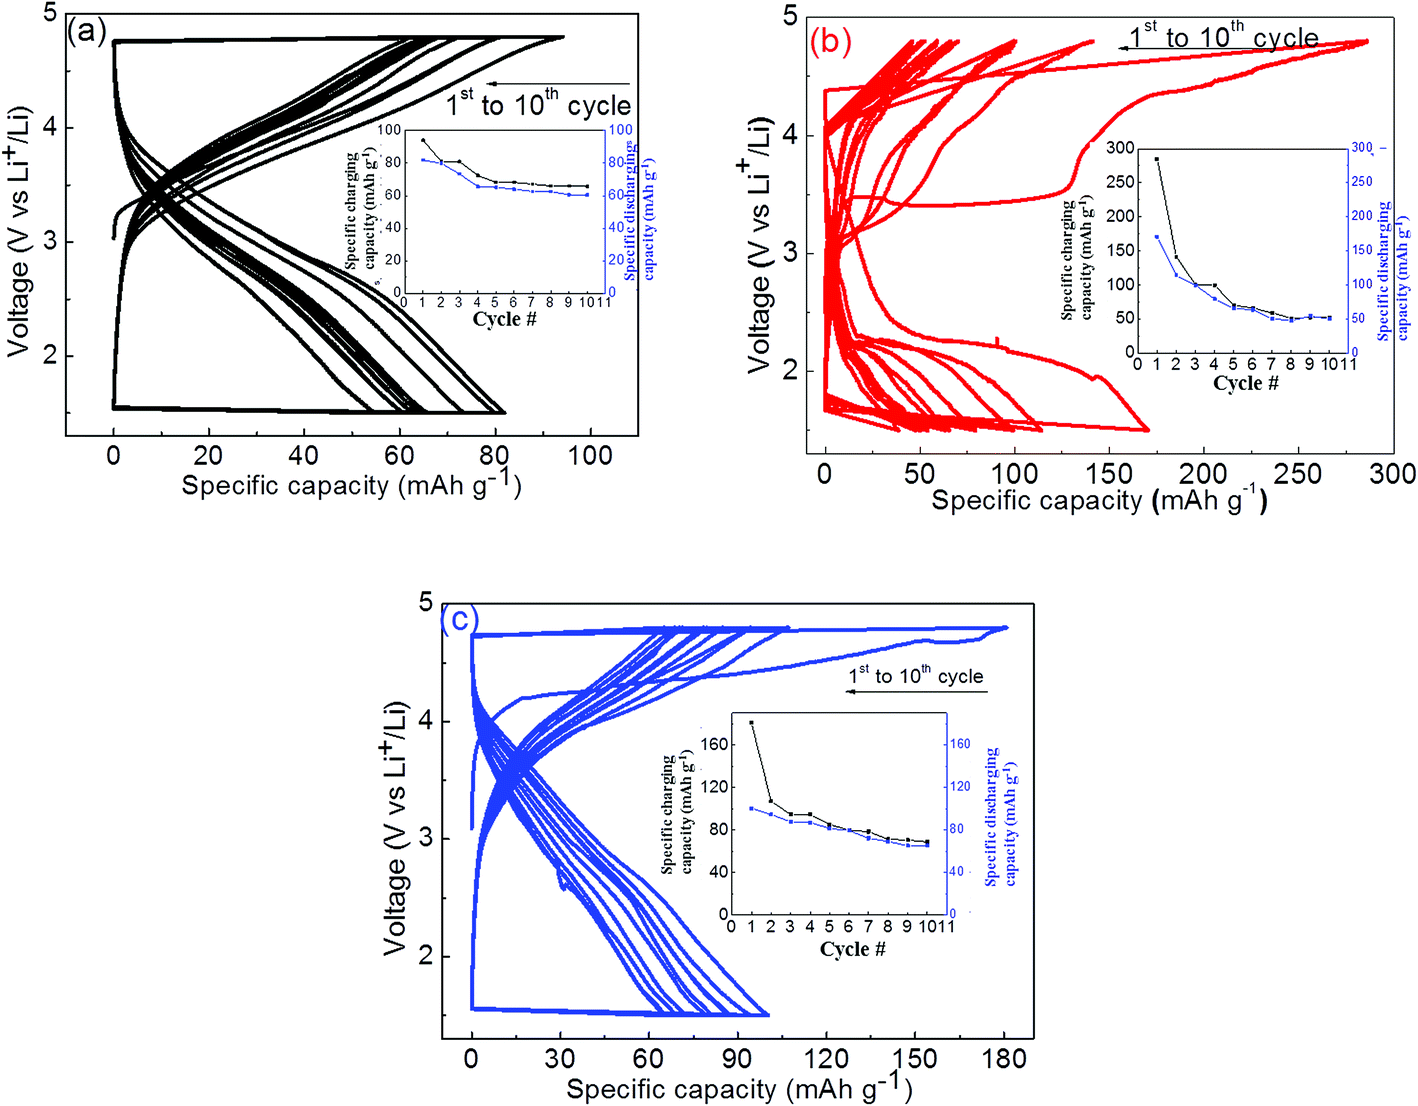 | ||
| Fig. 7 Charge–discharge performance and respective capacity fading versus cycles (inset) for (a) solid state orthorhombic (Pmn21), (b) sol–gel derived orthorhombic (Pmn21), and (c) sol–gel derived monoclinic (P21/n) LMS based cathode electrodes. | ||
The observed relatively large charge/discharge capacity for sol–gel derived electrode materials as compared to that of solid state electrode can be attributed to the smaller particle size and shell like carbonic coating on LMS materials during synthesis. This has also been confirmed from SEM micrographs and FTIR analysis. This resulted into enhanced electronic conductivity and thus electrochemical capacities. In addition to the enhanced electronic conductivity, relatively porous like electrode material may also assist in enhanced Li+ intercalation/deintercalation for the sol–gel derived materials. In spite of good electrical and ionic conductivity, both sol–gel derived (orthorhombic and monoclinic) LMS materials have shown drastic capacity fading even in ten charge/discharge cycles. The observed degradation in capacity with charge/discharge cycles is still under investigation and is a very serious concern in these electrode materials. The fading of electrochemical performance has been claimed to be due to the amorphization of crystalline LMS materials during charge/discharge cycles.14 In addition, the observation of Jahn–Teller active Mn in these LMS may be also be responsible for the observed capacity fading. Manganese is in 2+ state in the pristine fully lithiated LMS, which undergoes to mixed 2+ and 4+ valence states in partially lithium LMS during electrochemical cycling and thus leading to the Jahn–Teller distorted Mn sites. The reversibility of these Jahn–Teller distorted LMS materials may be not easily possible and causing the observed strong capacity fading within few electrochemical cycles. Thus, structural protection of nanostructured LMS material may assist to realize the enhanced electrochemical performance and avoid electrochemical capacity fading.
Conclusion
The process is identified for synthesis of phase pure orthorhombic and monoclinic Li2MnSiO4 using sol–gel and solid state reaction method. The effective carbon coating was achieved in sol–gel synthesis nanostructured Li2MnSiO4 resulted in better electrochemical performance. The optical measurements suggest the possible mixed Mn valence, which may cause Jahn–Teller distortion in LMS cathode materials, and finally leading to the observed strong capacity fading. In addition, the lower electrochemical capacity as compared to the theoretical expectation giving room for further improvement by stoichiometric Li presence in Li2MnSiO4. Further, theoretical and experimental studies needed to substantiate the findings and materials modification is vital to retain the initial observed high charge/discharge capacity.Acknowledgements
Author Ambesh Dixit greatly acknowledges the Department of Science & Technology (DST), Government of India, grant # INT/RUS/RFBR/P-190 and the Ministry of New & Renewable Energy (MNRE), Government of India, grant # 15/40/2010-11/ST. Authors Aleksandr Ivanishchev and Alexei Churikov acknowledge the Russian Science Foundation (project #15-13-10006) for the financial support of the part of research concerning cyclic voltammetry and galvanostatic measurements and analysis of electrochemical data.References
- L. Lu, X. Han, J. Li, J. Hua and M. Ouyang, J. Power Sources, 2013, 226, 272–288 CrossRef CAS.
- E. Vinodkumar, R. Marom, R. Elazari, G. Salitra and D. Aurbach, Energy Environ. Sci., 2011, 4, 3243–3262 Search PubMed.
- J. R. Dahn and E. W. Fulle, Solid State Ionics, 1994, 69, 265–270 CrossRef CAS.
- Y. X. Li, Z. L. Gong and Y. Yang, J. Power Sources, 2007, 174, 528–532 CrossRef CAS.
- B. Scrosati and J. Garche, J. Power Sources, 2010, 195, 2419–2430 CrossRef CAS.
- S. Devaraj, M. Kuezma, C. Ng and P. Balaya, Electrochim. Acta, 2013, 102, 290–298 CrossRef CAS.
- H. Zhu, H. He, X. Xin, X. Ma, L. Zan and Y. Zhang, Electrochim. Acta, 2015, 155, 116–124 CrossRef CAS.
- I. Belharouak, A. Abouimrane and K. Amine, J. Phys. Chem. C, 2009, 113, 20733–20737 CAS.
- R. J. Gummow, N. Sharma, V. K. Peterson and Y. He, J. Solid State Chem., 2012, 188, 32–37 CrossRef CAS.
- V. V. Politaev, A. A. Petrenko, V. B. Nalbandyan, B. S. Medvedev and E. S. Shvetsova, J. Solid State Chem., 2007, 180, 1045–1050 CrossRef CAS.
- P. Ghosh, S. Mahanty and R. N. Basu, J. Electrochem. Soc., 2009, 156, A677 CrossRef CAS.
- M. S. Islam, R. Dominko, C. Masquelier, C. Sirisopanaporn, A. R. Armstrong and P. G. Bruce, J. Mater. Chem., 2011, 21, 9811–9818 RSC.
- T. Muraliganth, K. R. Stroukoff and A. Manthiram, Chem. Mater., 2010, 22, 5754–5761 CrossRef CAS.
- H. Lee, S. D. Park, J. Moon, H. Lee, K. Cho, M. Cho and S. Y. Kim, Chem. Mater., 2014, 26, 3896–3899 CrossRef CAS.
- J. Shim, S. Won, G. Par and H. Sun, Adv. Mater. Phys. Chem., 2012, 2, 185–188 CrossRef.
- Z. Peng, H. Miao, H. Yin, C. Xu and W. G. Wang, Int. J. Electrochem. Sci., 2013, 8, 903–913 CAS.
- S. Liu, J. Xu, D. Li, Y. Hu, X. Liu and K. Xie, J. Power Sources, 2013, 232, 258–263 CrossRef CAS.
- R. Dominko, M. Bele, M. Gaberšček, A. Meden, M. Remškar and J. Jamnik, Electrochem. Commun., 2006, 8, 217–222 CrossRef CAS.
- D. M. Kempaiah, D. Rangappa and I. Honma, Chem. Commun., 2012, 48, 2698 RSC.
- Y. Zhao, C. Wu, J. Li and L. Guan, J. Mater. Chem. A, 2013, 1, 3856 CAS.
- A. Vanchiappan, K. Karthikeyan, K. Kang, W. S. Yoon, W. S. Kim and Y. S. Lee, J. Mater. Chem., 2011, 21, 2470 RSC.
- K. Karthikeyan, V. Aravindan, S. B. Lee, I. C. Jang, H. H. Lim, G. J. Park and Y. S. Lee, J. Power Sources, 2010, 195, 3761–3764 CrossRef CAS.
- K. Gao, C. S. Dai, J. Lv and S. D. Li, J. Power Sources, 2012, 211, 97–102 CrossRef CAS.
- C. Deng, S. Zhang, Y. Gao, B. Wu, L. Ma, Y. H. Sun, B. L. Fu, Q. Wu and F. L. Liu, Electrochim. Acta, 2011, 56, 7327–7333 CrossRef CAS.
- Y. Hong, Z. Ying and C. Xuan, J. Electrochem., 2013, 19, 565–570 Search PubMed.
- J. A. Jan, M. Jimnez, E. Flores, A. Muoz, J. A. Tabares and G. A. Prez Alczar, Hyperfine Interact., 2015, 232, 127–140 CrossRef.
- M. E. A. Dompablo, R. Dominko, J. M. Gallardo-Amores, L. Dupont, G. Mali, H. Ehrenberg, J. Jamnki and E. Moran, Chem. Mater., 2008, 6, 5574–5584 CrossRef.
- G. Zhong, Y. Li, P. Yan, Z. Liu, M. Xie and H. Lin, J. Phys. Chem. C, 2010, 114, 3693–3700 CAS.
- N. Kuganathan and M. S. Islam, Chem. Mater., 2009, 21, 5196–5202 CrossRef CAS.
- R. Dominko, J. Power Sources, 2008, 184, 462–468 CrossRef CAS.
- C. Deng, S. Zhang, B. L. Fu, S. Y. Yang and L. Ma, Mater. Chem. Phys., 2010, 120, 14–17 CrossRef CAS.
- L. Wengang, X. Yunhua and Y. Rong, Rare Met., 2010, 29, 511–514 CrossRef.
- C. Deng, Y. H. Sun, S. Zhang, H. M. Lin, Y. Gao, B. Wu, L. Ma, Y. Shang and G. Dong, Int. J. Electrochem. Sci., 2012, 7, 4559–4566 CAS.
- T. Wu, C. Lai and Q. Xu, Mater. Lett., 2017, 186, 293–297 CrossRef CAS.
- F. Wanga, Y. Wanga, D. Suna, L. Wanga, J. Yang and H. Ji, Electrochim. Acta, 2014, 119, 131–137 CrossRef.
- L. Qu, S. Fang, L. Yang and S. Hirano, J. Power Sources, 2014, 252, 169–175 CrossRef CAS.
- S. Fleischmann, M. Mancini, P. Axmann, U. Golla-Schindler, U. Kaiser and M. Wohlfahrt-Mehrens, ChemSusChem, 2016, 9, 1–13 CrossRef PubMed.
- M. Swietslawski, M. Molenda, M. M. Zaitz and R. Dziembaj, ECS Trans., 2012, 41, 129–137 Search PubMed.
- A. Bhaskar, M. Deepa, T. N. Rao and U. V. Varadaraju, J. Electrochem. Soc., 2012, 159, A1954–A1960 CrossRef CAS.
- M. K. Devaraju, T. Tomai, A. Unemoto and I. Honma, RSC Adv., 2013, 3, 608–615 RSC.
- J. Yang, X. Kang, D. He, A. Zheng, M. Pan and S. Mu, J. Mater. Chem. A, 2015, 3, 16567–16573 CAS.
- J. Yang, X. Kang, L. Hu, X. Gong and S. Mu, J. Mater. Chem. A, 2014, 2, 6870–6878 CAS.
- J. Yang, L. Hu, J. Zheng, D. He, L. Tian, S. Mu and F. Pan, J. Mater. Chem, A, 2015, 3, 9601–9608 CAS.
- M. Xie, R. Luo, R. Chen, F. Wu, T. Zhao, Q. Wang and L. Li, ACS Appl. Mater. Interfaces, 2015, 7, 10779–10784 CAS.
| This journal is © The Royal Society of Chemistry 2017 |