
 Open Access Article
 This Open Access Article is licensed under a
 Creative Commons Attribution 3.0 Unported Licence
Effects of surface fluoride-functionalizing of glass fiber on the properties of PTFE/glass fiber microwave composites
Zhenhua Li a,
Jingsong Liu*a,
Ying Yuanb,
Enzhu Lib and
Fu Wanga
a,
Jingsong Liu*a,
Ying Yuanb,
Enzhu Lib and
Fu Wanga
aSchool of Material Science and Engineering, Southwest University of Science and Technology, Mianyang 621010, China. E-mail: liujingsong@swust.edu.cn; Tel: +86-08162419201
bThe State Key Laboratory of Electronic Thin Films and Integrated Devices, University of Electronic Science and Technology of China, Chengdu 610054, China
First published on 26th April 2017
Abstract
In this work, fluoride-functionalized glass fiber (F-GF) was prepared, in which glass fiber (GF) was modified with γ-methacryloxy propyltrimethoxy silane (γ-MPS), and then reacted with 2,2,2-trifluoroethyl methacrylate (TFEMA). Subsequently, PTFE/glass fiber microwave composites were prepared by incorporating 5 wt% of the GF, γ-MPS modified GF (M-GF) or F-GF into PTFE. The effect of F-GF on the mechanical and dielectric properties, as well as moisture absorption and coefficient of thermal expansion of the composites were investigated. The results show that fluorine is successfully grafted onto the surface of GF through –CF3 group, and F-GF forms a dense and compact interfacial structure with PTFE. The mechanical properties of PTFE/F-GF, including tensile strength (38.53 MPa) and elongation (226.82%), are obviously higher than those of PTFE/M-GF (34.73 MPa and 179.50%, respectively) and PTFE/GF (34.82 MPa and 174.33%, respectively). In addition, the PTFE/F-GF composite shows improved density (2.174 g cm−3), dielectric constant (2.18), and decreased dielectric loss (0.0009), moisture absorption (0.008%) and temperature coefficient of dielectric constant (−18.6 ppm per °C). The conclusions demonstrate that the method of surface fluorination of glass fibers offers promising application in PTFE based microwave materials.
1. Introduction
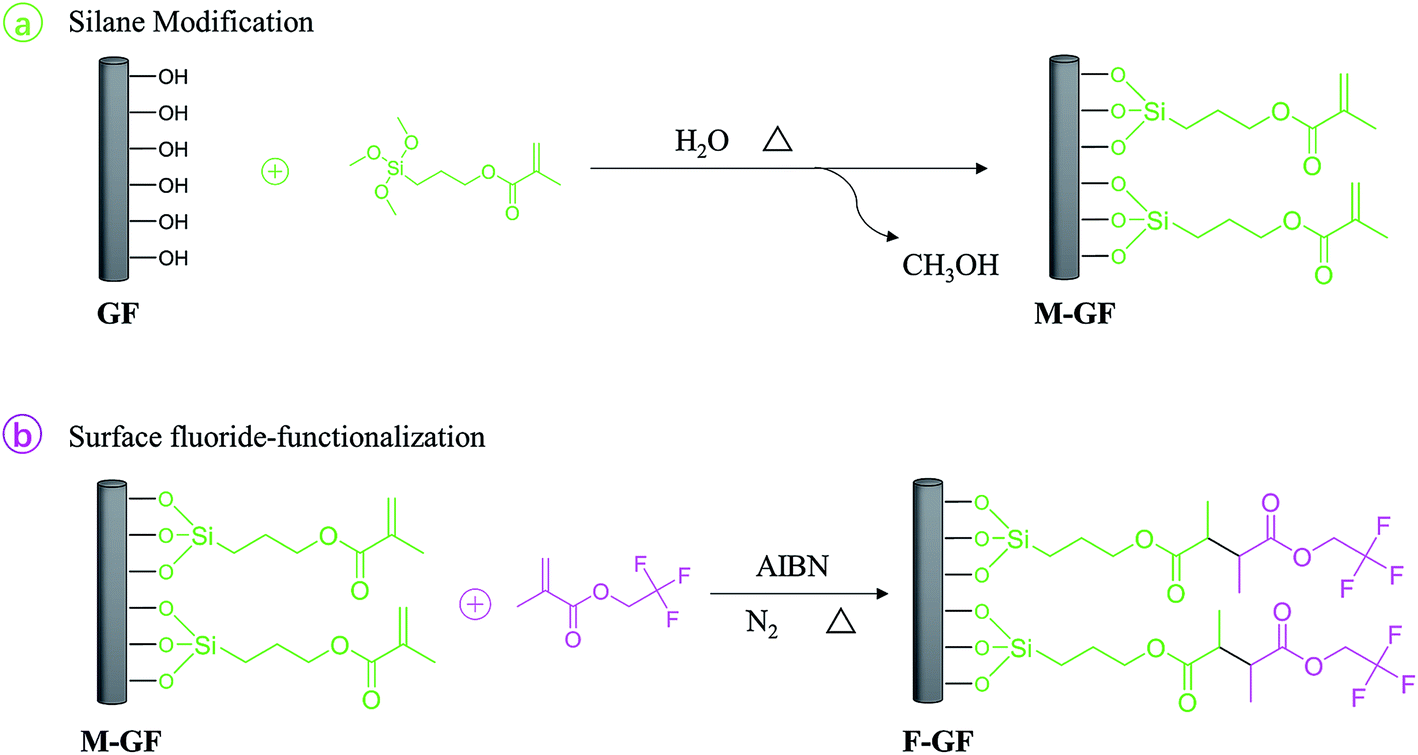
Polytetrafluoroethylene (PTFE) has been widely used in high-frequency microwave substrate products for its unique properties such as stable dielectric constant, low loss tangent, and good chemical resistance. But the disadvantages such as low mechanical strength and high liner coefficient of thermal expansion (CTE) limit its application.1 Therefore, PTFE-based substrate materials are commonly fabricated by filling with ceramic powders and glass fabric.2–6 Silica/E-glass fiber reinforced PTFE composites are often used in high speed digital printed circuit boards because of their low dielectric constant since the speed of the signal passing through the substrate is inversely proportional to the square root of the dielectric constant.7–10 Compared with E-glass fiber reinforced PTFE composites, the incorporate of silica in PTFE usually obtain a decreased tensile strength as well as elongation. It has been reported that short E-glass fiber was incorporated into PTFE/silica composites to enhance mechanical properties and to control surface texture.11,12Generally, silica and glass fiber (GF) are hydrophilic in nature, so that the incorporation of those untreated fillers in PTFE matrix leads to high porosity and moisture absorption. As a result, undesirable dielectric and mechanical properties of the composites are obtained. Hence, surface treatment of fillers is necessary. It has been proved that organic functional coupling agents, especially silane coupling agents, can improve properties of PTFE/silica composites.13,14 Chen et al.15 have reported the effects of phenyltrimethoxysilane coupling agent on the dielectric, thermal, mechanical properties and microstructure of PTFE/SiO2 composites. Murali et al.11 have used the same coupling agent in E-glass fiber reinforced PTFE/SiO2 composites, and the effect of particle size on the properties of the composites has been studied. Yuan et al.16 have studied the effects of phenyltrimethoxysilane and aminopropyltriethoxysilane compound coupling agents on the surface energy of SiO2 and the properties of PTFE/SiO2 composites. It has been found that the reduction in void content and the decrease in hydrophilicity of fillers result in improved performance. Arthur et al.17,18 have found that the use of fluoroalkysilanes in PTFE/silica-GF composites offer an even higher level of performance, including improved electrical performance, surface mount reliability, peel strength, compliance, ductility, lower CTE and water absorption. Typically, such improvements are attributed to the improvement of the dispersion of silica or GF in the composites and the enhancement of bonding between the PTFE and the modified fillers. The enhancement of bonding is provided by the good affinity of PTFE with fluoride-functionalizing surface of the modified fillers.19 However, because of the very-high cost of fluoroalkysilanes, a blending of fluoroalkysilanes with other thermally stable silanes which contains no fluorine atoms in their chemical structure (e.g. a blending of 3,3,3-trifluoropropyltrimethoxysilane with phenyltrimethoxysilane) is used as alternative plan.17 Unfortunately, little information about fluorinated fillers reinforced PTFE microwave materials is available. Consequently, an economical and effective way to modify fluoride onto the surface of fillers is required.
In the present study, microwave substrate composites were prepared using PTFE powder and short E-glass fiber as raw material. What's more, a novel two-step fluorine-graft method was adopted to prepare fluoride-functionalized glass fiber (F-GF). The two-step method consists of: (a) the formation of a stable silane layer through the reaction of γ-methacryloxy propyltrimethoxy silane (γ-MPS) with the hydroxyl groups on the surface of the GF; (b) the fluoride-functionalization of the 2,2,2-trifluoroethyl methacrylate (TFEMA) layer through radical polymerization with unsaturated γ-MPS layer (Scheme 1). PTFE/F-GF composites were prepared using F-GF as reinforced material. Moreover, PTFE/M-GF and PTFE/GF composites are also prepared using γ-MPS modified GF (M-GF) and non-modified modified GF respectively as reinforced material for comparison. The preparation and characterization of F-GF, and the effect of surface fluorination on the mechanical, moisture absorption, thermal, and microwave dielectric properties of the composites are studied and discussed in detail.
 | ||
| Scheme 1 The strategy for the surface fluorination of glass fiber. | ||
2. Experimental
2.1 Chemicals
The short E-glass fiber was provided by the University of Electronic Science and Technology of China. PTFE micro-powders (MP1000, AR) were supplied by DuPont Co. (USA). The properties of raw GF and PTFE are shown in Table 1. Other materials including xylene, toluene, ethyl acetate, 2,2-azobisisobutyronitrile (AIBN, ≥99.0%), γ-MPS (Kelong Chemical Industry, China) and TFEMA (Aladdin Chemistry 98%, including 100 ppm of MEHQ as a stabilizer) were also used. AIBN was recrystallized from methanol before using.| Properties | PTFE | GF |
|---|---|---|
| Tensile strength (MPa) | 22–35 | — |
| Elongation (%) | ∼300% | — |
| Density (g cm−3) | 2.15 | 2.76 |
| Dielectric constant | 2.1 | 6.13 |
| Dielectric loss | 0.0007 | 0.0039 |
| Coefficient of thermal expansion (ppm per °C) | 128 | 5.4 |
2.2 Preparation of surface fluorinated glass fiber
The surface fluorination of GF involves two steps: the preparation of γ-MPS modified GF and the graft of fluorine-containing monomers. The first step: the GF was heated at 400 °C for 30 min to remove impurities from the surface. Then, 1 g of GF and 200 mL of toluene were added into a three-necked round bottom flask with a mechanical stir bar and a reflux condenser. After the GF was completely dispersed in toluene, γ-MPS was added. The mixture was refluxed at 90 °C and stirred under a stream of argon for 20 h. Subsequently, the reaction mixture was cooled to room temperature and washed with 250 mL toluene in a Soxhlet extractor for 24 h to remove unreacted γ-MPS, and then the residual toluene was removed by washing with ethanol. The M-GF was obtained after dying at reduced pressure.The second step: 1 g of the γ-MPS modified GF was suspended in xylene/ethyl acetate (with a volume ratio of 1![[thin space (1/6-em)]](https://www.rsc.org/images/entities/char_2009.gif) :1) solution. The obtained mixture and a half of the initiator (AIBN, 0.05 g) were added to a four-necked round bottom flask with a constant pressure funnel, refluxed at 80 °C and purged with argon for 30 min. Subsequently, TFEMA (the molar ratio of TFEMA and γ-MPS on M-GF was 1.1:1) and another half of the initiator (0.05 g) were added in the constant pressure funnel and dripped off within 3 h. After 4 h of insulation, the product was filtered, washed and dried. Finally, F-GF was obtained.
:1) solution. The obtained mixture and a half of the initiator (AIBN, 0.05 g) were added to a four-necked round bottom flask with a constant pressure funnel, refluxed at 80 °C and purged with argon for 30 min. Subsequently, TFEMA (the molar ratio of TFEMA and γ-MPS on M-GF was 1.1:1) and another half of the initiator (0.05 g) were added in the constant pressure funnel and dripped off within 3 h. After 4 h of insulation, the product was filtered, washed and dried. Finally, F-GF was obtained.
2.3 Preparation of PTFE/GF composites
The PTFE powder and GF (95 wt% of PTFE and 5 wt% of GF) were thoroughly mixed for 3 h with simultaneous stirring and ultrasonic dispersing using alcohol as dispersant. Then filtered and heated at 50 °C to remove the dispersant, the fully mixed PTFE/GF power was obtained. Subsequently, a static pressure of 45 MPa was used to press the mixed powder for 5 minutes into boards, and then it was heated in a muffle furnace from room temperature to 360 °C with a heating rate of 1 °C min−1 and kept at 360 °C for 2 h. Finally, the PTFE/GF board (35 × 80 × 1 mm3) was obtained. The PTFE, PTFE/M-GF and PTFE/F-GF board were prepared using the same method.2.4 Measurements
Fourier transform infrared spectra (FTIR) of pristine and modified GF were performed on a Nicolet FTIR 5700 spectrophotometer. KBr pellets containing ca. 2 wt% of GF were analyzed. The FTIR of modifiers viz. γ-MPS and TFEMA were also studied for comparison. Thermogravimetric (TG) analysis of 10–25 mg of modified or non-modified GF was performed in flowing argon at a ramp rate of 10 °C min−1 from room temperature to 650 °C.The morphology of fiber samples and tensile fracture surfaces was obtained by a Scanning Electron Microscopy (SEM, UItra55, Germany). Mechanical properties were measured using Dynamic Mechanical Analysis (DMA) on a Q800 (TA Instruments) working in the tensile mode. The sample dimensions were cut according to the standard of ASTM D638 (Type V).
The density of the composites was recorded according to Archimedean principle using an electronic density meter. Moisture absorption of the composites was carried out as per ASTM-D570 standard. The dielectric constant, dielectric loss and the temperature coefficient of dielectric constant were measured using a Vector Network Analyzer based on the method of stripline resonator according to IPC-TM-650 2.5.5.5. The dielectric properties of the composites reported in this study were the value at the frequency around 10 GHz. The liner coefficient of thermal expansion (CTE) of the composites were measured using DIL402PC (Netzsch) with a heating rate of 5 °C min−1 from 20 to 120 °C according to IPC-TM-650 2.4.41.1 specification.
3. Results and discussion
3.1 Surface fluorination of GF
Fig. 1 shows FTIR spectra of coupling agents and modified glass fibers. The absorption band at ca. 1720 cm−1 is assigned to the stretching vibration of C![[double bond, length as m-dash]](https://www.rsc.org/images/entities/char_e001.gif) O bonds.20 The spectrum also reveals the characteristic adsorption bands of O–CH2 and C–O–C at 1320 and 1296 cm−1 respectively.21,22 Moreover, the weak absorption bands at ca. 2900 cm−1 is ascribed to the stretching vibration C–H bonds which produce from organic coating. From Fig. 1(c), the FTIR spectrum shows the presence of γ-MPS on M-GF. The wide peak at ca. 3450 cm−1 is mainly due to the physically adsorbed water during the test.
O bonds.20 The spectrum also reveals the characteristic adsorption bands of O–CH2 and C–O–C at 1320 and 1296 cm−1 respectively.21,22 Moreover, the weak absorption bands at ca. 2900 cm−1 is ascribed to the stretching vibration C–H bonds which produce from organic coating. From Fig. 1(c), the FTIR spectrum shows the presence of γ-MPS on M-GF. The wide peak at ca. 3450 cm−1 is mainly due to the physically adsorbed water during the test.
 | ||
| Fig. 1 FTIR spectra of (a) γ-MPS, (b) TFEMA, (c) M-GF, (d) F-GF and (e) GF. | ||
The absorption band at ca. 1720 cm−1 which is assigned to the stretching vibration of CO bands is also observed for F-GF sample (Fig. 1(d)). In addition, the adsorption peak at 638 cm−1 which corresponds to the asymmetric deformation vibration of –CF3 group is observed in Fig. 1(d), suggesting that F-GF is obtained.22,23 It should be noted that the stretching vibration of –CF3 group located in the range of 1120–1350 cm−1 (Fig. 1(b)) is not observed in the FTIR spectrum of F-GF. That is because this adsorption peak is covered by the very strong and wide adsorption peak caused by Si–O–Si bands in GF.24
Fig. 2 shows the TG curves of GF, M-GF and F-GF. The two-step fluorination of GF is further confirmed from the figure, because the mass loss of F-GF significantly surpasses that of M-GF. It can be deduced in Fig. 2 that the amounts of graft material γ-MPS and TFEMA are around 11.9 wt% and 6.7 wt%, respectively. According to this, the molar ratio of γ-MPS and TFEMA is calculated to be 1:0.83 which is not the same as the predetermined ratio (1:1). Deficiency of TFEMA in the secondary grafting process is caused by the self-condensation reaction of γ-MPS (Scheme 2), which result in a decreased amount of γ-MPS grafted because the water molecules lost during this reaction.
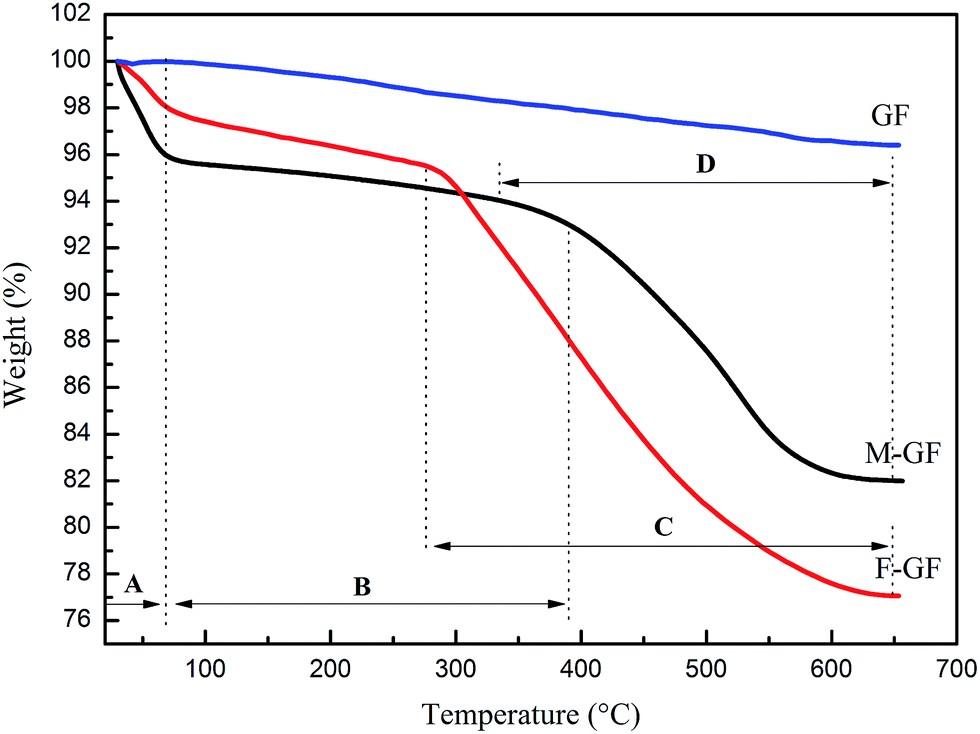 | ||
| Fig. 2 TG curves of GF, M-GF and F-GF. (A) Residual solvent desorption; (B) physisorbed water desorption; (C & D) modifier loss.20 | ||
 | ||
| Scheme 2 The schematic of the self-condensation reaction of silane coupling agent. | ||
3.2 Morphology of GF and the cross section of composites
The properties of fiber reinforced polymer composites depend not only on the individual properties of fiber and polymer, but also on other factors such as the morphology, size, content, distribution of filler and the interfacial connection between fiber and matrix. Hence SEM is employed to investigate the morphology, size, and distribution of GF. It can be observed in Fig. 3(a) that the non-modified GF is seriously agglomerated (especially the small fibers), because the hydrophilic surface makes GF easy to agglomerate through hydrogen bond. Fig. 3(b) shows that F-GF fibers become less agglomerate and better dispersed. The fiber length distribution analysis of GF is performed by measuring about 800 fibers based on the SEM images.25 As shown in Fig. 3(c), approximately 85% of GF have length smaller than 50 μm, and a small percentage (<5%) of GF have length longer than 100 μm. The average length of GF is calculated to be 22.5 μm.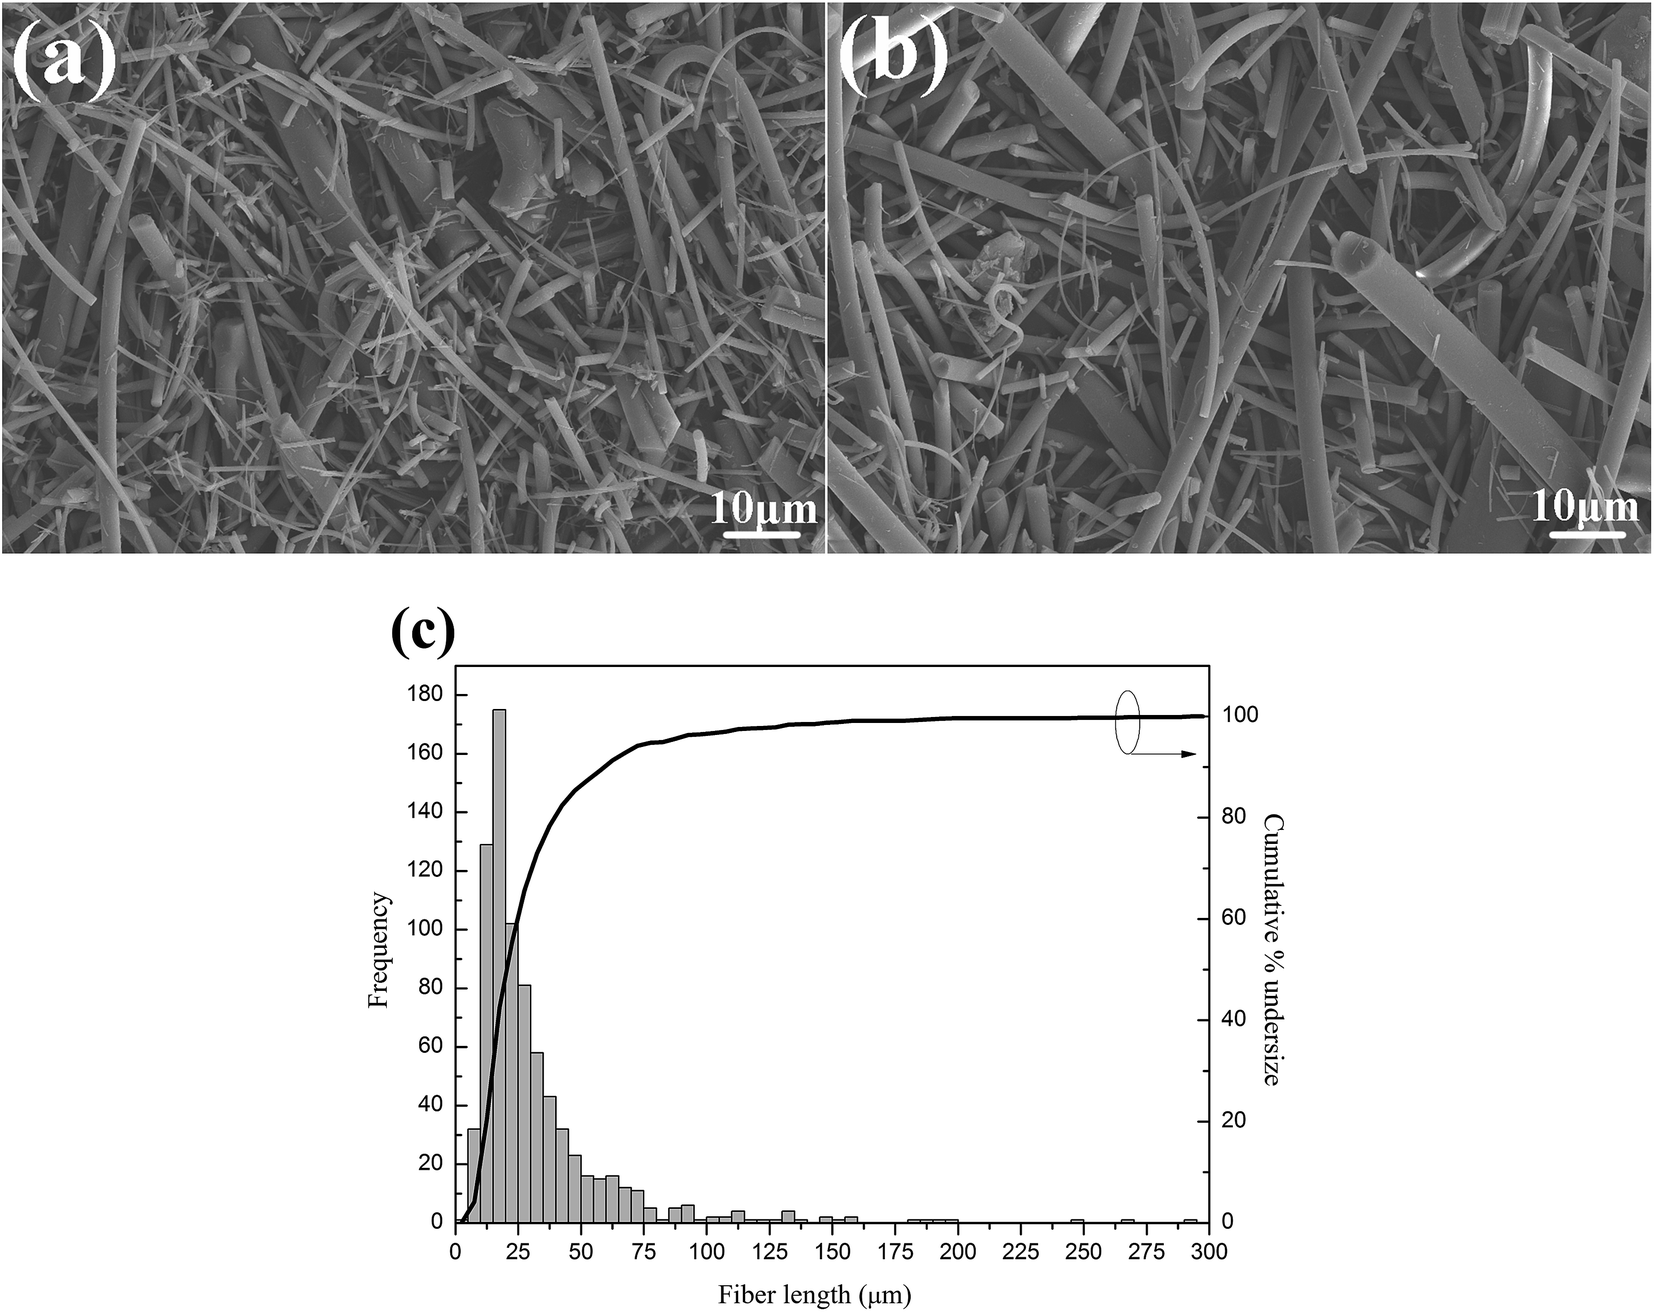 | ||
| Fig. 3 SEM images of (a) GF and (b) F-GF, and (c) fiber length distribution of GF. | ||
Cross sectional morphologies of mechanical tensile fracture surface of the composites are shown in Fig. 4. It can be seen that all the GF are well distributed in the PTFE matrix. The cross sectional morphologies of PTFE/M-GF and PTFE/F-GF show a rough fracture surface and an apparent deformation morphology compared with PTFE/GF (Fig. 4(a)–(c)), which indicates better interfacial connection formed for M-GF and F-GF with PTFE matrix.26,27 It is obvious from Fig. 4(d)–(f) that fluorination of GF decreases the gap between GF and PTFE in composites and the gap between F-GF and PTFE disappears. Fig. 4(d) shows that PTFE could be easily peeled from unmodified GF when mechanical tensile fracture of PTFE/GF composite happens. Meanwhile, PTFE is tightly coated onto the surface of F-GF. The two materials show a compact interfacial microstructure on the fracture surface when mechanical tensile fracture happens. The dense interfacial structure and strong connection between PTFE and F-GF is ascribed to the good compatibility of PTFE and fluorine-containing molecules on the surface of F-GF.
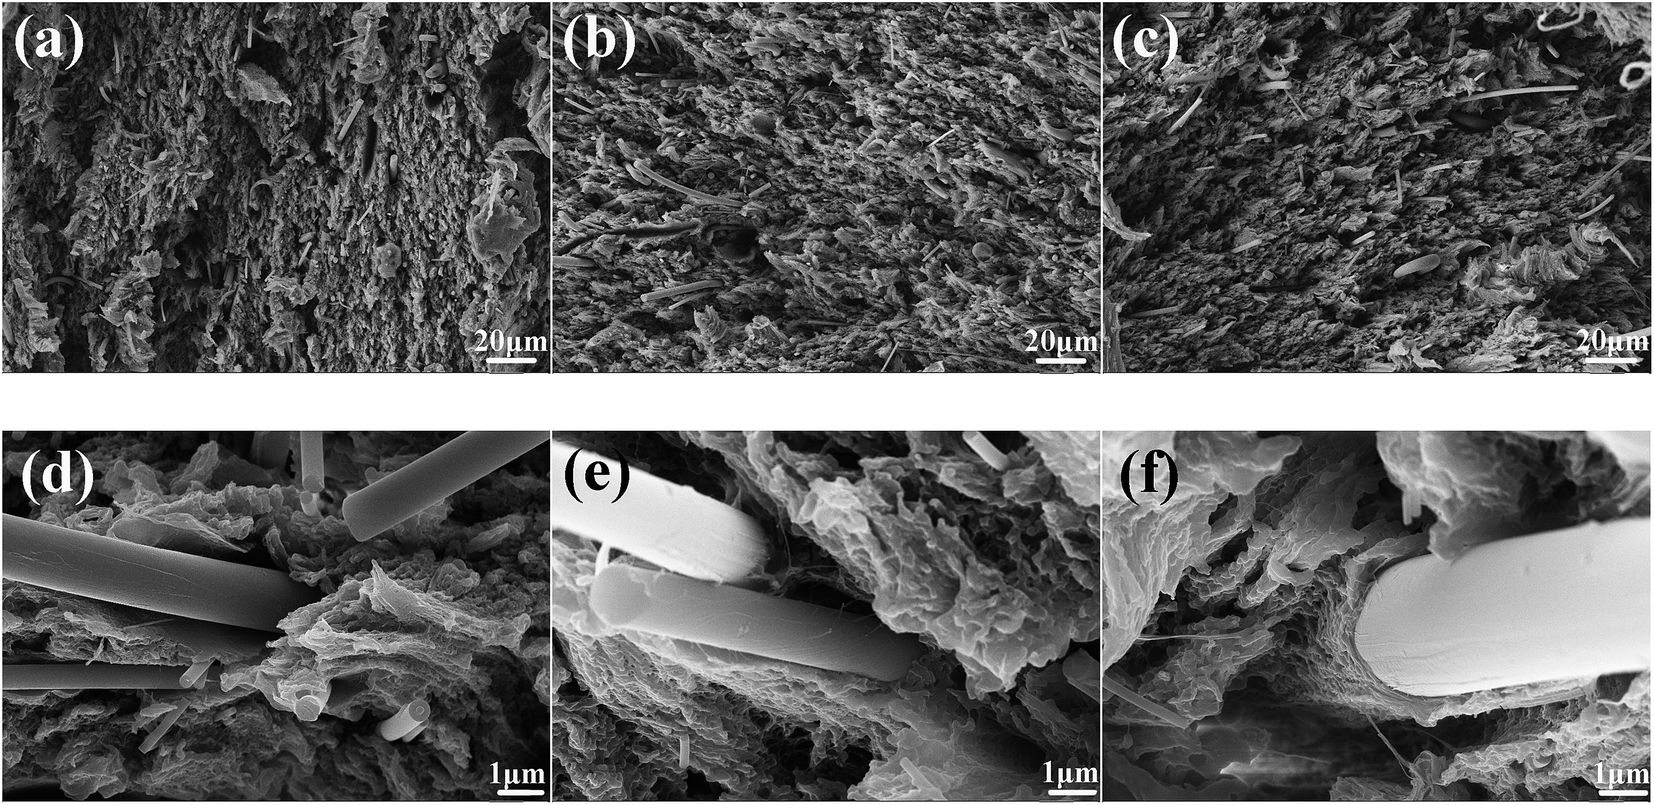 | ||
| Fig. 4 Cross sectional morphologies of (a) and (d) PTFE/GF, (b) and (e) PTFE/M-GF, (c) and (f) PTFE/F-GF. | ||
3.3 Mechanical properties
The tensile strength, elongation, density, moisture absorption, dielectric constant, dielectric loss, coefficient of thermal expansion (CTE), and coefficient of dielectric constant (τε) of the composites are summarized in Table 2. Mechanical properties of the composite provide the information of interfacial property and microstructure. Fig. 5 shows the tensile strength and elongation of the obtained samples. It is noted that pristine PTFE shows the lowest tensile strength (30.52 MPa) and the highest elongation (316.49%). The incorporation of GF increases the tensile strength of the composite material. The tensile strength of the composites enhances when the interfacial connections between GF and PTFE become stronger. PTFE/F-GF shows the highest tensile strength (38.53 MPa) which is 10% higher than that of PTFE/GF. In addition, a higher elongation is also obtained for PTFE/F-GF sample compared with that of PTFE/GF and PTFE/M-GF. The higher elongation (higher ductility and compliant) is particularly important to the surface mount reliability of substrates. Since the board and the electric package usually heat up at different rates, the close CTE-match is not enough. A substrate with higher ductility and compliant could minimize the stress on the solder joint which results from the different strain between the board and the package.| Samples | Tensile strength (MPa) | Elongation (%) | Density (g cm−3) | Moisture absorption (%) | Dielectric constant | Dielectric loss | τε (ppm per °C) | CTE (ppm per °C) |
|---|---|---|---|---|---|---|---|---|
| PTFE | 30.52 | 316.49 | 2.145 | 0.0054 | 2.08 | 0.0007 | −221.2 | 127.6 |
| PTFE/GF | 34.82 | 174.33 | 2.162 | 0.023 | 2.14 | 0.0016 | −127.1 | 105.2 |
| PTFE/M-GF | 34.73 | 179.50 | 2.171 | 0.012 | 2.15 | 0.0014 | −110.4 | 104.4 |
| PTFE/F-GF | 38.53 | 226.82 | 2.174 | 0.008 | 2.18 | 0.0009 | −18.6 | 95.7 |
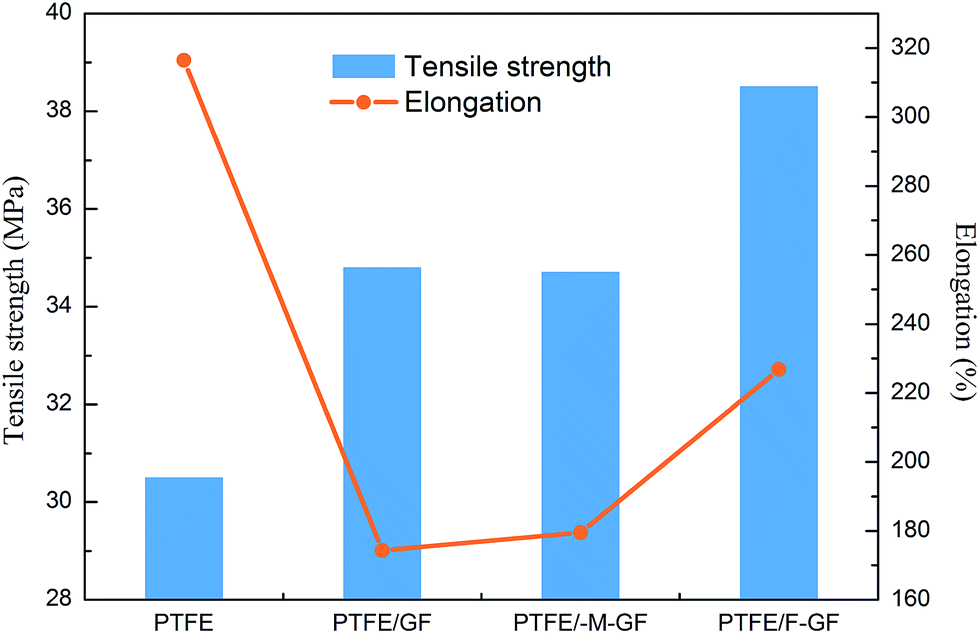 | ||
| Fig. 5 The tensile strength and elongation of PTFE, PTFE/GF, PTFE/M-GF and PTFE/F-GF. | ||
The improved tensile strength and elongation of PTFE/F-GF can be attributed to the strong interfacial interaction and dense interfacial structure. When the composite suffers stress, PTFE are capable to transmit stress to F-GF for the dense interfaces, thus an increased strength of the composite is obtained. According to the report of Zhang et al.,28 the softening and high strength of composites is also related to the fibrils structure formed during the tensile test (Fig. 6). In the case of PTFE/silica-GF composites, phenyltrimethoxysilane coupling agent was used and the decrease of tensile strength and elongation is ascribed to porosity, poor matrix-filler interface and the hydrophilic nature of filler.11 It is clear that the fluorination makes GF have good compatibility and interaction with PTFE.
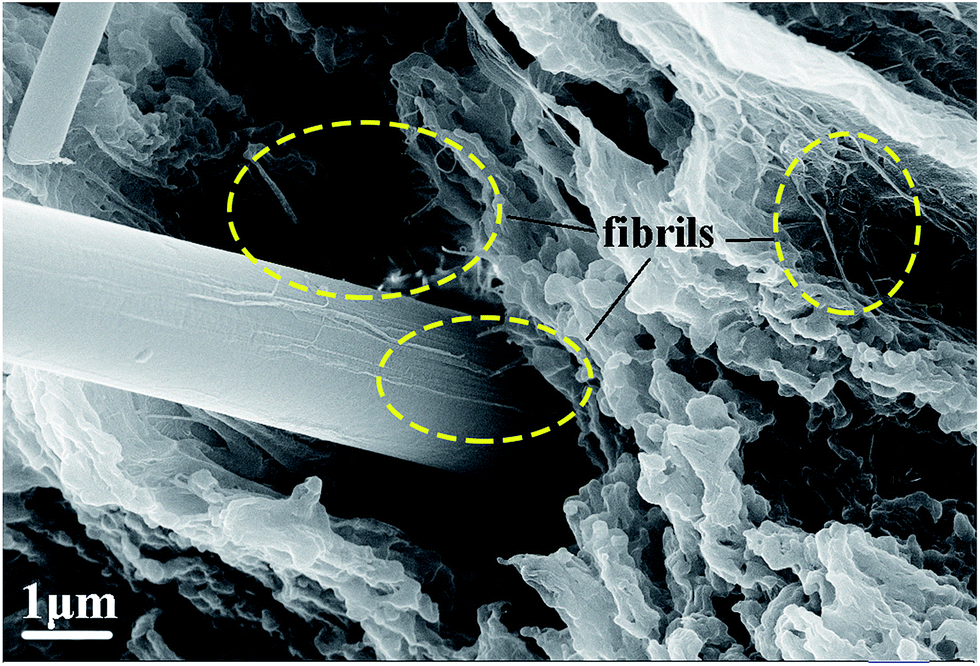 | ||
| Fig. 6 The fibrils structure in PTFE/F-GF after tensile fracture. | ||
3.4 Density and moisture absorption
The density and moisture absorption of the composite are important signals of porosity. Moreover, moisture absorption is an important parameter for microwave substrates. Since water has a much higher dielectric constant and dielectric loss than PTFE and GF, moisture absorption significantly influences the electrical properties of the composites. Fig. 7 shows the density and moisture absorption of the samples. It can be found from Fig. 7 that PTFE/F-GF composite exhibits much lower moisture absorption than PTFE/GF, and also lower than PTFE/M-GF. The low moisture absorption of PTFE/F-GF is possibly related to the dense interface structure (as confirmed in Fig. 4(f)) which resists the absorption and diffusion of water. Another explanation is that the fluorine monomers have a higher hydrophobicity than γ-MPS monomers. When GF was fluorinated, its hydrophilicity of surface is greatly reduced. The density of PTFE/F-GF is 2.174 g cm−3, which is close to the theoretical density (2.175 g cm−3) of the composite. For non-modified GF, the incompatibility between GF and hydrophobic PTFE can result in interfacial defects and debond, thus an increased porosity and decreased density is obtained for the sample which are the reason of its high moisture absorption.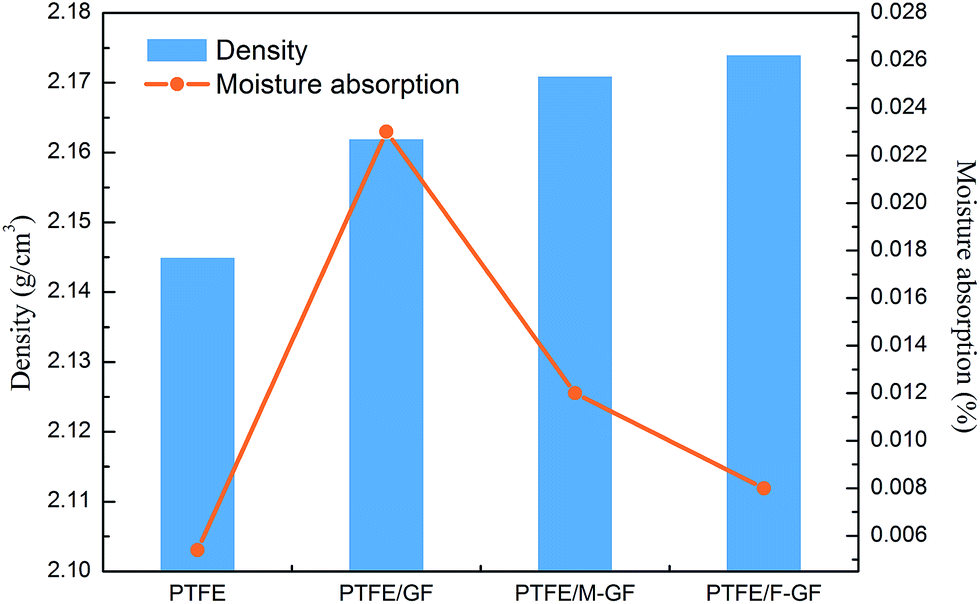 | ||
| Fig. 7 The density and moisture absorption of PTFE, PTFE/GF, PTFE/M-GF and PTFE/F-GF. | ||
3.5 Coefficient of thermal expansion and temperature coefficient of dielectric constant
The thermal expansion curve of PTFE and GF reinforced composites is shown in Fig. 8. It can be seen that the deformation of samples increases linearly with the increase of temperature, which means that the CTE of the samples is close to constant in the range of test temperature. PTFE/F-GF shows the lowest thermal expansion (0.957%). This result can be explained by dense interface and strong interfacial connection of PTFE/F-GF as discussed above. When the composite is heated, PTFE has higher expansion coefficient than the filler of GF. However, if the interfacial connection of the composite is strong enough, stresses will be transmitted, and the expansion of the composite will be reduced. Therefore, the lowest thermal expansion of PTFE/F-GF also is ascribed to the formation of strong interface between F-GF and PTFE. Since the copper has to be built on the surfaces of substrate for microcircuit fabrication, the substrate composites should have a matched CTE with cooper (∼18 ppm per °C), in order to avoid delamination of copper layer at a high operating temperature. It is reported that 60 wt% of silica filled PTFE composite has a comparable CTE with copper.7,11 In the present study, the CTE of 5 wt% of F-GF reinforced PTFE composites is calculated to be 95.7 ppm per °C, which equals about 10 wt% of silica filled PTFE composite,11 although E-glass fiber has a larger CTE (5.4 ppm per °C) than that of silica (0.5 ppm per °C). This result also can be ascribed to the compatibility and interfacial connections between PTFE and F-GF. Besides, this result may also indicate a low-load of F-GF to reach a comparable CTE with copper, which need further study.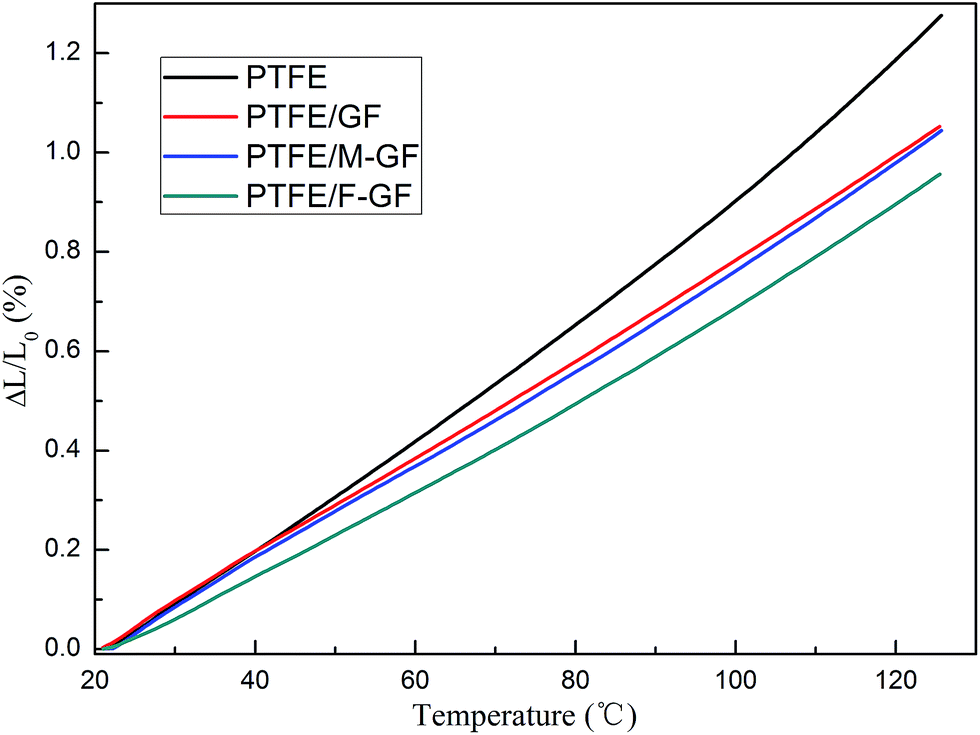 | ||
| Fig. 8 The thermal expansion curve of PTFE, PTFE/GF, PTFE/M-GF and PTFE/F-GF. | ||
The CTE is also an important factor that influences the temperature coefficient of dielectric constant (τε). The GF reinforced PTFE composites must exhibit stable dielectric properties at various temperature and frequency while using in microwave substrate. As is known, the τε of a composite is decided by filler, matrix and the CTE of the composite. In this work, GF and modified GF are added to PTFE in the same proportion, so the change of τε is mainly due to the variation of the composite's CTE. It is reported that the ion displacement polarization of fillers plays a dominant role in the change of τε for PTFE based composites.16 With the increase of temperature, the composites expand and the distance between fillers becomes larger, hence the ion displacement polarization is enhanced, which leads an increase of τε. As shown in Table 2, the composite having high CTE show a high value of τε. Moreover, the τε of PTFE/F-GF, −18.6 ppm per °C, is significantly lower than the other composites.
3.6 Dielectric constant and dielectric loss
The dielectric performance is the most important properties for substrate materials used in high frequency PCB and is determined by the properties of filler, matrix and the interfacial structure of composites. The dielectric constant and dielectric loss of the composites at ca. 10 GHz are showed in Fig. 9. Both dielectric constant and dielectric loss increase when GF and modified GF are incorporated into PTFE. Moreover, PTFE/GF and PTFE/M-GF have slightly lower dielectric constant and higher dielectric loss than PTFE/F-GF. As mentioned above, both GF and M-GF have weak interfacial connection with PTFE. As a result, when the composites suffer compression and sintering, defects such as pores will generate at the interface, and thus lower dielectric constant of the material obtained because the dielectric constant of pore is 1. Moreover, the defects also lead to additional polarization, so that high dielectric loss is observed. The high electric performance of PTFE/F-GF is closely related to the fluorine containing molecules that are grafted on the surface of F-GF. The fluorine containing molecules make F-GF have good affinity with PTFE, which leads to strong interfacial connection and dense interfacial structure of PTFE/F-GF composite. Therefore, few defects are generated at the interface of the PTFE/F-GF composite and improved electric performance is obtained.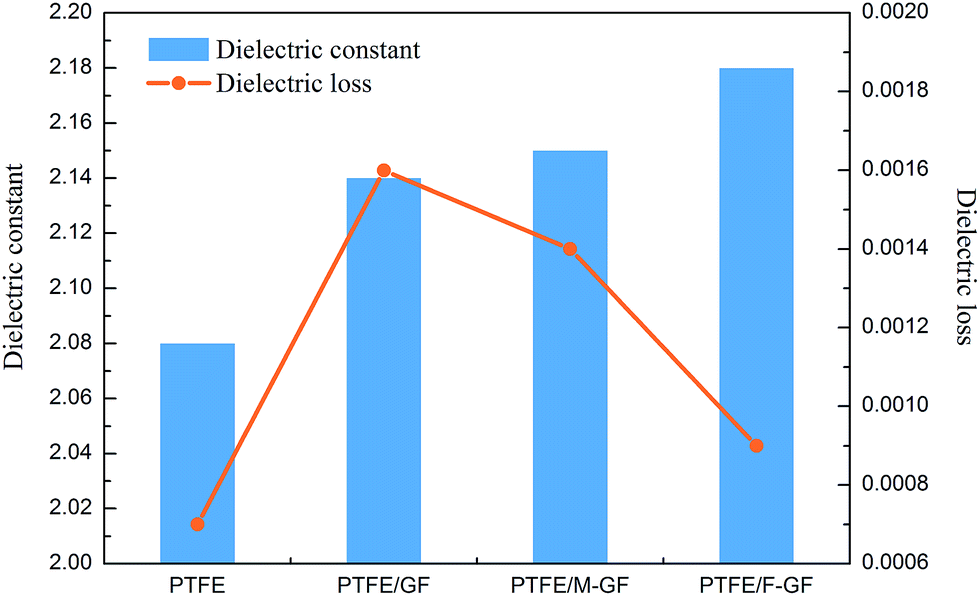 | ||
| Fig. 9 The dielectric constant and dielectric loss of PTFE, PTFE/GF, PTFE/M-GF and PTFE/F-GF. | ||
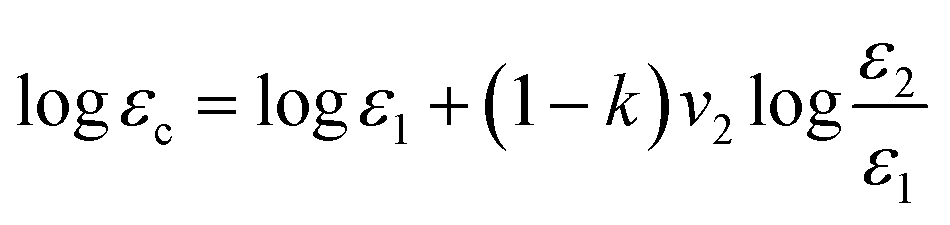
For GF reinforced PTFE composites, the modified Lichtenecker model is reported to show the best comparative correlation with experimental results.25 Thus, this model is used to predict the dielectric constant of GF reinforced PTFE composites.
4. Conclusions
The surface fluorination of GF consists of two steps: the modification with unsaturated γ-MPS and the grafting with TFEMA. The obtained F-GF was then incorporated into PTFE with a mass fraction of 5% to fabricate PTFE/F-GF composite. The surface fluorination of GF improves the properties of PTFE/F-GF composite. The obtained PTFE/F-GF composite has a dielectric constant of 2.18, dielectric loss of 0.0009, tensile strength of 38.53 MPa, elongation of 226.82%, moisture absorption of 0.008%, CTE of 95.7 ppm per °C and temperature coefficient of dielectric constant of −18.6 ppm per °C. The improved performance of the PTFE/F-GF composite is ascribed to the good compatibility between PTFE and F-GF. SEM micrograph of the cross section of the composites confirms a dense and compact interfacial structure formed between F-GF and PTFE. The fluoride-functionalization provides a promising method to modify the surface of GF or silica which are used in reinforced PTFE microwave substrates applications.Acknowledgements
We thank The State Key Laboratory of Electronic Thin Films and Integrated Devices at University of Electronic Science and Technology of China for providing raw materials and the testing of high frequency dielectric properties.References
- G. Subodh, M. Joseph, P. Mohanan and M. T. Sebastian, J. Am. Ceram. Soc., 2007, 90, 3507–3511 CrossRef CAS.
- A. Gu, G. Liang and L. Yuan, Polym. Adv. Technol., 2010, 20, 39–42 CrossRef.
- K. P. Murali, S. Rajesh, O. Prakash, A. R. Kulkarni and R. Ratheesh, Mater. Chem. Phys., 2009, 113, 290–295 CrossRef CAS.
- P. S. Anjana, M. T. Sebastian, M. N. Suma and P. Mohanan, Int. J. Appl. Ceram. Technol., 2008, 5, 325–333 CrossRef CAS.
- Y. Yuan, Y. R. Cui, K. T. Wu, Q. Q. Huang and S. R. Zhang, J. Polym. Res., 2014, 21, 366 CrossRef.
- C. Riul, V. Tita, J. D. Carvalho and R. B. Canto, Compos. Sci. Technol., 2012, 72, 1451–1458 CrossRef CAS.
- Y. C. Chen, H. C. Lin and Y. D. Lee, J. Polym. Res., 2003, 10, 247–258 CrossRef CAS.
- D. N. Light and J. R. Wilcox, IEEE Trans. Compon., Packag., Manuf. Technol., Part A, 1995, 18, 118–126 CrossRef CAS.
- M. H. G. Wichmann, J. Sumfleth, F. H. Gojny, M. Quaresimin, B. Fiedler and K. Schulte, Eng. Fract. Mech., 2006, 73, 2346–2359 CrossRef.
- R. Penggang, L. Guozheng and Z. Zengping, J. Reinf. Plast. Compos., 2008, 28, 2221–2230 CrossRef.
- K. P. Murali, S. Rajesh, O. Prakash, A. R. Kulkarni and R. Ratheesh, Composites, Part A, 2009, 40, 1179–1185 CrossRef.
- C. Riul, V. Tita, J. D. Carvalho and R. B. Canto, Compos. Sci. Technol., 2012, 72, 1451–1458 CrossRef CAS.
- S. Kango, S. Kalia, A. Celli, J. Njuguna, Y. Habibi and R. Kumar, Prog. Polym. Sci., 2013, 38, 1232–1261 CrossRef CAS.
- D. J. Arthur and G. S. Swei, Ceramic filled fluoropolymetric composite material, US, 1991 Search PubMed.
- Y. C. Chen, H. C. Lin and Y. D. Lee, J. Polym. Res., 2004, 11, 1–7 CrossRef CAS.
- Y. Yuan, Y. Yin, D. Yu, H. Lin, J. Wang, B. Tang and E. Li, J. Mater. Sci.: Mater. Electron., 2016, 1–8 Search PubMed.
- D. J. Arthur, J. C. Mosko, C. S. Jackson and R. G. Traut, Electrical substrate material, US, 1989 Search PubMed.
- D. J. Arthur, G. S. Swei and A. F. Horn Iii, Ceramic filled fluoropolymeric composite material, US, 1993 Search PubMed.
- B. L. Zhu, H. Zheng, J. Wang, J. Ma, J. Wu and R. Wu, Composites, Part B, 2014, 58, 91–102 CrossRef CAS.
- M. T. Maher Abboud, E. Duguet and M. Fontanille, J. Mater. Chem., 1997, 7, 1527–1532 RSC.
- S. Karin, S. Ulrich, H. Thorsten, E. M. Abd, E. Klaus-Jochen, P. Doris, F. Dieter and V. Brigitte, J. Appl. Polym. Sci., 2010, 101, 1374–1380 Search PubMed.
- S. A. Perusich, J. Appl. Polym. Sci., 2011, 120, 165–183 CrossRef CAS.
- X. J. Cui, S. L. Zhong and H. Y. Wang, Colloids Surf., A, 2007, 303, 173–178 CrossRef CAS.
- J. D. Brassard, D. K. Sarkar and J. Perron, Appl. Sci., 2012, 2, 453–464 CrossRef CAS.
- Z. Xi, O. R. Ghita and K. E. Evans, J. Appl. Polym. Sci., 2011, 122, 2467–2477 CrossRef CAS.
- M. Hejda, K. Kong, R. J. Young and S. J. Eichhorn, Compos. Sci. Technol., 2008, 68, 848–853 CrossRef CAS.
- X. N. Wei, C. J. Zhao, J. J. Ma, Y. W. Huang, K. Cao, G. J. Chang and J. X. Yang, RSC Adv., 2016, 6, 1870–1876 RSC.
- D. Zhang, K. Kou, P. Gao, Y. Zhang and Z. Zheng, Polym. Eng. Sci., 2014, 54, 1427–1435 CAS.
| This journal is © The Royal Society of Chemistry 2017 |