 Open Access Article
Creative Commons Attribution 3.0 Unported Licence
Microwave absorption properties of carbon fiber radar absorbing coatings prepared by water-based technologies
Guo-dong Ban a,
Zhao-hui Liu*a,
Sheng-tian Yeb,
Hong-bo Yanga,
Rui Taoa and
Ping Luoa
aDepartment of Chemistry & Material Engineering, LEU, Chongqing 401311, China. E-mail: z_h_liu@163.com
bThe First Engineers Scientific Research Institute, Wuxi, 214000, China
First published on 18th May 2017
Abstract
Carbon fiber radar absorbing coatings (CFRACs), composed of different amounts of carbon fiber (CF) embedded in polyurethane resin, were prepared using water-based technologies. The microstructures and properties of the coatings were characterized by means of scanning electron microscopy, differential scanning calorimetry, Fourier infrared spectrometry, X-ray diffraction analysis, and vector network analysis. Our results show that with an increase in CF content and thickness of coating, the peak reflection of the CFRAC moved in the low frequency direction. When the CF content was 0.8 wt% and the thickness of the coating was 1.2 mm, the maximum reflection losses of the coatings were −11.01 dB over the frequency range of 8–18 GHz, with a less than −10 dB (over 90% microwave absorption) bandwidth of nearly 4.2 GHz and a coating density of 1.02 kg m−2. The results indicated that CFRACs could be a potential microwave absorbing material used over the frequency range of 8–18 GHz.
1. Introduction
Most weapons are equipped with radar systems to precisely attack their target. The target-attacking efficiency of weapons has been improved rapidly, benefiting from the fast development of radar technology.1 As a response, it is important to investigate efficient radar absorbing coatings, which can be applied to a target to escape a weapon's radar detection system.2 The radar absorbing efficiency is highly dependent on the composition and structure of the coating.3 It is much easier to improve the radar absorbing performance of coatings through designing the composition rather than the structure.4Therefore, tremendous efforts have been devoted to engineering the composition of coatings.5 The most well-known method is through organic solvent-based spin-coating methods. However, the organic components usually induce environment pollution and sometimes inevitably cause health problems for construction workers.6 As an alternative approach, researchers have been developing water-based techniques, which are environmentally benign and safe for workers, to create radar-absorbing coatings.7 Ling et al.8 prepared polyethylene/ethylene–octene copolymer composites filled with CFs. The experimental results showed that the effective absorption bandwidth (EAB, less than or equal to −10 dB) amounted to about 3.6 GHz and the maximum reflection losses achieved were −15.66 dB at 4.6 GHz and −17.37 dB at 16.4 GHz. Fang et al.9 fabricated a CF/Co0.2Fe2.8O4/PANI absorber demonstrating a highest attenuation effectiveness value of −38.2 dB (99.9% attenuation) at 12.7 GHz, indicating that such composites have good microwave absorption properties.
Unfortunately, it is not easy to achieve similar microwave absorption properties for coatings prepared via water-based techniques compared to those fabricated using organic solvent-based methods.10 For example, CFs are promising units for the construction of CFRACs owing to their unique properties, including high thermal and electrical conductivity, and strong mechanical strength, together with strong microwave absorption capabilities.11 However, it is difficult to achieve uniform CFRACs via water-based methods, as it is challenging to prepare well-dispersed CF dispersions in water.12–15 It would be highly promising to develop water-based techniques that could generate high quality CFRACs.16 Here, we studied the possibility of engineering CFRACs with comparable radar-absorbing performance to those prepared via organic solvent-based methods.17,18 The microwave absorption properties of CFRACs prepared under different experimental conditions were evaluated, which is important to supply guidance for the future design of CFRACs with high microwave absorption properties.
2. Experimental
2.1 Materials
Carbon fibers (CF) were purchased from Dongguan city, Chang'an Debang Arts & Crafts accessories. Polyurethane resin (PR) was bought from Zhuhai Jili Chemical Industry Enterprise Co., Ltd. Carboxy methyl cellulose acetate butyrate (CMCAB) was obtained from Eastman Chemical Company, for use as the thickening agent. The dispersing agent (BYK-377) was purchased from Nanjing Daoning Chemical Industry Enterprise Co., Ltd. The defoaming agent (BX-399) was supplied by Yitong High Polymer Material Co., Ltd. in Guangzhou. All chemicals were of analytical reagent (A.R.) grade and used without further purification. The water used in this study was deionized and doubly distilled.2.2 Sample preparation
The preparation process for the CFRACs included three critical parts: surface modification of CFs, the preparation of the coating solutions, and the spraying and solidification of the coating solutions.(1) Surface modification of CFs: the CFs were attached on the surface during processing, which went against the dispersion of CFs in aqueous polyurethane solution. Therefore, surface modification must be carried out first. First, a small amount of chopped CFs was introduced into acetone solution at room temperature for 3 h. Then, this was shaken with an ultrasonic cleaning machine for 1 h. Subsequently, the CFs were stored at 100 °C for 3 h. Finally, the acetone was poured out to remove dirt, before drying naturally.
(2) Preparation of the coating solutions: first certain amount of chopped CFs was put into an oven for 2 h to remove water vapor from the CFs. Then, CFs were added to a corresponding proportion of water-borne polyurethane, followed by mechanical agitation of the water-borne polyurethane and chopped CF blend for about 40 min. After adding 0.3 wt% thickener into the solution, the stirring process continued for 30 min.
(3) Spraying process: the substrate was cleaned following standard cleaning processes before spaying the solution. The distance between the spraying gun and the substrate was kept at 30 cm. The spraying pressure was varied to find the optimized conditions. The solution was sprayed evenly on the substrate. The thickness of the coatings could be controlled through the spraying time. Coatings of five different thicknesses were made for establishing the thickness-radar absorption performance relationship.
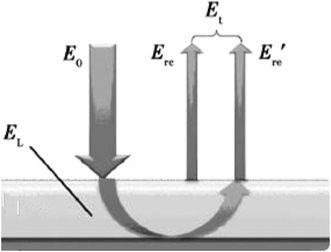
(4) Solidification process: the coating was cured in a furnace set at 60 °C for 6 h (Fig. 1).
2.3 Sample characterization
The physical and chemical structures of the CFs before and after acetone modification were analyzed using a Hitachi S-3700 electron microscope.Phase analyses of the CFs before and after acetone modification were conducted with a DX-2700 X-ray diffraction analyzer at a working voltage of 35 kV and a working current of 25 mA. The step width was 0.02°.
The surface functionalization of the CFs was studied using an attenuated total reflection infrared spectrometer. CFs mixed with potassium bromide were made into tablets after grinding. The reflective crystal was ZnSe. The incidence angle was 45°. The number of scans was 32. The resolution of the equipment was 4 cm−1.
The phase change temperatures and the phase change latent heats of the CFRACs were measured using a NETZSCHSTA409PC differential scanning calorimeter, using nitrogen gas as a shielding gas. The temperature was raised from 30 °C to 80 °C at a heating rate of 3°C min−1. The weight of the test sample was about 8 mg.
According to GJB2038-1994, the reflection depression of an electromagnetic wave over the frequency range of 8–18 GHz from the CFRAC was evaluated with an Agient-E8363B vector network analyzer.
3. Results and discussion
3.1 Microstructural analysis of the CFs
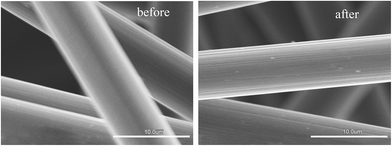
SEM photographs of the CFs before and after surface modification are shown in Fig. 2. The CFs were cylindrical with a diameter of about 7 microns. The surface of the pristine CFs was smooth, verifying the existence of the gluing agent on the surface. After modification, the CF surface became rough with obvious texture, which showed the glue on the CF surface was removed, facilitating subsequent combination with waterborne polyurethane.3.2 XRD measurements of the CFs
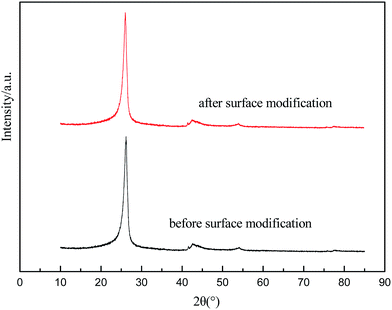
XRD spectra of the CFs before and after modification are shown in Fig. 3. A peak at 25° appeared in the CFs before modification, induced by the (002) crystal plane of the graphite structure. After modification, the XRD spectra did not show any obvious differences, reflecting that the modification process did not influence the physical structure of the CFs.3.3 FT-IR spectra of the CFs
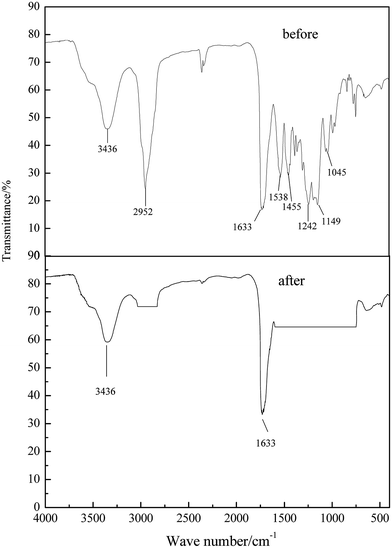
Fig. 4 shows FT-IR spectra of the CFs before and after surface modification. Multiple peaks emerged, originating from the structure of the molecules. Before modification, peaks at 3436 cm−1 were assigned to sp3 O–H bonds, at 2952 cm−1 to sp3 C–H bonds, at 1732 cm−1 and 1538 cm−1 to sp3 –NH bonds, at 1455 cm−1 to sp2 CH3 bonds, and at 1149 cm−1 and 1242 cm−1 to sp2 C–O–C bonds. However, as can be seen in Fig. 4, after modification, peaks at 3436 cm−1 were assigned to sp3 O–H bonds, and those at 1633 cm−1 to sp3 C![[double bond, length as m-dash]](https://www.rsc.org/images/entities/char_e001.gif) C bonds. The results indicated that, after modification, the glue on the CF surface was removed, facilitating subsequent combination with waterborne polyurethane.
C bonds. The results indicated that, after modification, the glue on the CF surface was removed, facilitating subsequent combination with waterborne polyurethane.
3.4 Thermostability analysis of the CFRACs
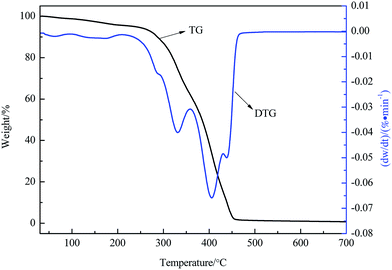
A TG-DTG curve for a CFRAC is shown in Fig. 5. It can be seen from the diagram that the CFRAC had a small weight loss in the process of heating up from room temperature to 300 °C, caused by the evaporation of absorbed water molecules and the decomposition of small group and branched chains. The weight loss was most intense between 300–350 °C, and was close to 100%. The weight loss peaks appeared at 331 °C and 405 °C. The maximum weight loss rate occurred at 405 °C. This was caused by the fact that most of the molecular chains were thermally degraded. Above 450 °C, the coatings basically decomposed, with a trace amount of carbide residue. The thermostability of the CFRAC was good, reflecting that the CFRAC could continue to maintain its microwave absorption properties in high temperature environments.3.5 The effects of CF content on the electromagnetic properties of CFRACs
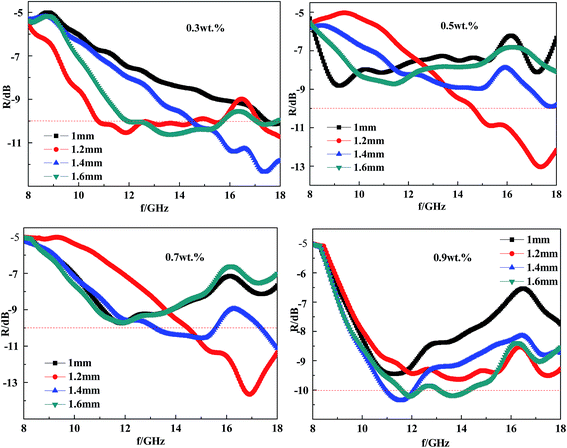
The electromagnetic properties of the CFRACs were mainly controlled by the CF content. A different CF content would result in different electromagnetic parameters, thus leading to varied microwave absorption properties. In order to achieve better absorption performance, the CF content must be lower than the electromagnetic shielding content. Fu et al.19 studied CF shielded concrete and found that when the content was greater than 1 wt% the concrete achieved electromagnetic shielding effects, so the upper limit for the content was 0.9 wt%. Wu et al.20 studied an absorbing CF structural material with a content of less than 0.1 wt% without absorbing properties, so the lower limit for the content was 0.3 wt%. For the experimental study, the CF content was 0.3 wt%, 0.5 wt%, 0.7 wt% and 0.9 wt% respectively. To build a relationship between the CF content and the microwave absorption properties, the reflectivity of CFRACs composed with different CF content (0.3 wt%, 0.5 wt%, 0.7 wt%, or 0.9 wt%) at a given thickness was measured. The results are displayed in Fig. 6 and summarized in Table 1.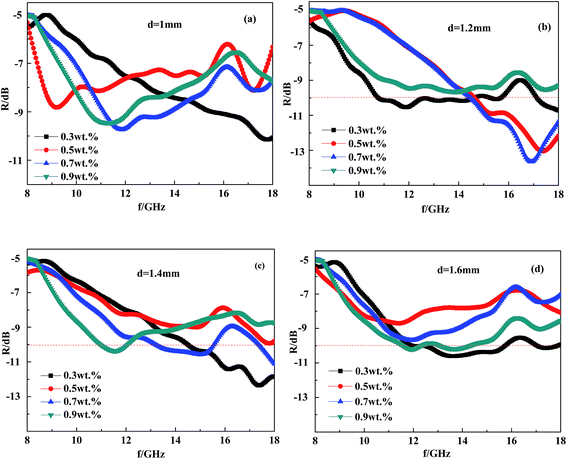 | ||
| Fig. 6 The reflectivity of CFRACs with different CF content at a given thickness ((a) 1 mm; (b) 1.2 mm; (c) 1.4 mm; and (d) 1.6 mm). | ||
| Thickness | Peak reflectivity and peak frequency | CF content | |||
|---|---|---|---|---|---|
| 0.3 wt% | 0.5 wt% | 0.7 wt% | 0.9 wt% | ||
| 1 mm | Rm (dB) | 5.2 | 3.2 | 4.7 | 4.5 |
| fm (GHz) | 17.6 | 16.7 | 8.2 | 7 | |
| 1.2 mm | Rm (dB) | 5.6 | 8.1 | 8.7 | 4.7 |
| fm (GHz) | 17.5 | 17.1 | 16.3 | 11.7 | |
| 1.4 mm | Rm (dB) | 7.4 | 8 | 5.6 | 5.4 |
| fm (GHz) | 17 | 16.8 | 13.2 | 7.7 | |
| 1.6 mm | Rm (dB) | 5.5 | 3.7 | 4.6 | 5.2 |
| fm (GHz) | 11.2 | 9.4 | 8.3 | 7.9 | |
From Table 1 and Fig. 6, it can be seen that the peak of the reflectance curve had a minimum value at a certain thickness as the CF content increased. Whether less or greater than this content, the reflectivity of the CFRAC over the test wavelength range would increase, or in other words, the microwave absorption properties would be weakened. An optimum content exists, regarding achieving the best microwave absorption properties. The peak frequency for the CFRAC would gradually move in the low frequency direction with an increase in CF content over the wavelength range we measured. According to the interface reflection model,16 the relationship between the peak frequency and the thickness of the absorbing layer is:
 | (1) |
According to Fig. 6 and Table 1, combined with the interface reflection model analysis, the best content would be 0.7–0.9 wt% if one wanted to prepare a CFRAC at a fixed thickness with good absorption performance over the wavenumber range of 8–18 GHz. In this case, the coating reflectivity could reach −8.7 dB, and the absorption band width was about 5 GHz.
3.6 The effect of coating thickness on the electromagnetic properties of the CFRACs
According to the interface reflection model, the coating thickness is one of the most important factors influencing the absorbing performance of CFRACs. Therefore, it is of great significance to generalize the thickness influence law for the preparation of high performance CFRACs. Based on the determination of the electromagnetic parameters at four different content levels (0.3 wt%, 0.5 wt%, 0.7 wt% and 0.9 wt%) of CF composite, the reflectivity was calculated, respectively, in the case of a certain content at different thicknesses. The calculated results are summarized in Fig. 8.Fig. 8 shows that the peak frequency of the reflectance curve moves in the low frequency direction with an increase in coating thickness, which could also be illustrated with the interface reflection model. This can be obtained from the interface reflection model demonstrating that the peak of the reflectance curve of a single layer absorbing material appears at the frequency where the absorbing thickness is 1/4 of the radar wave wavelength. If the coating thickness increases, the wavelength of the electromagnetic wave at the peak increases and the frequency is reduced. From Fig. 8, there was an optimum value of CF content at a given coating thickness to achieve a minimum reflectance peak. When the thickness of the absorbing coatings is fixed, there is an optimum CF content to make the coating's electromagnetic parameters meet the condition that the wave phase difference of the interface reflection wave before and after interface reflection is π at a certain frequency, together with the same amplitude at the same time. Therefore, the two columns of wave interference cancel, leading to full absorption. When the CF content varies, although the wave phase difference is still π, the different amplitudes lead to incomplete cancellation.
Fig. 8 shows that the best content would be 0.7–0.9 wt% if one wanted to prepare a CFRAC at a fixed thickness with good absorption performance over the frequency range of 8–18 GHz. In this case, the absorption bandwidth was less than −5 GHz. These results were consistent with the experimental observations. When the thickness was in the range of 1.2 mm to 1.6 mm, the frequency of the reflective peak moved by 8 GHz in the low frequency direction, proving that the material absorption characteristics were very sensitive to coating thickness. So during the actual construction of coatings, much attention should be paid to accurately controlling thickness.
3.7 The preparation and testing of the CFRACs
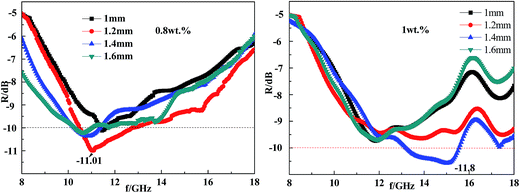
According to Section 3.5 and 3.6, the best CF content should be 0.7–0.9 wt% in the coating layer to reach strong absorption over a wide frequency band in the range of 8–18 GHz. As a result, we prepared a CFRAC composed of 0.8 wt% CF. As a control sample, we prepared a CFRAC composed of 1 wt% CF. The CFRACs were prepared on a piece of square aluminum plate with a side length of 18 cm.According to the GJB2038-94 standard test with the arch method of reflectance under different thicknesses, the reflectivity spectra of the CFRACs with different CF content were measured over the frequency range of 8 to 18 GHz. The test results are shown in Fig. 9.
Fig. 9 showed that with an increase in the coating thickness, the absorption peak of the CFRAC moved in the low frequency direction, which was consistent with the conclusions drawn before. For the CFRAC with a thickness of 1.2 mm composed of 0.8 wt% CF, the reflectivity of the coating layer reached −11.01 dB and the absorption peak appeared at 6.2 GHz. A bandwidth of less than −10 dB can span 4.2 GHz. The surface density of the coating layer was 1.02 kg m−2. As shown in Fig. 9, when the coating thickness was 1.4 mm composed of 1 wt% CF, the maximum reflection losses achieved were −11.01 dB and the peak appeared at 13.2 GHz. The bandwidth of reflectivity of less than 10 dB could spread over 3.2 GHz. The density of the coating was 1.22 kg m−2. Compared with the coating layer composed of 0.9 wt% CF, the coating composed of 1 wt% CF shows worse wave absorption performance. Based on the analysis and the experimental observations, thin CFRACs composed of 0.8 wt% CF perform better regarding wave absorption over a wide frequency band, with a low surface density.
4. Conclusions
Through systematic studies, we were trying to determine the best coatings that can depress radar wavelength reflection. Also, the wave absorptions of CFRACs with different thicknesses and different CF content were studied. Based on theoretical calculations and experiments, we provided optimum parameters to design CFRACs that can depress reflection over a broad wavelength range, which is important for the future design of camouflage coatings. The CF content in the CFRAC should be in the range of 0.7–0.9 wt% if one wants to achieve optimum absorption over the frequency range of 8–18 GHz. In this case, the reflective peak could reach −8.7 dB. The width of the absorption band of less than −10 dB was broad. According to the influence of CF content and coating thickness on the wave absorption, when the coating thickness was 1.2 mm, the best content of CF was 0.8 wt%. The maximum reflection losses achieved were −11.01 dB, and the minimum value appeared at 6.2 GHz. A bandwidth of less than −10 dB could span 4.2 GHz. The layer surface density was 1.02 kg m−2.Notes and references
- H. H. Wu, X. Y. Wang and L. Zhang, Cailiao Daobao, 2007, 21(5), 115–117 Search PubMed.
- G. D. Ban, Z. H. Liu and S. T. Ye, Biaomian Jishu, 2016, 45(6), 140–146 Search PubMed.
- M. X. Shi and X. H. Zhi, Cailiao Daobao, 2007, 21(3), 36–38 Search PubMed.
- Z. P. Deng, Z. H. Liu and G. Z. Zhou, Journal of Logistical Engineering University, 2013, 29(1), 54–59 Search PubMed.
- S. T. Ye, Z. P. Deng and Z. H. Liu, Journal of Logistical Engineering University, 2013, 29(1), 92–96 Search PubMed.
- Z. P. Deng, Z. H. Liu and G. Z. Zhou, Gongneng Cailiao, 2013, 43(B11), 335–338 Search PubMed.
- C. Z. Liu, Broadband Multilayer Absorbing Material Preparation and Performance Study, Master's thesis, University of Beijing Jiao Tong China, 2009.
- Q. Ling, J. Sun and Q. Zhao, Mater. Sci. Eng., B, 2009, 162, 162–166 CrossRef CAS.
- J. Fang, Z. Chen and W. Wei, RSC Adv., 2015, 5, 50024–50026 RSC.
- H. Lv, G. Ji and X. Li, J. Magn. Magn. Mater., 2015, 374, 225–229 CrossRef CAS.
- G. D. Ban, Z. H. Liu, Y. D. Ding and R. Lin, Journal of Logistical Engineering University, 2016, 3, 012–014 Search PubMed.
- W. M. Mao, K. Fang and Q. Y. Wu, Acta Material Composite Sinica, 2005, 22(1), 11–14 CAS.
- R. Panwar, V. Agarwala and D. Singh, Ceram. Int., 2015, 41(5), 2923–2930 CrossRef CAS.
- Y. Zhao, X. Cao and J. Gao, Microw. Opt. Tech. Lett., 2014, 56(1), 158–161 CrossRef.
- H. Zhang, Broadband Microwave Absorbing Performance Study of Stealth Materials, Master's thesis, University of Xi dian, 2012.
- Y. Tao and Z. P. Tao, Cailiao Daobao, 2011, 25(6), 40–44 CAS.
- Z. X. Hu, Ultrasonic Principle and Device for Thickness Measurement of Radar Absorbing Coatings, Master's thesis, University of Dalian Technology China, 2013.
- J. S. Xu, W. C. Zhou and F. Luo, Cailiao Daobao, 2014, 28(5), 46–49 CAS.
- X. Fu and D. D. L. Chung, Cem. Concr. Res., 1998, 28(6), 795–801 CrossRef CAS.
- J. Wu and B. Li, Biaomian Jishu, 2003, 32(6), 67–68 Search PubMed.
| This journal is © The Royal Society of Chemistry 2017 |


