 Open Access Article
Creative Commons Attribution 3.0 Unported Licence
The role of non-stoichiometric spinel for iso-butanol formation from biomass syngas over Zn–Cr based catalysts†
Shaopeng Tian ,
Siyi Ding,
Qianqian Yang,
Huaping Ren,
Qiang Ma,
Yunzhen Zhao* and
Zongcheng Miao*
College of Science, Xijing University, Xi’an, Shaanxi 710000, China. E-mail: miaozongcheng@xijing.edu.cn; zyz19870226@163.com; Tel: +86 18991150632 Tel: +86 18792791568
First published on 6th April 2017
Abstract
A series of Zn–Cr based catalysts modified by K promoter has been prepared by different methods and their performances for iso-butanol formation from biomass syngas were investigated in a fixed bed reactor. The ZnCr-c catalyst which was prepared by co-precipitation method showed the best catalytic performance for iso-butanol formation, over which ca. 30% of CO conversion and ca. 20% of iso-butanol selectivity were achieved. Multi-characterization studies were then conducted to reveal the internal causes for different performances for iso-butanol formation over different catalysts including high resolution transmission electron microscopy (HRTEM), X-ray diffraction (XRD), X-ray absorption spectroscopy (XAS), temperature programmed reduction (TPR) and X-ray photoelectron spectroscopy (XPS). The results reveal that ZnCr-c catalyst contains the maximum amount of non-stoichiometric spinel among all the catalysts. This fact implies that the non-stoichiometric spinel is the active phase for iso-butanol synthesis from syngas. The reducibility, texture parameters and basic property of catalysts are further important factors for the formation of iso-butanol over Zn–Cr based catalysts from biomass syngas.
1. Introduction
Energy is the foundation for survival and development of human society, and limitation of energy resources restrict the sustainable development of the economy and society.1–3 Unfortunately, energy limitations are becoming increasingly prominent in recent decades especially in developing countries such as China and India. Therefore, the exploration and development of safe and sustainable alternatives to fossil fuels is one of the most important global priorities today.4–7Biomass, which is generated from natural resources, shows huge potential as an alternative to fossil fuels as it is carbon neutral and easily cultivated in many different environments.8–10 Firstly, biomass can be converted directly into liquid fuels, called “biofuels”, to reduce the dependence on fossil fuels and cut down greenhouse gas emissions. Besides, gasification of biomass to syngas (a gaseous mixture predominantly composed of CO, H2, CO2 and CH4) and its subsequent conversion to higher alcohols were also identified as a promising process for the production of “green”, high quality transportation fuels.11–13
Higher alcohols (HA), typically defined as alcohols possessing two or more carbon atoms, have attracted considerable recent interest owing to their broad range of applications. In the chemical and polymer industries, they are widely employed as feedstocks and intermediates for the synthesis of commodity and specialty products. Among the higher alcohols from biomass syngas, iso-butanol is one of the most important clean synthetic fuels and chemical intermediates. Iso-butanol is considered to be an effective and clean fuel for automobiles with a high octane rating. Iso-butanol is also a general intermediate that is widely utilized for producing various chemicals, such as plasticizers and pharmaceuticals, etc. Until now, iso-butanol is a petroleum-derived product; it is mainly produced through the reaction of propylene carbonylation with high cost and low yield rate. The rapid increase in the consumption of iso-butanol as well as the petroleum crisis means that a low-cost and petroleum-free method of manufacturing iso-butanol is required.7,14,15
A promising non-noble metal family of catalysts, Zn–Cr based catalysts modified with alkali-metal promoter, has been widely studied for producing iso-butanol from syngas because of its longer time for retaining high activity and less severe coke deposition.16–18 They have shown rather high activity (10–30% CO conversion) and selectivity to alcohols, especially branched products, with methanol and isobutanol comprising up to 94% of the alcoholic fraction. That will simplify the process of separation of iso-butanol production in the alcohol phase and greatly contribute to the industrialization of iso-butanol. Additionally, the origin of this abnormally high selectivity of iso-butanol is also the motivation for understanding this catalytic process and the real active sites for iso-butanol in detail.
Oxides based on Zn and Cr have been studied extensively, and thorough reviews of the work have been published.16–19 Recently, Tan7 investigated the effect of different alkali metals over Cr/ZnO catalysts for iso-butanol synthesis from syngas, they found that K modified catalyst Cr/ZnO-K exhibited excellent catalytic ability for iso-butanol synthesis. Wu6,20 systemically studied the mechanism of iso-butanol formation over Cu–Zr based catalyst and discovered that the mechanism of iso-butanol formation consists of complex consecutive reactions; methanol is the initial product in the first step of the reaction and also the reactant for the next step of reaction to produce C2+ alcohol and iso-butanol. Ethanol is formed subsequently via the addition of a C1 (formyl) intermediate to the α-carbon of methanol (α-addition), and then aldol condensation occurs rapidly between methanol and ethanol to produce propanol (β-addition), which further reacts with methanol to produce iso-butanol (β-addition). In general, chain growth rates are low for iso-butanol because of its steric hindrance and the lack of two β-hydrogens required for aldol condensation reactions. Therefore, iso-butanol becomes a preferred end product of alcohol chain growth reactions. From the discussion above, we know that some consensus have been reached about the mechanism of iso-butanol formation among the world’s scientists, in terms of the three steps to form iso-butanol, namely the formation of methanol, methanol to ethanol, and ethanol to iso-butanol. It must be stressed here that, methanol could be generated easily, while the first chain growth step, to produce ethanol, is a rate-determining step. Once ethanol is generated, iso-butanol will easily form through aldol condensation (β-addition).
Though extensive studies on modified Zn–Cr based catalysts have been conducted in the mechanism of iso-butanol formation, there is still no definite answer to the question “what might the active phase actually be”. In recent decades, many studies have aimed at revealing the nature of the active sites in order to maximise the isobutanol productivity, but their identity remains controversial. ZnO has been generally identified as the active species and the promotional role of chromium was attributed to the formation of spinel, which prevents the sintering of small ZnO crystallites, or acting as a high surface area support.21,22 Bertoldi37–39 held a different point of view that it is a non-stoichiometric spinel phase which leads to the formation of higher alcohols.37–39
Before starting discussion of such a non-stoichiometric phase, we would like to remind the reader about the basic notions regarding spinels, specifically referring to those containing Zn and Cr. These materials follow the general formula ZnCr2O4. The ideal normal spinel, where Zn2+ and Cr3+ cations occupy tetrahedral and octahedral sites, respectively, is thermodynamically more stable than the ideal inverse spinel, where the position of Zn2+ and half of the Cr3+ species are reversed. In reality, the distribution of cations is seldom at these two extremes but lies in between the two structures; such solids are defined as non-stoichiometric spinels.
From what has been discussed above, we may safely draw the conclusion that there is still debate about the real active sites for iso-butanol formation on Zn–Cr oxide catalysts. In this paper, a series of Zn–Cr based catalysts were prepared by different methods and their performances for iso-butanol synthesis from biomass syngas were investigated in a fixed reactor. These catalysts also were investigated by multi-characterization techniques such as resolution transmission electron microscopy (HRTEM), X-ray diffraction (XRD), temperature programmed reduction (TPR) and X-ray photoelectron spectroscopy (XPS) to explore the real active phase for iso-butanol synthesis over Zn–Cr based catalysts.
2. Experimental section
2.1 Preparation of catalysts
Mechanical mixture method. Powders of ZnO and Cr2O3 were prepared by a typical co-precipitation method respectively, and then mixed mechanically (the detailed processing of the co-precipitation method is described in the “Co-precipitation method” section below). The Zn/Cr molar ratio was limited to 0.8 and the amount of impregnated K2O was limited to 3.0 wt%, respectively. The obtained catalysts were finally granulated into 30 to 40 meshes for catalytic performance evaluation. In this paper, catalysts were denoted as “ZnCr-a” for Zn–Cr catalysts prepared by a mechanical mixture method.
Fractional precipitation method. Appropriate amounts of chromium nitrate (Cr(NO3)3·9H2O) with (NH4)2CO3·CH3NO2 as precipitant were combined. Then, zinc nitrate (Zn(NO3)2·6H2O) was introduced in the dark green suspension after it was aged for 1 h. The following processing was the same as described in the “Co-precipitation method” section. The molar ratio of Zn to Cr was limited to 0.8 and the amount of impregnated K2O was limited to 3.0 wt%, respectively. In this paper, catalysts were denoted as “ZnCr-b” for Zn–Cr catalysts prepared by fractional precipitation method.
Co-precipitation method. The Zn–Cr based catalysts were prepared by co-precipitation of a solution (1 mol l−1) of Zn(NO3)2·6H2O mixed with Cr(NO3)3·9H2O with (NH4)2CO3·CH3NO2 as precipitant at 60 °C, pH = 11, in a well-stirred and thermo-stated container. The molar ratio of Zn to Cr was set to 0.8. The precipitate was settled at room temperature for 15 h, then washed to pH = 7 with deionized water. After drying at 120 °C for 12 h, the precursor was the calcined at 350 °C. Calcined catalyst was powdered and impregnated with 3.0 wt% K2O as a promoter using K2CO3 with incipient wetness method, then it was dried at 120 °C for 12 h and calcined at 400 °C. Finally, the promoted catalyst was pressed and crushed in 30–40 mesh. In this paper, catalysts were denoted as “ZnCr-c” for Zn–Cr catalysts prepared by co-precipitation method.
2.2 Characterization of catalysts
The morphology and microstructure of samples were investigated using a field emission transmission electron microscope (HRTEM, JEM-2100F) operated at 200 kV.The XPS spectra were measured by a Vg Escalab MK-2 spectrophotometer with a monochromatic Al-Kα (1486.6 eV) source and an accelerating voltage of 12.5 kV as well as power of 250 W. The sample was pressed into the fixed sample holder (10 mm diameter and 1 mm thick wafer), then it was transferred to a high vacuum chamber for further analysis with a vacuum pressure of 2 × 10⁻⁸ Pa. Charge referencing was done against adventitious carbon (C 1s, 284.8 eV).
The X-ray powder diffraction (XRD) patterns of the prepared catalysts were obtained by a Bruker D8 powder diffractometer equipped with a Ni-monochromator and Cu-K (40 kV, 100 mA) radiation.
Nitrogen adsorption–desorption isotherms were carried out at −195.8 °C using a Micromeritics ASAP 2020 analyzer. Before adsorption, the samples were out-gassed at 350 °C for 10 h. The specific surface area (SBET) was evaluated using the BET method, while the pore size distribution was calculated according to the Barrett–Joyner–Halenda (BJH) formula applied to the desorption branch.
Temperature-programmed reduction (TPR) measurements was used to test the redox properties of different prepared catalysts. H2-TPR was recorded on a TP-5050 automatic chemical adsorption instrument in the range from 50 to 600 °C with a 10% H2/Ar mixture flowing at 30 ml min−1 and heated at a rate of 5 °C min−1. A 100 mg sample was treated at 300 °C in pure argon flow for 2 h to eliminate the adsorption of physically adsorbed water and impurities, and then cooled to 50 °C. The argon was then replaced and stabilized by the reductive gas. The effluent gas was analyzed by a thermal conductivity detector (TCD).
The temperature programmed desorption of carbon dioxide (CO2-TPD) was recorded on a TP-5050 automatic chemical adsorption instrument in the range from 50 to 550 °C. For the sake of accuracy, pure standard mixtures [zeolite + activated carbon] were used during preliminary TPD measurements. The catalysts were saturated with CO2 flow at 50 °C after pretreatment at 400 °C for 180 min in reducing gas which contains 10% H2 in Ar. Then pure Ar was flowed for 120 min at the same temperature to eliminate the adsorption of physically adsorbed water and impurities. Finally, the temperature was increased at a constant rate of 5 °C min−1 under an appropriate amount of Ar flow. The desorbed species were analyzed by thermal conductivity measurements.
The X-ray absorption spectrum (XAS) data of Zn and Cr were obtained at the beamline BL14W1 of the Shanghai Synchrotron Radiation Facility (SSRF). The storage ring was operated at 3.5 GeV with a constant current of 250 mA. A Si (111) monochromator was used for the tests. The catalysts were homogeneously smeared on the tapes to reach the optimum thickness (Δμ × d ≈ 1, Δμ is the absorption edge jump and d is the physical thickness of catalysts).
XAS data were analyzed using the specialized software ATHENA. The absorption curves were obtained after removing the pre-edge and post-edge background. All of the curves were firstly normalized to unity before comparison. The Fourier transform (FT) spectra were obtained in a Hanning window in the range of 3–14.5 Å−1 for Zn atom and 3–13.5 Å−1 for Cr atom.
2.3 Anderson–Schultz–Flory (A–S–F) distribution analysis
In order to investigate the role of non-stoichiometric spinel ZnxCr2/3(1−x)O for iso-butanol synthesis for biomass syngas on Zn–Cr based catalysts, an Anderson–Schultz–Flory (A–S–F) distribution is adopted,where Wn is the weight fraction of an alcohol (containing n carbon atoms) in total alcohols in the products. The parameter α is defined as the chain growth probability that a molecule continues reacting to form a longer chain. The parameter α is greater than zero but is less than one because a part of intermediates desorb on the catalyst surface in each step of the growth of carbon chain.
2.4 Activity measurements of catalysts
The catalytic reactions were carried out by using a fixed-bed reactor made of stainless steel with 5 ml catalysts. The flow rate of the feed gas was controlled by a mass flow controller, and the exit gas was measured by a wet test meter. The catalyst was reduced according to the designed temperature program, i.e. from room temperature to 360 °C, by using a mixture of H2/N2 = 10/90 for over 2 h. The reactions were run by using a feed biomass syngas at a space velocity of 3000 h−1. The biomass syngas mainly includes CO, H2, CO2 and CH4. The molecular ratio of H2/CO is ca. 2.6. The reactions were implemented at 400 °C, 10 MPa. The product stream was analysed by using a GC 4000 gas chromatograph. Syngas and exit gas were analysed by using a column of carbon sieves and a thermal conductivity detector TCD to monitor H2, CH4, CO and CO2. CHx mixtures were analysed by a GDX-403 column and a flame ionization detector. Water and methanol were detected by a GDX-401 column and a thermal conductivity detector. The mixtures of alcohol products were analysed by another GC-7A with a chromosorb 101 column and a flame ionization detector.3. Results and discussion
3.1 Morphology and microstructure of catalysts
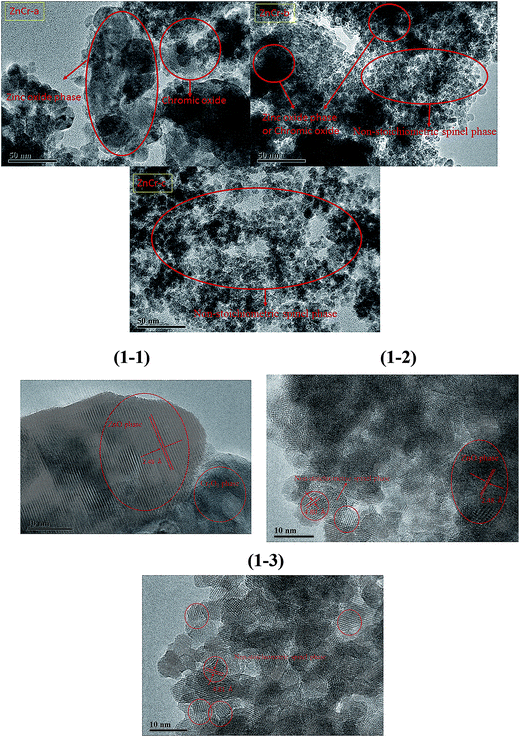
The TEM and HRTEM images of catalysts prepared by different methods are shown in Fig. 1 and 1-1 to 1-3, respectively. In our previous experiments, we have found that the catalysts with non-stoichiometric Zn–Cr spinel structure all have particles of around 6 nm in diameter while the catalysts with zinc oxide phase structure have particles of larger than 20 nm in diameter. The microstructures of the catalysts, shown in Fig. 1-1 to 1-3, further confirm this conclusion. It is seen that the ZnCr-a catalysts, prepared by mechanical mixture method, had a wurtzite crystal structure of zinc oxide phase and chromium(III) oxide phase. There was no non-stoichiometric spinel phase in ZnCr-a catalysts. However, the non-stoichiometric spinel phase appeared both in ZnCr-b catalysts (prepared by fractional precipitation method) and in ZnCr-c catalysts (prepared by co-precipitation method). It was worth noting that the zinc oxide phase and chromium oxide phase also were found in ZnCr-b catalysts while these two phases could not be found in ZnCr-c catalysts which is consistent with XRD analysis in Fig. 2. Hence, a conclusion could be obtained cautiously that none of Zn2+ and Cr3+ ions formed non-stoichiometric spinel phase in ZnCr-a catalyst, while part of Zn2+ and Cr3+ ions formed the non-stoichiometric spinel phase in ZnCr-b catalyst and all of the Zn2+ and Cr3+ ions formed the non-stoichiometric spinel phase in ZnCr-c catalyst. The conclusion also could be further confirmed by the results of TPR and XPS spectra.3.2 Characterization of the catalysts using powder X-ray diffractometry
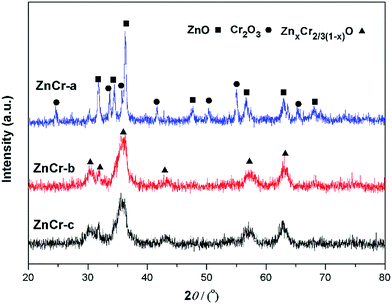
Fig. 2 shows the powder X-ray diffractometry (XRD) patterns of Zn–Cr catalysts prepared by different methods. No diffraction peaks for potassium species were found in any of the XRD patterns. No K2O (JCPDS card 47-1701) or K2CO3 (JCPDS card 49-1093) peaks were found, possibly because the K2O phases over the catalyst surfaces were highly dispersed. The particle size calculated by the Scherrer equation from XRD signals is 27.8 nm for ZnO, 15.8 nm for Cr2O3 and 5.9 nm for non-stoichiometric spinel particles. These values are consistent with TEM images analysis. The main reflections of ZnCr-a XRD signals were consistent with the standard pattern of zinc oxide and chromium(III) oxide phase while the XRD signals of non-stoichiometric spinel could not be found.7 Concerning the ZnCr-b and ZnCr-c XRD signals, the main reflections were consistent with the standard pattern of non-stoichiometric spinel (ZnxCr2/3(1−x)O).23–25 All the results of XRD patterns are consistent with TEM images analysis. It was worth noting that neither zinc nor chromium oxide phase diffraction was found in ZnCr-b catalyst. Combining with the results of TEM images, the small part of zinc or chromium oxide may be highly dispersed on the catalysts surface in an amorphous state.3.3 XAS analysis of catalysts
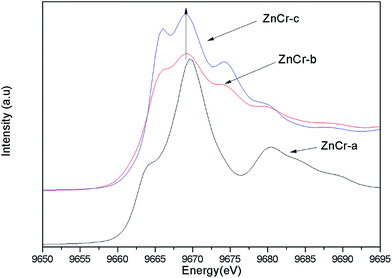
Synchrotron radiation technique is a powerful tool to investigate the chemical environment around central metal atoms. Both XANES and EXAFS provide valuable information about the coordination numbers and distances of central metal atoms. Recently, they have been used to investigate the cation distribution in spinels such as CuFe2O4, ZnFe2O4, MnFe2O4, etc.44–48Fig. 3 shows the normalized XANES spectra for Zn atoms in catalysts. The curve of ZnCr-a catalyst shows a huge difference from the curves of ZnCr-b and ZnCr-c catalysts, indicating that the structure of ZnCr-a catalyst is very different from the others. All the peaks of ZnCr-a catalyst are similar to the curves of standard ZnO foil while the peaks of ZnCr-b and ZnCr-c catalyst are similar to the curves of Zn–Cr spinel structure. Comparing the curves of ZnCr-b and ZnCr-c catalysts, it is obvious that the intensity of peak located at 9668 eV became stronger in the sequence of ZnCr-b to ZnCr-c catalyst. In a similar report, Stewart et al.42 have shown that the intensity of the peak located at 9668 eV become stronger when the cation disorder distribution in the spinel structure of Zn–Fe spinel become more extensive. It is highly probable that these changes in our experiment have the same origin for Zn–Cr spinel. Chen et al.43 also studied the cation distribution in normal and non-stoichiometric Zn–Cr spinel structure and the XANES spectra showed a similar change as we observed here. Therefore, the intensity change of the peak located at 9668 eV shows a local structural change in Zn–Cr spinel which results from considerable zinc cation transference from tetrahedral to octahedral sites.
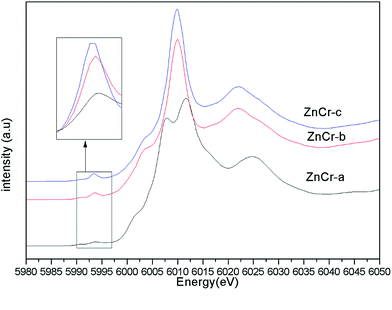
Fig. 4 shows the normalized XANES spectra for Cr atoms in catalysts. The huge difference between the curves of ZnCr-a catalyst and ZnCr-b (ZnCr-c) catalyst also indicates that the structure of ZnCr-a catalyst is very different from the others. Comparing carefully the spectra of ZnCr-b and ZnCr-c catalyst, it is obvious that the intensity of pre-edge peak (see inset in Fig. 4, upper left corner) becomes stronger in the sequence of ZnCr-b to ZnCr-c catalyst. In theory, the pre-edge peak is due to the quadrupole transitions from the 1s to the 3d electronic orbital, which is forbidden because of the electric dipole. The increase of the pre-edge peak is due to the enhancement of the orbital p–d mixing, allowed in tetrahedral symmetry but forbidden in octahedral symmetry. Thus, the increase of the pre-edge peak reflects the increase of the occupation number of Cr atoms in tetrahedral sites. It is worth noting that Cr atoms should locate at octahedral sites rather than tetrahedral sites in a normal Zn–Cr spinel. In other words, the cation disorder distribution becomes more extensive in ZnCr-c catalyst than that of ZnCr-b catalyst. Non-stoichiometric spinel has formed in both ZnCr-b and ZnCr-c catalysts. All data are well consistent with the results of the XANES spectra for Zn atoms.
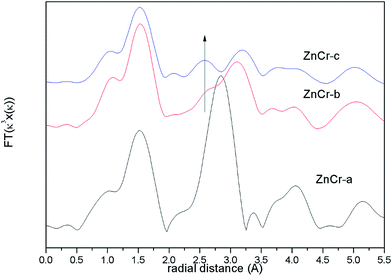
The corresponding Fourier transforms EXAFS signals for Zn atoms in catalysts are compared in Fig. 5 In theory, the first and second shell distance from the central Zn atom in Zn–Cr spinel structure is 1.60 and 3.01 Å respectively (the instrumental error has been considered). As shown in Fig. 5, both of these distances are observed in ZnCr-b and ZnCr-c catalysts. On taking a close look at the signals, it is obvious that besides the two normal peaks at 1.60 and 3.01 Å, an additional peak also appears at 2.60 Å which clearly results from the cation disorder distribution. Stewart et al.42 have found a similar change in ZnFe2O4 spinel. For catalysts in our experiment, when Zn atoms substitute to octahedral sites, a new shell would appear at 2.60 Å and result in a new peak. Not surprisingly, the location of this additional peak corresponds to the second coordination distance of Cr atom (seen in Fig. S3†). It further clearly confirmed the conclusion that some part of Zn cations migrate into octahedral sites, signifying cation disorder distribution and appearance of the non-stoichiometric spinel.
From the analysis of XANES and EXAFS, one conclusion could be stated that the preparation method could affect the cation distribution in the Zn–Cr spinel structure. Specifically, the catalyst would only contain ZnO and Cr2O3 phase if the catalyst was prepared by a mechanical mixture method while the non-stoichiometric spinel would be formed if the catalyst was prepared by fractional precipitation or co-precipitation method. The amount of non-stoichiometric spinel (the degree of cation disorder distribution) reaches a maximum when the catalyst was prepared by the co-precipitation method (ZnCr-c catalyst).
3.4 Texture parameters of catalysts
The texture parameters for the catalysts prepared by different methods are shown in Table 1. The Brunauer–Emmett–Teller surface areas (SBET) of the catalysts increased linearly from 57.3 to 95.6 m2 g−1 in the sequence of ZnCr-a, ZnCr-b and ZnCr-c catalysts. The changing trend of catalysts SBET could be explained by the different particle sizes of catalysts which has been confirmed by TEM images and XRD patterns. The pore volumes and radii of catalysts are also influenced by the particle size of catalysts. Bigger pore radii and pore volumes more readily allow bigger molecules (e.g. iso-butanol) to diffuse from the active sites inside the pore, which may be a significant factor for better catalytic performance for the formation of iso-butanol.| Catalyst | SBET (m2 g−1) | Vp (cm3 g−1) | Rp (nm) |
|---|---|---|---|
| ZnCr-a | 57.3 | 0.124 | 5.8 |
| ZnCr-b | 74.0 | 0.207 | 11.9 |
| ZnCr-c | 95.6 | 0.287 | 13.4 |
3.5 Characterization of the catalysts using X-ray photoelectron spectra
X-Ray photoelectron spectra (XPS) studies of the samples were carried out in order to investigate the chemical state and average chemical valences of the elements over the catalysts surface. The results are shown in Fig. 6a and b. Features caused by the presence of Zn and Cr elements were all quite prominent.22,26 In Fig. 6a, the binding energy value of Zn in ZnCr-a catalyst was located at an average of 1021.9 eV, while the binding energy value of Zn in ZnCr-b and ZnCr-c catalyst located at around 1022.1 and 1022.4 eV, respectively. This indicates that the valency of Zn over the ZnCr-c catalyst surface is slightly larger than that of ZnCr-a and ZnCr-b catalysts. Fig. 6b shows the typical XPS spectra of Cr 2p3/2. The binding energy changing trend of Cr is very similar to that of Zn over the catalysts. The binding energy value of Cr in ZnCr-c catalyst which is located at around 577.6 eV is also slightly larger than that of ZnCr-a and ZnCr-b catalysts which is located at around 576.7 and 577.1 eV, respectively.22,26 The spectra of all catalysts contained a typical Cr6+ peak at 578.1 eV, indicating that each of catalysts had partly been over-oxidized.27 The difference of XPS peak intensities may be the result from the different amount of samples for each measurement.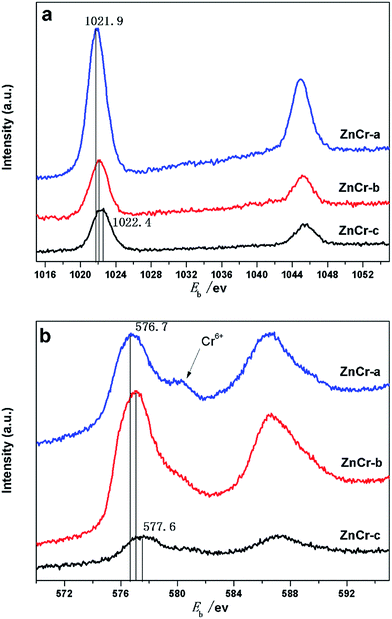 | ||
| Fig. 6 (a) XPS analysis: Zn 2p spectra of catalysts prepared by different methods. (b) XPS analysis: Cr 2p spectra of catalysts prepared by different methods. | ||
In a previous study, Battistoni28 found that all of the Zn 2p and Cr 2p binding energy values for the non-stoichiometric spinel compounds lie, within the experimental errors, at slightly larger values than those for ZnO and Cr2O3 oxide. The difference could be attributed to a different Madelung potential contribution in the spinels and in the oxide. The Zn 2p and Cr 2p binding energy values increased in the order of ZnCr-a, ZnCr-b and ZnCr-c catalysts in our experiments, most likely resulting from the similar reason: the formation of non-stoichiometric spinel. Catalyst ZnCr-c has the highest valence suggesting that it has the highest amount of the non-stoichiometric spinel structure. This is consistent with the results of TEM and XRD patterns.
3.6 Temperature program reduction of hydrogen (H2-TPR) analysis of the catalysts
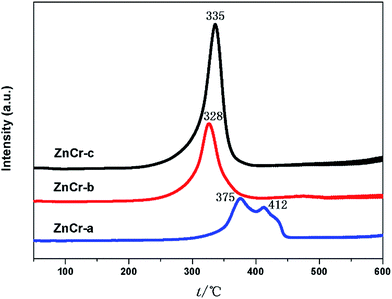
The redox properties of the different catalysts were evaluated by performing H2-TPR analyses of the catalysts, and the results are shown in Fig. 7. For the ZnCr-a catalyst, there were two hydrogen consumption peaks appearing around 375 and 412 °C. The peak at lower temperature can be attributed to the reduction of Cr6+ species to Cr3+ species, and the peak at the higher temperature should be due to the reduction of Cr3+ species to Cr2+ species. The ZnO phase over ZnCr-a catalyst could not be reduced in the temperature range of the experiments. Each catalyst of ZnCr-b and ZnCr-c had only one main hydrogen consumption peak in the temperature range from 328 to 335 °C which could be attributed to the reduction of non-stoichiometric Zn–Cr spinel. The hydrogen consumption values for the samples of ZnCr-b and ZnCr-c catalysts were about 1.32 and 1.71 mmol g−1, respectively. It has previously been found that Zn2+ and Cr3+ in Zn–Cr normal spinel are very difficult to be reduced. However, each of our catalysts was in a “metastable state” because of the presence of non-stoichiometric spinel which contain a large number of defects and oxygen vacancies, and that should make the catalysts much more reducible than normal Zn–Cr spinel. Our XPS analyses of the samples showed that the Zn and Cr valences were higher in non-stoichiometric spinel samples than in normal spinel samples which also meant that our catalysts could be reduced much more easily than normal spinel.After H2 adsorption, zinc oxide has become free state Zn2+. Tan7 recently discovered that the active species in the studied reaction are free state Zn2+ located in octahedral site (disordered distribution) inside the non-stoichiometric spinel structure. If the reducibility of non-stoichiometric spinel is higher, there will be more free state Zn2+ formed from zinc oxide, as a result the catalyst activity will be better.7
3.7 Temperature programmed desorption of carbon dioxide (CO2-TPD) analysis of the catalysts
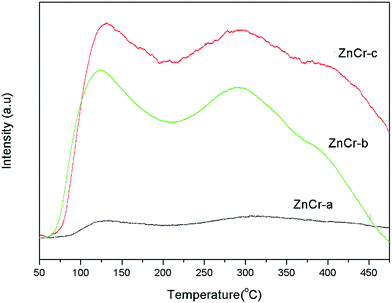
The basicity property of the samples prepared by different methods are estimated by temperature programmed desorption of carbon dioxide (CO2-TPD) analysis and the results are shown in Fig. 8. These TPD patterns differ between samples in their positions, heights and widths, indicating changes not only in the total basicity, but also in the distribution of the basicity strength.When the specific uptakes are compared, it is obvious that the CO2 uptakes are increased in the sequence of ZnCr-a, ZnCr-b and ZnCr-c catalysts. Both weak and strong basicity sites are few when the catalysts are prepared by mechanical mixture method and are both enhanced markedly when the catalysts are prepared by fractional precipitation and co-precipitation methods. An accurate evaluation of the basic properties of the catalysts required quantitative analyses to be performed. The values of CO2 desorption for the ZnCr-a, ZnCr-b and ZnCr-c samples were about 0.21, 1.95 and 2.54 mmol g−1, respectively. This further proved that both the weak and strong basicity sites increased in the sequence of ZnCr-a ZnCr-b and ZnCr-c catalysts and reached the maximum value when the catalyst was prepared by the co-precipitation method.
In general, the basicity property is closely related to the intrinsic nature of catalysts, especially surface properties. As has been discovered, the amount of non-stoichiometric spinel appeared and increased for catalysts prepared by fractional precipitation and co-precipitation method, respectively. The catalysts with non-stoichiometric spinel phase showed more surface defects and oxygen vacancies. That should strongly effect on the distribution of the basicity property and enhance the basicity sites markedly.
As discussed above, iso-butanol is formed through α-addition and β-addition over Zn–Cr based catalyst. Previous researchers have proved that the basicity property affects strongly the productivity and selectivity of iso-butanol. They found that basicity affects dramatically the β-addition (aldol condensation) process which is a necessary step to form iso-butanol over Zn–Cr based catalyst, indicating basicity property is one of the key factors for iso-butanol formation. The non-stoichiometric spinel could offer more basicity sites that should be an important factor for high productivity and selectivity of iso-butanol.
3.8 Catalytic performance of the catalysts
The optimal reaction conditions were firstly investigated over the ZnCr-c catalyst for the formation of iso-butanol including different reaction temperature, different reaction pressure and different gas hourly space velocity (GHSV). From the thermodynamic results of other research,40,41 increasing the reaction pressure is always beneficial for the formation of alcohols while high reaction temperature is detrimental to this reaction and results in lower yields of higher alcohols. What must be stressed here is that not only the catalysts performance but also the kinetic factors and energy consumption need to be considered while identifying the optimal reaction conditions. The results of typical performance under different conditions over ZnCr-c catalyst are shown in Tables S1–S4.† From Tables S1–S4,† it can be found easily that the ZnCr-c catalyst shows the best performance for iso-butanol synthesis from biomass syngas under the optimised reaction conditions, with temperature of 400 °C, pressure of 10 MPa and GHSV of 3000 h−1. In our reaction conditions, equilibrium limitation has not yet reached based on our experimental results and other researchers’ calculations.40,41The catalysts performance for the formation of iso-butanol and MeOH from biomass syngas was measured under the optimal reaction conditions and the typical results are shown in Table 2. As a comparison, the catalytic performance of ZnO and Cr2O3 catalysts for the formation of iso-butanol are also shown in Table 2.
| Catalyst | CO conversion (%) | Alcohol selectivity (%) | Total alcohol rate (g ml−1 h−1) | Alcohol distribution (wt%) | ||||
|---|---|---|---|---|---|---|---|---|
| Methanol | Ethanol | Propanol | Iso-butanol | C5+ alcohol | ||||
| a Reaction conditions: temperature = 400 °C, pressure = 10 MPa, GHSV = 3000 h−1. | ||||||||
| ZnCr-a | 17.3 | 37.7 | 0.033 | 72.6 | 15.3 | 8.29 | 3.13 | 0.69 |
| ZnCr-b | 26.5 | 42.2 | 0.075 | 75.4 | 4.71 | 4.08 | 13.6 | 0.95 |
| ZnCr-c | 30.4 | 49.7 | 0.091 | 74.3 | 1.47 | 2.91 | 20.2 | 1.22 |
| ZnO | 15.5 | 31.4 | 0.035 | 54.6 | 21.8 | 13.5 | 4.77 | 0.52 |
| Cr2O3 | 5.23 | 15.3 | 0.011 | 67.1 | 16.5 | 9.16 | 4.16 | 0.85 |
In Table 2, the catalyst prepared by mechanical mixture method showed the worst catalytic performance among the Zn–Cr based catalysts, only 17.3% of the CO was converted, and the selectivity for alcohol and iso-butanol was extremely poor, with selectivity for alcohol at a minimum of 37.7% and the iso-butanol amounted to just 3.13 wt% of alcohol production. The catalyst prepared by fractional precipitation method (ZnCr-b catalyst) showed much better catalytic performance for iso-butanol synthesis from biomass syngas. The CO conversion of ZnCr-b catalyst increased to 26.5%; the alcohol selectivity was improved to 42.2%; and the iso-butanol selectivity was enhanced to 13.6%. The catalyst prepared by co-precipitation method (ZnCr-c catalyst) presented the best catalytic performance for the formation of iso-butanol from biomass syngas. The CO conversion was enhanced to 30.4%; the total alcohol rate was the highest at 0.091 g ml−1 h−1; the alcohol and iso-butanol selectivity also reached maximum values of 49.6 and 20.2%, respectively. It is worth noting that the selectivity value of methanol plus iso-butanol is around 94% in alcohol production which is a typical characteristic of optimal Zn–Cr catalysts. This should simplify the process of products separation and then contribute greatly to the industrialization of iso-butanol.
The present catalysts prepared by different methods presented a lower selectivity for iso-butanol than that of the Zn–Cr samples reported by Epling and co-workers,21,22 possibly due to the differences in the reaction conditions and/or sample composition and texture. It must be stressed that the point of our present study is not to improve on the highest reported selectivity for iso-butanol, but to study the role of non-stoichiometric spinel for iso-butanol synthesis over Zn–Cr based catalysts.
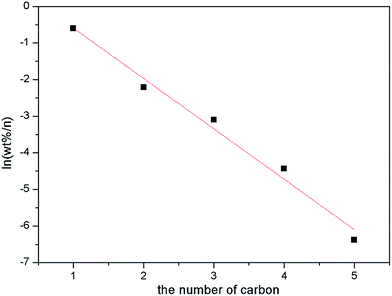
As will be noticed, the catalytic performance, especially the alcohol distribution over ZnCr-a catalyst displays a huge difference from the ZnCr-b and ZnCr-c catalysts. From the results of alcohol distribution, it can be readily seen that the selectivity for alcohol with higher carbon number decreased dramatically over ZnCr-a catalyst while the alcohol products mainly contain methanol and iso-butanol over ZnCr-b and ZnCr-c catalysts. In order to find the causes in depth for this huge difference and investigate the role of non-stoichiometric spinel for iso-butanol synthesis from biomass syngas on Zn–Cr based catalysts, an Anderson–Schultz–Flory (A–S–F) distribution was adopted for the catalytic performance of ZnCr-a catalyst and the result is shown in Fig. 9.
From the result of Fig. 9, it is obvious that the alcohol distribution over ZnCr-a catalyst obeys the A–S–F distribution which means the mechanism for higher alcohol formation is via a CO insertion mechanism.29–32 In the CO insertion mechanism, the chain initiation and chain propagation proceed similarly to form surface alkyl species (CnHz*) and termination by CO insertion gives alcohols through surface acyl species (CnHzCO*) followed by hydrogenation. The CO insertion mechanism rationalizes why the catalysts mainly produce linear primary alcohols and why the alcohol distribution obeys the A–S–F rule. According to this theory, the selectivity for alcohols with higher carbon number will decrease dramatically as shown in Fig. 9.
In Table 2, from the results of the alcohol distribution over ZnCr-b and ZnCr-c catalysts, the alcohol products mainly contain methanol and iso-butanol which obviously do not obey the A–S–F distribution rule. That means the mechanism for higher alcohol formation, mainly forming iso-butanol, is not by CO insertion but instead by β-addition.33–36 In the β-addition mechanism, iso-butanol is formed through the addition of a C1 (formyl) intermediate to the α-carbon of methanol (α-addition) to produce ethanol, then the aldol condensation process (β-addition) between methanol and ethanol to produce propanol, and the aldol condensation process (β-addition) between methanol and propanol to produce iso-butanol. Chain growth rates are low for iso-butanol (2-methyl-1-propanol) because of its steric hindrance and the lack of the two β-hydrogens required for aldol condensation reactions. Therefore, iso-butanol becomes a preferred end product of alcohol chain growth reactions. The α-addition is a rate-determining step with high energy barriers while the β-addition is a rapid reaction step. According to this theory, methanol and iso-butanol are the main production in alcohol phase as shown in Table 2.
The question arises as to why the alcohol distribution displays a huge difference between ZnCr-a and ZnCr-c (ZnCr-b) catalysts. Based on the preceding analysis of multi-characterization results, the main components are ZnO and Cr2O3 phase in ZnCr-a catalyst while the main component is non-stoichiometric spinel ZnxCr2/3(1−x)O phase in ZnCr-b and ZnCr-c catalysts. It can be inferred that, with the change of the preparation methods, the change of catalyst components may be the main reason for the differences of alcohols distribution. Specifically, the mechanism for higher alcohol formation is the CO insertion mechanism over ZnCr-a catalyst which is comprised of ZnO and Cr2O3 phases without non-stoichiometric spinel phase. However, once the non-stoichiometric spinel phase is formed, as for ZnCr-b and ZnCr-c catalysts, the mechanism of the higher alcohol formation will be changed to β-addition because it is a rapid reaction step with lower energy barrier. The alcohol distribution will then change dramatically from the A–S–F distribution to methanol plus iso-butanol distribution. Hence, the non-stoichiometric spinel phase should be the active phase for β-addition to form iso-butanol. The ZnCr-c catalyst shows the better catalytic performance owing to the higher amount of the non-stoichiometric spinel phase, further confirming this conclusion.
The non-stoichiometric Zn–Cr spinel is a metastable state that leads to much more defects and oxygen vacancies. These defects and oxygen vacancies could make the catalyst more readily adsorb and activate reactant molecules during the reactions and benefit the catalytic performance. The lager BET surface area (SBET), easier reduction, and higher number of basic sites over the ZnCr-c catalyst also make a substantial contribution to the better catalytic performance for the formation of iso-butanol.
4. Conclusions
In this study, we prepared a series of Zn–Cr based catalysts using different methods and then investigated the catalysts performance for iso-butanol synthesis from biomass syngas. Among the tested catalysts, the catalysts prepared by co-precipitation (ZnCr-c) displayed the highest CO conversion of 30.4%, the largest total alcohol production rate of 0.091 g ml−1 h−1, and the highest iso-butanol selectivity of 20.2%.The non-stoichiometric Zn–Cr spinel plays an essential role for the formation of iso-butanol from syngas. Co-precipitation method would promote the formation of non-stoichiometric Zn–Cr spinel and dramatically enhance the catalytic performance. The non-stoichiometric Zn–Cr spinel causes much more defects and oxygen vacancies that could make the catalyst more adsorbing and activate reactant molecules more easily during the reactions and substantially improve the catalytic performance. Good reducibility, texture parameters and high basicity of catalysts are also important factors for the formation of iso-butanol over Zn–Cr based catalysts from biomass syngas.
Acknowledgements
The authors thank the Shanghai Synchrotron Radiation Facility for providing the beamline BL14W1 for this experiment. This work was supported by the National Natural Science Foundation of China (51673157) and the Training Programme Foundation for the Talents by Xijing University (XJ16T05). We thank Prof. Yisheng Tan very much for his guidance and advice during this work (State Key Laboratory of Coal Conversion, Institute of Coal Chemistry, Chinese Academy of Sciences, Taiyuan, Shanxi 030001, China).Notes and references
- Y. Liu, D. Li, T. Wang, Y. Liu, T. Xu and Y. Zhang, ACS Catal., 2016, 6, 5366–5370 CrossRef CAS.
- F. Jiao, J. Li, X. Pan, J. Xiao, H. Li, H. Ma, M. Wei, Y. Pan, Z. Zhou, M. Li, S. Miao, J. Li, Y. Zhu, D. Xiao, T. He, J. Yang, F. Qi, Q. Fu and X. Bao, Science, 2016, 351, 1065–1068 CrossRef CAS PubMed.
- X. Guo, D. Mao, G. Lu, S. Wang and G. Wu, J. Catal., 2010, 271, 178–185 CrossRef CAS.
- P. Wang, J. Zhang, Y. Bai, H. Xiao, S. Tian, H. Xie, G. Yang, N. Tsubaki, Y. Han and Y. Tan, Appl. Catal., A, 2016, 514, 14–23 CrossRef CAS.
- P. Wang, Y. Bai, H. Xiao, S. Tian, Z. Zhang, Y. Wu, H. Xie, G. Yang, Y. Han and Y. Tan, Catal. Commun., 2016, 75, 92–97 CrossRef CAS.
- Y. Wu, H. Xie, S. Tian, N. Tsubaki, Y. Han and Y. Tan, J. Mol. Catal. A: Chem., 2015, 396, 254–260 CrossRef CAS.
- L. Tan, G. Yang, Y. Yoneyama, Y. Kou, Y. Tan, T. Vitidsant and N. Tsubaki, Appl. Catal., A, 2015, 505, 141–149 CrossRef CAS.
- X. Chen, B. Zhang, Y. Wang and N. Yan, Chimia, 2015, 69, 120–124 CrossRef CAS PubMed.
- Y. Wang, S. De and N. Yan, Chem. Commun., 2016, 52, 6210–6224 RSC.
- X. Chen, S. L. Chew, F. M. Kerton and N. Yan, Green Chem., 2014, 16, 2204–2212 RSC.
- A. Naggar, H. Sayed, R. Elsalamony and A. Elrazak, RSC Adv., 2015, 5, 77897–77905 RSC.
- R. Burch and B. Southward, Chem. Commun., 2000, 703–704 RSC.
- M. Uddin, W. Daud and H. Abbas, RSC Adv., 2014, 4, 10467–10490 RSC.
- T. Jiang, Y. Niu and B. Zhong, Fuel Process. Technol., 2001, 73, 175–183 CrossRef CAS.
- M. Xu, M. J. L. Gines, A.-M. Hilmen, B. L. Stephens and E. Iglesia, J. Catal., 1997, 171, 130–147 CrossRef CAS.
- K. Waugh, Catal. Lett., 2012, 142, 1153–1166 CrossRef CAS.
- P. Forzatti, E. Tronconi and I. Pasquon, Catal. Rev. Sci. Eng., 1991, 33, 109–168 CAS.
- W. Keim and W. Falter, Catal. Lett., 1989, 3, 59–63 CrossRef CAS.
- K. Xiao, Z. Bao, X. Qi, X. Wang, L. Zhong, K. Fang, M. Lin and Y. Sun, Chin. J. Catal., 2013, 34, 116–129 CrossRef CAS.
- Y. Wu, H. Xie, Y. Kou, N. Tsubaki, Y. Han and Y. Tan, Korean J. Chem. Eng., 2015, 32, 406–412 CrossRef CAS.
- W. S. Epling, G. Hoflund, W. Hart and D. Minahan, J. Catal., 1997, 172, 13–23 CrossRef CAS.
- W. S. Epling, G. B. Hoflund, W. M. Hart and D. Minahan, J. Catal., 1997, 169, 438–446 CrossRef CAS.
- H. Dutta, M. Sinha, Y. C. Lee and S. K. Pradhan, Mater. Chem. Phys., 2007, 105, 31–37 CrossRef CAS.
- Z. Marinković, L. Mančić, P. Vulić and O. Milošević, J. Eur. Ceram. Soc., 2005, 25, 2081–2084 CrossRef.
- G. Perego, Catal. Today, 1998, 41, 251–259 CrossRef CAS.
- A. Venugopal, R. Sarkari, C. Anjaneyulu, V. Krishna, M. K. Kumar, N. Narender and A. H. Padmasri, Appl. Catal., A, 2014, 469, 398–409 CrossRef CAS.
- S. Hosseini, M. Alvarez-Galvan, J. Fierro, A. Niaei and D. Salari, Ceram. Int., 2013, 39, 9253–9261 CrossRef CAS.
- C. Battistoni, J. Dormann, D. Fiorani, E. Paparazzo and S. Viticoli, Solid State Commun., 1981, 39, 581–585 CrossRef CAS.
- C. Ma, H. Li, G. Lin and H. Zhang, Appl. Catal., B, 2010, 100, 245–253 CrossRef CAS.
- M. Xiang, D. Li, H. Xiao, J. Zhang, H. Qi, W. Li, B. Zhong and Y. Sun, Fuel, 2008, 87, 599–603 CrossRef CAS.
- M. Xiang, D. Li, H. Xiao, J. Zhang, W. Li, B. Zhong and Y. Sun, Catal. Today, 2008, 131, 489–495 CrossRef CAS.
- M. Xiang, D. Li, H. Qi, W. Li, B. Zhong and Y. Sun, Fuel, 2007, 86, 1298–1303 CrossRef CAS.
- M. Xu and E. Iglesia, J. Catal., 1999, 188, 125–131 CrossRef CAS.
- M. Gines and E. Iglesia, J. Catal., 1998, 176, 155–172 CrossRef CAS.
- L. Lietti, E. Tronconi and P. Forzatti, J. Catal., 1992, 135, 400–419 CrossRef CAS.
- J. Nunan, C. Bogdan, K. Klier, K. Smith, C. Young and R. Herman, J. Catal., 1989, 116, 195–221 CrossRef CAS.
- M. Bertoldi, B. Fubini, E. Giamello, G. Busca, F. Trifirò and A. Vaccari, J. Chem. Soc., Faraday Trans. 1, 1988, 84, 1405 RSC.
- G. D. Piero and A. Vaccari, J. Chem. Soc., Chem. Commun., 1984, 656–658 RSC.
- E. Giamello, B. Fubini, M. Bertoldi, G. Busca and A. Vaccari, J. Chem. Soc., Faraday Trans. 1, 1989, 85, 237 RSC.
- H. Luk, C. Mondelli, D. C. Ferré, J. A. Stewart and J. Pérez-Ramírez, Chem. Soc. Rev., 2017, 46, 1358–1426 RSC.
- S. Zaman, N. Pasupulety, A. Al-Zahrani, M. Daous, S. Al-Shahrani, H. Driss, L. Petrov and K. Smith, Appl. Catal., A, 2017, 532, 133–145 CrossRef CAS.
- S. Stewart, S. Figueroa, J. López, S. Marchetti, J. Bengoa, R. Prado and F. Requejo, Phys. Rev. B: Condens. Matter Mater. Phys., 2007, 75, 073408 CrossRef.
- S. Chen, Y. Wu, P. Cui, W. Chu, X. Chen and Z. Wu, J. Phys. Chem. C, 2013, 117, 25019–25025 CAS.
- M. Nilsen, C. Nordhei, A. Ramstad, D. G. Nicholson, M. Poliakoff and A. Cabañas, J. Phys. Chem. C, 2007, 111, 6252–6262 CAS.
- C. Nordhei, A. Ramstad and D. Nicholson, Phys. Chem. Chem. Phys., 2008, 10, 1053–1066 RSC.
- M. J. Akhtar, M. Nadeem, S. Javaid and M. Atif, J. Phys.: Condens. Matter, 2009, 21, 405303 CrossRef CAS PubMed.
- D. Makovec, A. Kodre, I. Arcon and M. Drofenik, J. Nanopart. Res., 2011, 13, 1781–1790 CrossRef CAS.
- D. Carta, C. Marras, D. Loche, G. Mountjoy, S. I. Ahmed and A. Corrias, J. Chem. Phys., 2013, 138, 054702 CrossRef CAS PubMed.
Footnote |
| † Electronic supplementary information (ESI) available: The typical catalytic performance of ZnCr-c catalyst under different reaction conditions and some XAS spectra for Zn and Cr. See DOI: 10.1039/c7ra02627g |
| This journal is © The Royal Society of Chemistry 2017 |


