
 Open Access Article
 This Open Access Article is licensed under a
 Creative Commons Attribution 3.0 Unported Licence
Identification and quantification of immunoglobulin G (G1, G2, G3 and G4) in human blood plasma by high-resolution quadrupole-Orbitrap mass spectrometry
Zhu Huang*ab and
Xiao-Dong Pan *c
*c
aDepartment of Ophthalmology, The First Affiliated Hospital, College of Medicine, Zhejiang University, Hangzhou, China. E-mail: zhuzhu2003@126.com; Tel: +86 571 87115274
bDepartment of Ophthalmology, The Forth Affiliated Hospital, College of Medicine, Zhejiang University, Yiwu, China
cZhejiang Provincial Center for Disease Control and Prevention, Hangzhou, China. E-mail: zjupanxiaodong@hotmail.com; Tel: +86 571 87115274
First published on 6th April 2017
Abstract
We described a method for quantification of IgG (IgG1, IgG2, IgG3 and IgG4) in a small amount of human blood plasma using high-resolution quadrupole-Orbitrap mass spectrometry (HR-Q-Orbitrap-MS). For screening surrogate peptides of targeted IgGs, samples were prepared by pellet digestion and identified by data-independent acquisition of Orbitrap MS. The quantification was performed by parallel reaction monitoring (PRM). The remarkable sensitivity and selectivity of PRM enable the detection of low abundance IgGs, or a little plasma. The assay linearity for external standard IgG proteins was obtained from 5 to 1000 μg L−1 with a mean coefficient of determination (R2) higher than 0.99. The inter-day (n = 6) and intra-day (n = 6) precisions obtained were from 3.6% to 11.5%. This report represents a comprehensive study so far of the use of Q-Orbitrap-MS for the identification and quantitation of IgGs in human blood plasma.
Introduction
Profiling of immunoglobulins with modern instruments such as liquid chromatography (LC) and mass spectrometry (MS) is of great interest to researchers.1 The antibody repertoire has the potential to hold a library detailing an individual's antigen exposure history, which may reveal key information about individual's immune system. In the clinical lab, monitoring of Ig antigen specificity has brought to light immunoglobulin biomarkers for evaluation on immunity, autoimmunity and cancer detection.2–5Conventional methods for detecting clinically significant Igs are based on antigen specificity. Enzyme-linked immunosorbent assay (ELISA) and cell/tissue-based immunofluorescence (IF) have been the main methods for detecting Ig biomarkers.1 The basic principle of these methods is the detection of Ig–antigen complexes formed by the interaction of a patient's serum with a known antigen.
One new approach with LC-MS/MS to the detection of specific antibodies has begun to emerge in the literature.1,6–8 Unlike the current approaches based on Ig–antigen interaction, it seeks to further probe fundamental structure information of the Ig protein. The most commonly LC-MS/MS method is to digest the targeted protein in samples and screen one or more peptides with good selectivity and sensitivity as surrogate analyte of the protein. The majority of quantitative assays were achieved by LC systems hyphenated to triple quadrupole (QqQ) mass analyzers operating in mode of selected reaction monitoring (SRM).9,10 For example, Hong et al.11 and Ladwig et al.12 demonstrated that IgG glycoforms can also be quantified with subclass-specific proteotypic peptides by use of LC-MS/MS. However, interferences in mass response from other generated tryptic peptides in complex matrices (serum or plasma) at the retention time of the surrogate peptide(s) of interest may not be excluded, even though appropriate sample cleanup strategies such as solid phase extraction (SPE) can reduce the sample complexity.13
To improve the method selectivity for quantitative analysis, application of high resolution mass spectrometry (HRMS) such as quadrupole time of flight (QTOF), Orbitrap or Fourier transform ion cyclotron resonance mass analyzer is a promising way.14–16 On contrast to three-quadrupole MS (TQ-MS), one of the main advantages of HRMS is the high mass accuracy less than 5.0 ppm as well as the highly resolved isotopic pattern with a resolution (>25![[thin space (1/6-em)]](https://www.rsc.org/images/entities/char_2009.gif) 000).
000).
Recently, the use of HRMS for the quantification of small molecules and larger peptides in human plasma was successfully demonstrated.17–19 Sun et al.20 demonstrated that Q-Exactive is proper for proteomic analysis in terms of obtained peptide and protein group. Mekhssian et al.21 reported a method for antibody quantification by a LC system coupled to a TripleTOF™ 5600 mass spectrometry.
The present study aims to explore the capabilities of UPLC-Q-Orbitrap-MS (Q-Exactive) for the identification and quantification of immunoglobulin G (IgG1, G2, G3 and G4) in human blood plasma. The development of a UPLC-Q-Orbitrap-MS method for the quantification of IgGs in plasma is described using pellet digestion as sample preparation combined with data-dependent acquisition for surrogate peptides detection and PRM.
Materials and methods
Chemicals
Acetonitrile, methanol, formic and acetic acid were all purchased from Merck (Darmstadt, Germany). Sodium acetate, magnesium sulphate and ammonium formate were purchased from Sigma-Aldrich. Standard IgG (1–4) from human plasma (purified immunoglobulin, >95%) were purchased from Sigma. For the calibration of the MS, the Pierce LTQ Velos ESI positive-ion calibration solutions (Thermo Fisher Scientific, Waltham, MA, USA) were used.Chromatographic & MS conditions
A Vanquish UHPLC system consisting of a quaternary pump, an autosampler and a column oven was used in this test (all Thermo Scientific, San Jose, CA, USA). Chromatographic separation was performed on a 2.1 × 50 mm, 1.7 μm, BEH300 C18 column (Waters Corporation, MA, USA) with a 0.5 μm frit. The column temperature was set at 60 °C. Mobile phase A consisted of 0.1% formic acid in water, and mobile phase B consisted of 0.1% formic acid in acetonitrile. Samples were separated by gradient elution using the following program: 0 min 3% B; 0–0.8 min 3% B; 0.8–5 min 60% B; 5–6 min 100% B; 6–7 min 100% B; 8–10 min 3% B. The flow rate was 0.3 ml min−1. The sample injection volume was 5 μL.The UPLC system was coupled to a Q-Orbitrap-MS equipped with a heated electrospray ionization probe (HESI II) operating in positive mode (Thermo Fisher Scientific). Nitrogen was used for spray stabilization, for collision-induced dissociation experiments in the higher energy collision dissociation (HCD) cell, and as the damping gas in the C-trap. The following ionization parameters were applied: electrospray voltage 3.0 kV for positive mode, capillary temperature 350 °C, vaporizer temperature 250 °C, sheath gas (N2) 40 arbitrary units (arb), auxiliary gas (N2) 15 (arb), and S-Lens RF level at 50 (arb). The instrument was calibrated in positive mode every 7 days using the Pierce LTQ Velos ESI positive-ion calibration solutions from manufacturer (containing caffeine, the tetrapeptide MRFA and a mixture of fluorinated phosphazines ultramark 1621).
Two different scan modes, full MS/dd-MS2 for peptide identification and PRM for quantification, were performed in this study. For a full MS scan, the selected scan range was from m/z 100 to 1500 and the resolution was 35000 (FWHM at m/z 200), while the automatic gain control (AGC) target (the number of ions to fill C-Trap) was set to 1.0 × 10⁶ with a maximum injection time (IT) of 100 ms. For the dd-MS2 scan, the fragmentation mass spectra were recorded at a mass resolving power of 17500 FWHM with a quadrupole isolation window of 0.4 Da for precursor ions. Other MS parameters for the dd-MS2 scan were applied as follows: AGC target 2.0 × 10⁵, maximum IT 50 ms, underfill ratio 1.0%, intensity threshold 4.0 × 10⁴, exclude isotopes ‘on’, and dynamic exclusion 10.0 s. For PRM scan, the parameters were: default charge 2, inclusion on, MS2 resolution 17500, maximum IT 100 ms, AGC target 2.0 × 10⁵, isolation window 4.0 m/z, and NCE/stepped 20, 35, 55. The accurate masses for the precursor are shown in Table 1.
| Protein | Peptide | Abbr. | Mass to charge ratio (m/z) | Retention time (min) | Xcorr | |
|---|---|---|---|---|---|---|
| Precursor (charge state) | Fragment ions (ion type/charge state) | |||||
| a Note: Xcorr means the score of the cross correlation with the theoretical spectrum. | ||||||
| IgG1 | FNWYVDGVEVHNAK | FNW | 839.4010 (2+) | 968.4796(y91+); 1230.6113(y111+); 568.3202(y51+) | 3.91 | 3.60 |
| GPSVFPLAPSSK | GPS | 593.8255 (2+) | 418.2296(y41+); 846.4720(y81+) | 3.94 | 2.77 | |
| TTPPVLDSDGSFFLYSK | TTP | 937.4616 (2+) | 836.4169(y152+); 234.1448(y21+) | 4.27 | 2.72 | |
| IgG2 | GLPAPIEK | GLP | 824.4838 (1+) | 486.2907(y41+); 54.3806(y61+); 276.1550(y21+) | 3.44 | 2.39 |
| TTPPMLDSDGSFFLYSK | TTPm | 953.4506 (1+) | 852.4029(y152+); 397.2082(y31+); 234.1448(y21+) | 4.44 | 3.00 | |
| IgG3 | WYVDGVEVHNAK | WYV | 708.8475 (2+) | 1067.5394(y101+); 968.4727(y91+); 853.4462(y81+) | 3.58 | 3.46 |
| TPLGDTTHTCPR | TPL | 452.5507 (3+) | 579.2720(y102+); 670.3090(y51+) | 2.98 | 3.69 | |
| SCDTPPPCPR | SCD | 593.7519 (2+) | 723.3666(y61+); 626.3079(y51+); 362.1840(y62+) | 2.84 | 2.87 | |
| IgG4 | GLPSSIEK | GLPs | 830.4595 (1+) | 660.3563(y61+); 276.1554(y21+); 476.2715(y41+) | 3.28 | 2.46 |
| TYTCNVDHKPSNTK | TYT | 416.9476 (4+) | 273.6477(y52+); 546.2882(y51+); 406.2247(y72+) | 2.67 | 4.15 | |
| Generic | DTLMISR | DTL | 418.2208 (2+) | 506.2755(y41+); 375.2350(y31+); 619.3596(y51+) | 3.51 | 2.30 |
| NQVSLTCLVK | NQV | 581.3187 (2+) | 820.4597(y71+); 919.5287(y81+); 733.4277(y61+) | 3.86 | 3.63 | |
Sample preparation
All experiments on the human blood were approved by Human Research Ethics Committee of the First Affiliated Hospital, College of Medicine, Zhejiang University and performed in accordance with the relevant guidelines. We confirmed that informed consent was obtained from all subjects for usage of human blood. Human plasma samples were collected from author of Xiao-Dong Pan. Plasma samples (25 μL) were transferred to Eppendorf tube prior to sample preparation. Methanol (75 μL) was added, and followed by vortex mixing at 1000 × g for 1 min. After centrifuge at 4000 × g for 5 min at 5 °C, the supernatants were carefully discarded. Pellets were re-suspended by addition of 100 μL NH4HCO3 (500 mM) and 720 μL deionized water followed by vortexing at 2000 × g for 10 min. A 20 μL aliquot of 50 mM DTT solution were added to the mixtures and reduced in 40 °C air bath for 30 min at this stage. In the next step, an alkylation was performed by adding 20 μL of 150 mM IAA in the dark for 30 min at room temperature. Pellet digestion was carried out by addition of 100 μL of 500 mM NH4HCO3 and 25 μL of 1 mg mL−1 trypsin (freshly prepared) were added and incubated 6 h at 37 °C. The reaction was terminated by addition of 5 μL formic acid. Prior to injection onto the UPLC-Q-Orbitrap-MS system, the digested sample plates were centrifuged at 6000 × g for 5 min at 5 °C to remove pellet particulates.UPLC-Q-Orbitrap-MS data acquisition, processing & sample quantification
The system was controlled using the software packages Xcalibur 3.0, Chromeleon MS Link 2.14 and Q-Exactive Tune 2.3 (all Thermo Scientific). Xcalibur software was used for data acquisition and processing. For identification analytical runs, full MS/dd-MS2 scan was adopted. The obtained data were treated by the software of Proteome Discoverer™ 2.1 (Thermo Fisher Scientific, Waltham, MA, USA) for peptide confirmation and screening. For quantitative analytical runs, PRM scan were performed with the precursor and fragment ions. The calibration curve was performed using peak area of standard proteins with different concentrations. Duplicate 6 point calibration standards, placed at the beginning and end of each analytical run, were fitted to linear regression model. The equation of this curve was then used to calculate the predicted concentrations in all study samples within the analytical runs.Results and discussion
We developed a method for the absolute quantitation of immunoglobulin G (G1–4) in human plasma using Q-Orbitrap-MS with PRM. The workflow of the method is depicted in Fig. 1. Human IgG standards were used for absolute quantification by external calibration method. Before quantification test, IgG standards were tryptic digested and analyzed by full scan/dd-MS2 mode of Q-Orbitrap MS for obtaining the surrogate peptides and fragment ions. These peptides and their fragments were carefully screened based on the criteria of selectivity, stability and sensitivity. Selected signal peptides and their fragments were used for PRM quantification analysis. Surrogate peptides for targeted IgGs were obtained by pellet digestion which might reduce the matrix effect of mass response.22,23 The method was further validated for the specificity, sensitivity, accuracy and precision.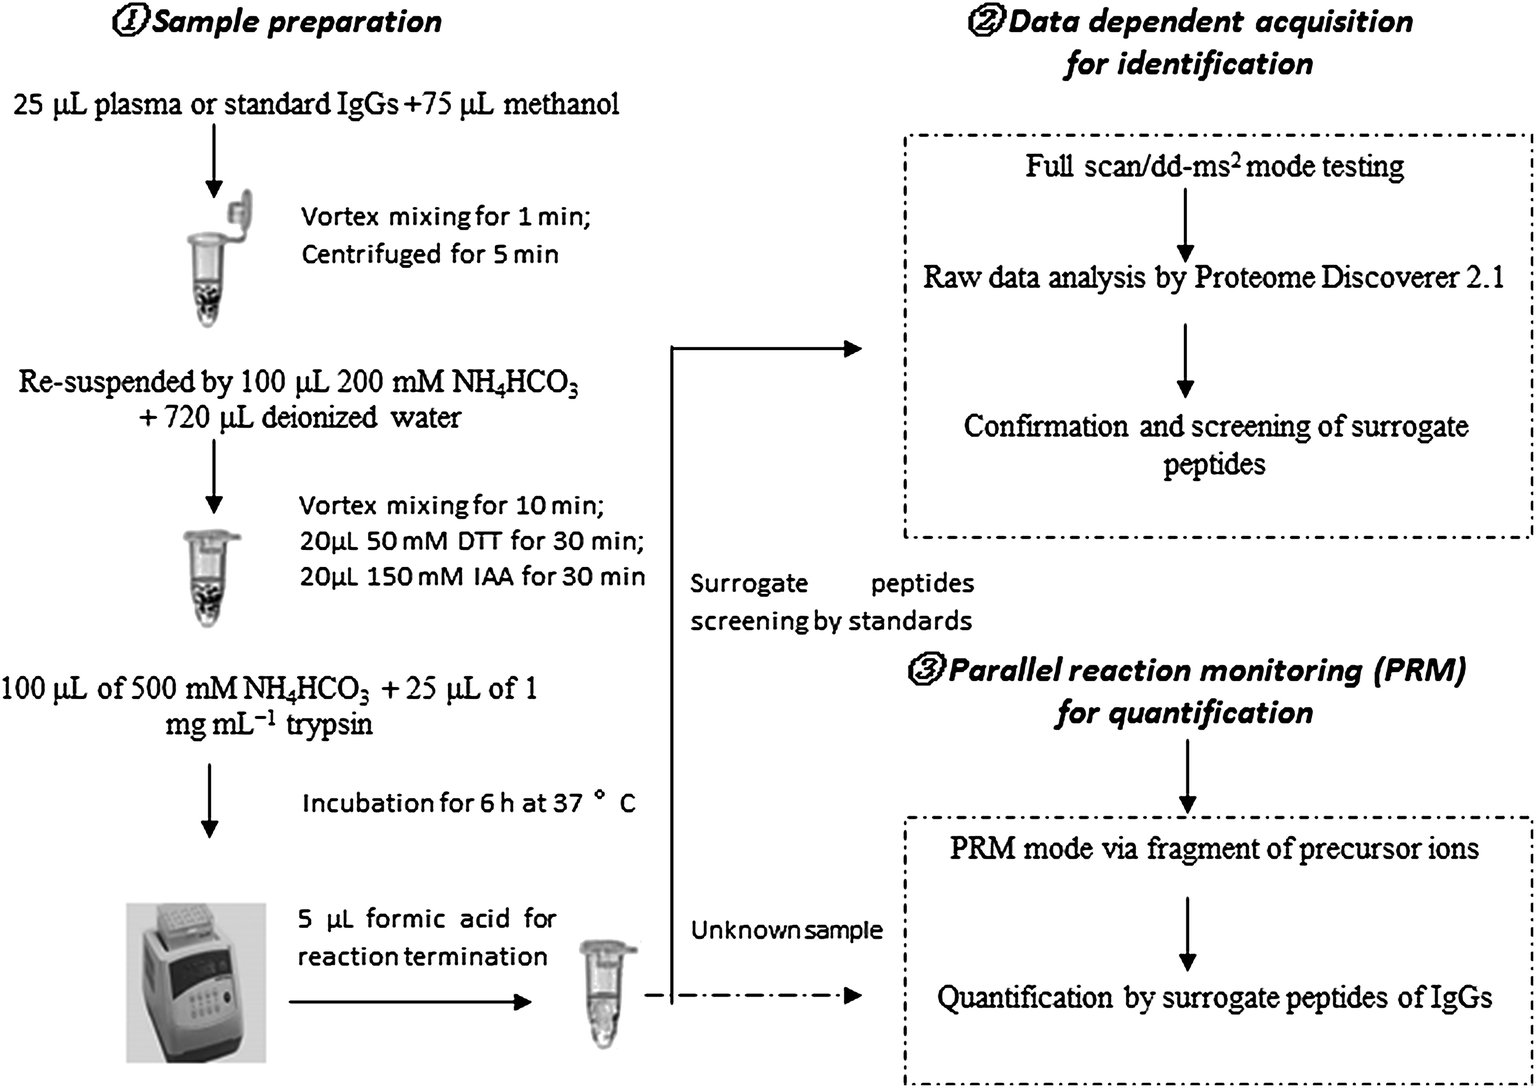 | ||
| Fig. 1 The workflow of IgGs identification and quantification by HR-Q-Orbitrap-MS. | ||
Identification of signature peptides by full scan/dd-MS2 analysis
Besides the light and heavy chain, the structure of antibodies can be further subdivided into variable and constant regions. The latter is only suitable for a universal MS-based assay in pre-clinical species as the majority of the amino acid sequence is conserved over all human antibodies exhibiting common peptides after tryptic digestion, whereas the former contains antibody specific peptides located in the complementarity determining region being responsible for specific target binding. For the identification of conserved peptides, the amino acid sequences of the Fc region from IgG were aligned with each other and an in silico digestion was performed. Furthermore, the mixed IgG standards were tryptic digested and tested by mode of full scan/dd-MS2 which is data-dependent acquisition based on HCD (Fig. 2).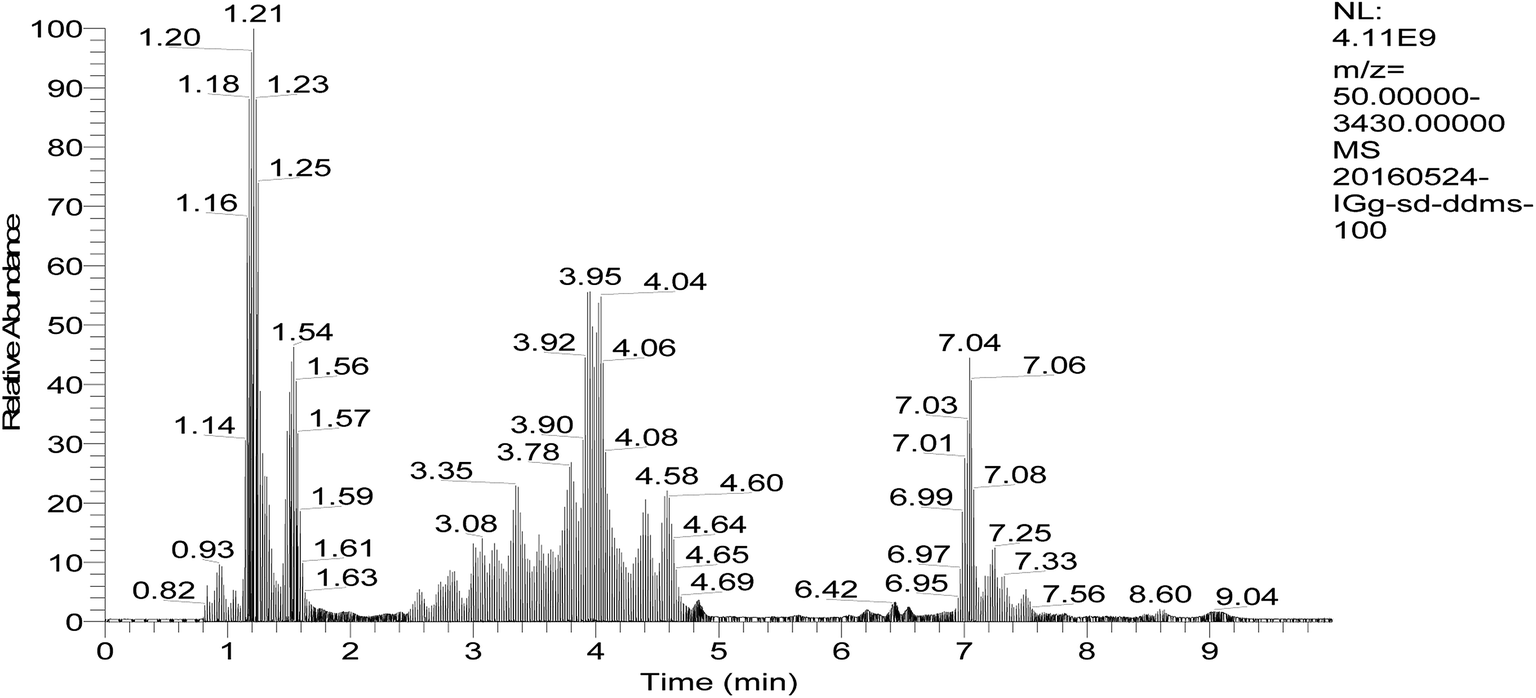 | ||
| Fig. 2 Chromatograms of peptides in blood plasma by data-dependent acquisition of UPLC-Q-Orbitrap-MS (full scan/dd-MS2). | ||
Raw data were then processed through the commercial software Proteome Discoverer™ 2.1 and protein assignment was accomplished via Sequest scoring algorithm by searching Q-Orbitrap-MS against human immunoglobulin database (downloaded from http://www.uniprot.org/ on Jan. 10, 2016). The number and sequence of the identified peptides were retrieved for each allergenic protein family by interrogating the data bank at a high confidence and a false discovery rate (FDR) set at 0.01 (indicating a measure of certainty in the identification). According to the criteria that signature peptides are unique to the target protein and detectable by the MS systems of choice, a summary of detected targeted peptides is schematized in Table 1. The MS/MS product ion spectra of identified surrogate peptides are shown in Fig. 3. Furthermore, peptides showing Q-Orbitrap-MS spectra highly matching with the predicted fragmentation patterns and displaying the highest Xcorr were further analysed by the analyst by visual inspection of the generated spectra in order to select those showing the highest intensity and reproducibility in the same state charge (variance ≤ 15%) and the best chromatographic resolution from matrix interferences.
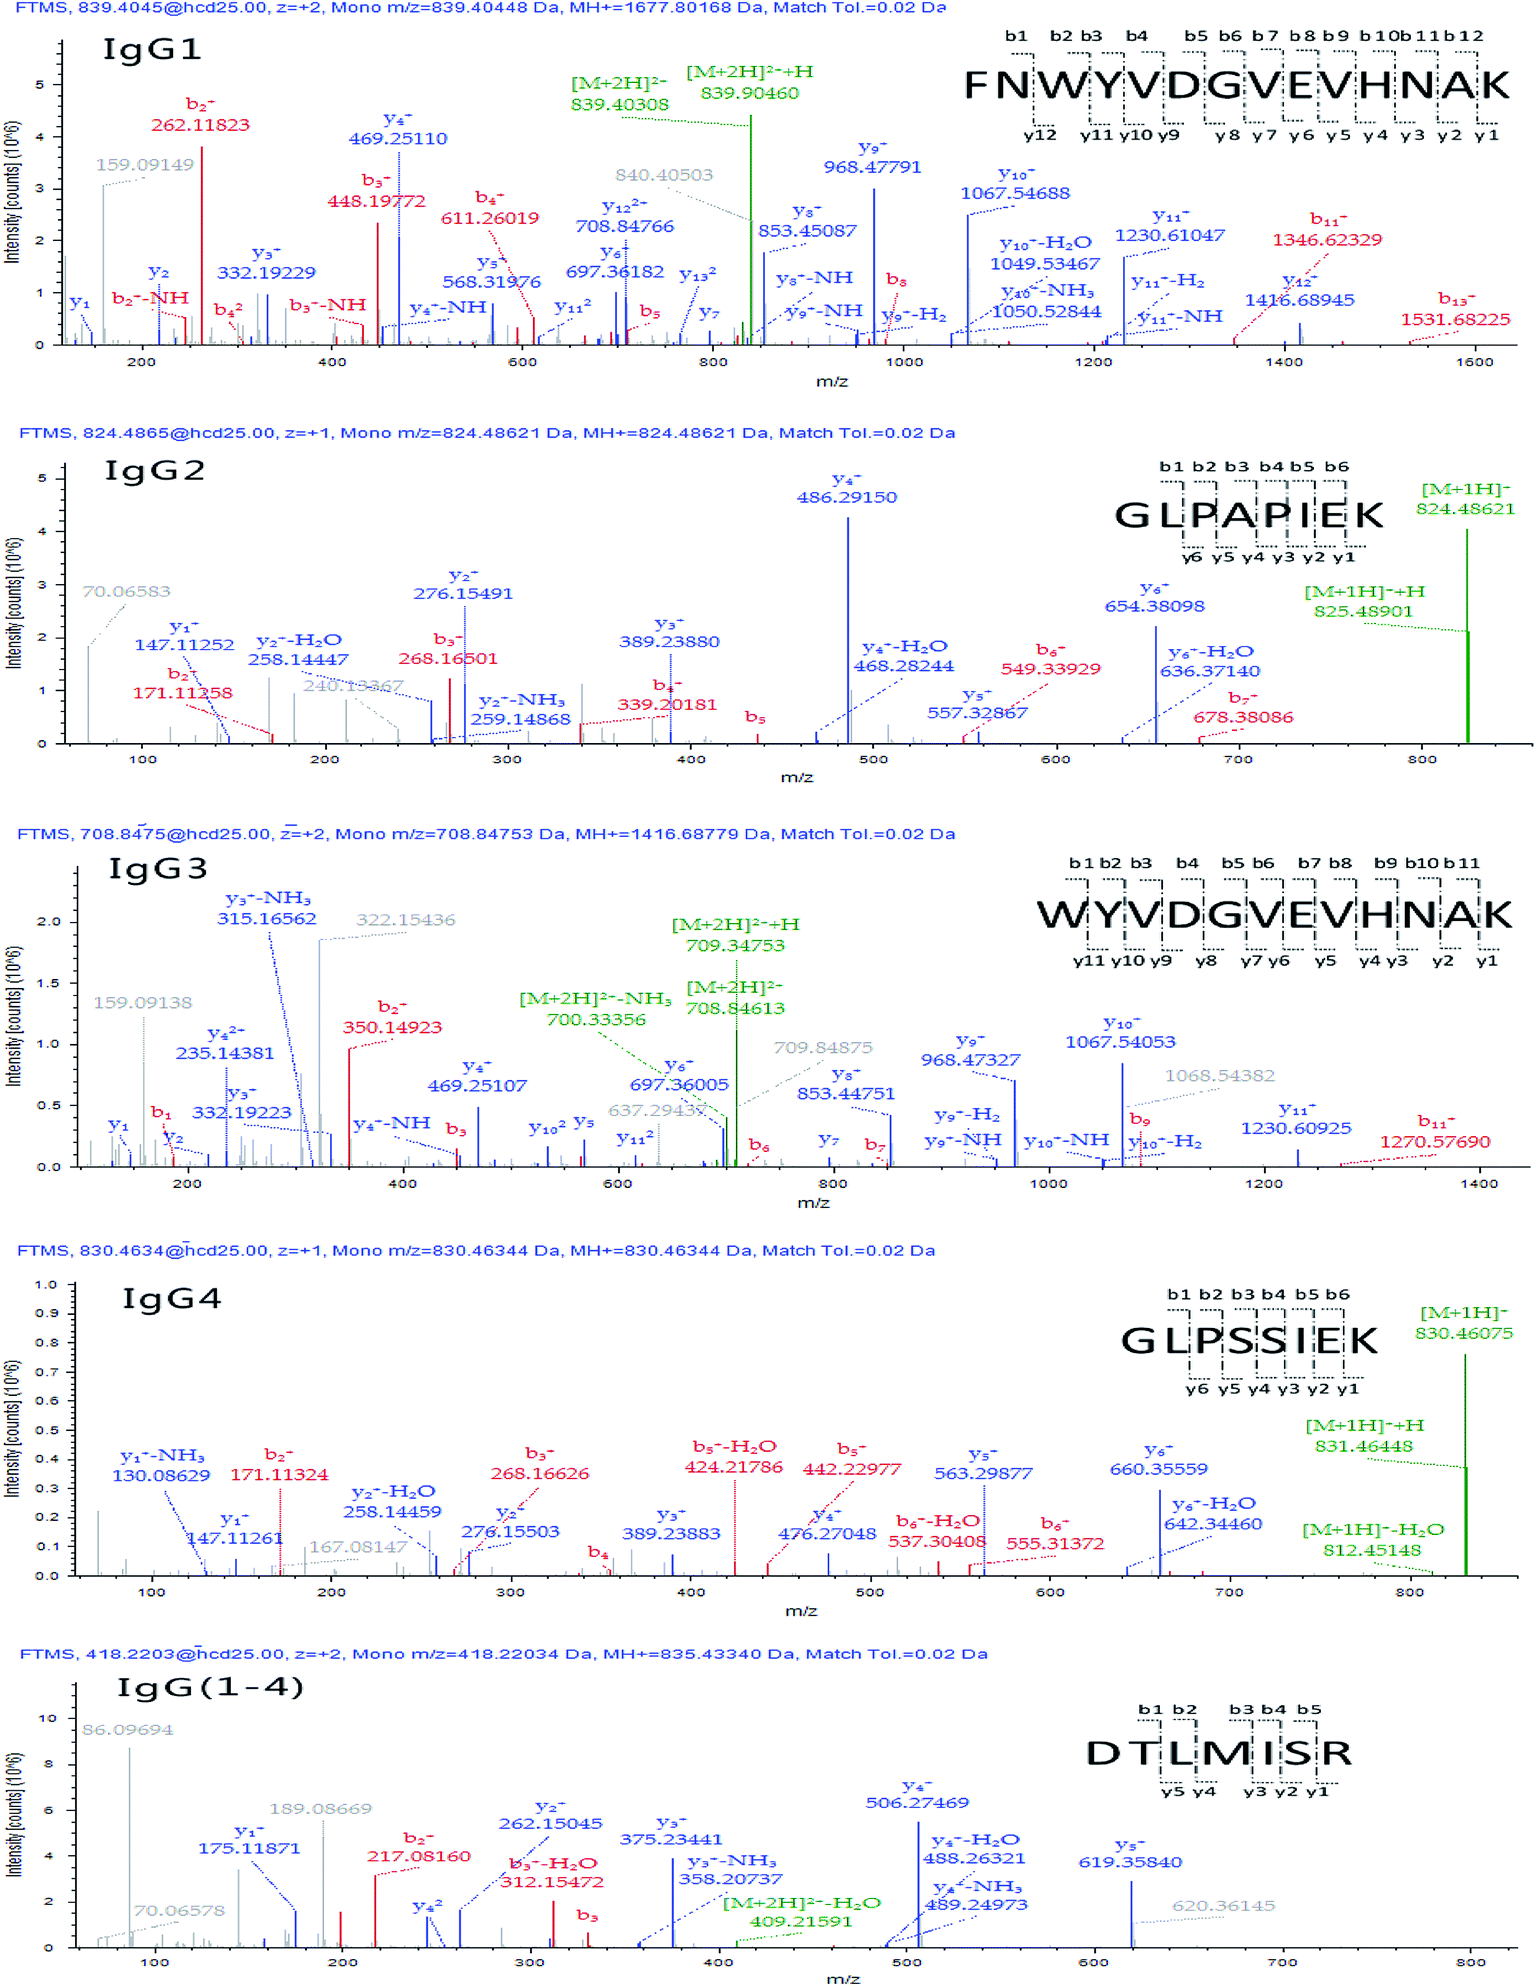 | ||
| Fig. 3 MS/MS product ion spectra of surrogate peptides for IgGs. | ||
Screening of surrogate peptides
The criteria followed for peptide markers detection were: (1) reproducibility of the retention time ≤ 0.1 min, (2) mass accuracy better than ≤5 ppm, (3) at least two fragment ions detected in the high resolution MS, and (4) relatively high intense of mass response. So, the targeted peptides were screened and listed (Table 1), and those peptides with low mass accuracy and mass intensity were not chosen.Furthermore, prepared samples (spiked with standard IgGs) were analyzed again after 20 days storage at −20, −4, 10, and 37 °C separately for peptide stability test. As shown in Fig. 4, there were no obvious changes in percentage of intensity to original after 20 days storage at −20 °C. With the raising of temperature, the intensities of selected peptides were decreased. According to these changes, we adopt FNW for IgG1, GLP for IgG2, WYV for IgG3, GLP for IgG4 and DTL as general surrogate peptide for all IgGs. The data of peptide stability indicated that the storage of digested samples for Q-Orbitrap-MS analysis should be kept at as low temperature as possible.
 | ||
| Fig. 4 The stability of selected peptides from IgGs during the storage with different temperatures. | ||
IgG quantitation using PRM
From the fragmentation patterns obtained from full scan/dd-MS2 analysis, PRM transitions were developed for the peptides. The common or general surrogate peptide to all four types and selected for quantitation is DTLMISR. Its PRM transition from precursor ion ([M + 2H]2+ m/z 418.22) to fragment ion m/z 506.28 and m/z 375.23 was selected as the quantifier. The optimized fragmentation voltage was determined to be 9 eV for the quantifier. For other surrogated peptides, the following transitions were determined to be optimal: ([M + 2H]2+ 839.40 → m/z 968.48 and m/z 1230.61) for IgG1, ([M + 3H]3+ 824.48 → m/z 486.29 and m/z 54.38) for IgG2, and ([M + 3H]3+ 708.85 → m/z 1067.54 and m/z 968.47) for IgG3, ([M + 3H]3+ 830.46 → m/z 660.36 and m/z 276.16) for IgG4. The PRM transitions for all peptides, together with their respective fragmentation voltages are listed in Table 1. Previous study also reported that generic peptide of DTLMISR can be used for IgG quantification by LC-QTOF-MS with multiple reaction monitoring (MRM).11The PRM technique has several potential advantages over MRM or SRM approach.24,25 First, PRM spectra would be highly specific because all potential product ions of a peptide, instead of just 3–5 transitions, are available to confirm the identity of the peptide.26,27 Second, PRM could provide a higher tolerance for co-isolated background peptides/species. Because numerous ions would be available for identification and quantitation purposes, the presence of interfering ions in a full mass spectrum would be less disruptive to overall spectral quality than interference in a narrow mass range, especially because high resolution can often separate these ions from the product of interest.28
Method validation
| Protein | Abbr. | Sequence | Linear regression equation (R2) | LOD | Intraday | Interday | ||
|---|---|---|---|---|---|---|---|---|
| R | RSD | R | RSD | |||||
| a Note: interday n = 6; intraday n = 6; R, recovery (%); RSD, relative standard deviation (%). | ||||||||
| IgG1 | FNW | FNWYVDGVEVHNAK | Y = −15668.2 + 8049.32X (0.9937) |
2.5 | 89 | 4.5 | 94 | 7.5 |
| IgG2 | GLP | GLPAPIEK | Y = −17492.9 + 4386.31X (0.9958) |
3.4 | 94 | 5.3 | 88 | 8.1 |
| IgG3 | WYV | WYVDGVEVHNAK | Y = −45234.4 + 10717.8X (0.9987) |
1.2 | 90 | 3.6 | 90 | 5.4 |
| IgG4 | GLPs | GLPSSIEK | Y = −34169.4 + 3310.51X (0.9974) |
4.0 | 92 | 4.1 | 92 | 5.9 |
| Generic | DTL | DTLMISR | Y = 8283.65 + 20761.9X (0.9925) |
0.4 | 86 | 6.8 | 85 | 11.5 |
Conclusion
We conducted a systematic evaluation of UPLC-Q-Orbitrap-MS for the identification and quantification of immunoglobulin G (G1, G2, G3 and G4), one of the most abundant proteins in human blood plasma. It is observed that PRM is a powerful technique for the absolute quantitation of immunoglobulin G. The selectivity of high resolution mass spectrometry reduces the interference of sample matrix. The sensitivity of the PRM method allows detection of IgG at the μg L−1 level. The method facilitates simultaneous determination of IgG1, IgG2, IgG3 and IgG4 protein with small amount of blood plasma (at least 25 μL).Author contributions statement
X.-D. P. and Z. Huang conceived the experiment(s), X.-D. P., Z. H. conducted the experiment(s), X.-D. P. and Z. H. analyzed the results. All authors reviewed the manuscript.Conflicts of interest
The authors declare no competing financial interests.Acknowledgements
The authors are thankful to Y. R. Jiang, X. Ke, J. S. Zhang and Z. X. Cai for the help on the experiment.References
- D. Murray and D. Barnidge, Crit. Rev. Clin. Lab. Sci., 2013, 50, 91–102 CrossRef CAS PubMed.
- K. Conrad, D. Roggenbuck, D. Reinhold and U. Sack, Autoimmun. Rev., 2012, 11, 207–211 CrossRef CAS PubMed.
- P. V. Belousov, D. V. Kuprash, S. A. Nedospasov and Y. V. Shebzukhov, Curr. Mol. Med., 2010, 10, 115–122 CrossRef CAS PubMed.
- E. R. Stiehm, J. Immunotoxicol., 2008, 5, 227–234 CrossRef PubMed.
- G. A. Maguire, D. S. Kumararatne and H. J. Joyce, Ann. Clin. Biochem., 2002, 39, 374–377 CrossRef CAS PubMed.
- I. Trbojevic-Akmacic, M. Vilaj and G. Lauc, Expert Rev. Proteomics, 2016, 13, 523–534 CrossRef CAS PubMed.
- C. Lanshoeft, T. Wolf, O. Heudi, S. Cianferani, S. Barteau, M. Walles, F. Picard and O. Kretz, Anal. Bioanal. Chem., 2016, 408, 1687–1699 CrossRef CAS PubMed.
- N. Kawaguchi-Sakita, K. Kaneshiro-Nakagawa, M. Kawashima, M. Sugimoto, M. Tokiwa, E. Suzuki, S. Kajihara, Y. Fujita, S. Iwamoto, K. Tanaka and M. Toi, Biochem. Biophys. Res. Commun., 2016, 469, 1140–1145 CrossRef CAS PubMed.
- S. Gallien, E. Duriez and B. Domon, J. Mass Spectrom., 2011, 46, 298–312 CrossRef CAS PubMed.
- D. Lebert, G. Picard, C. Beau-Larvor, L. Troncy, C. Lacheny, B. Maynadier, W. Low, N. Mouz, V. Brun, C. Klinguer-Hamour, M. Jaquinod and A. Beck, Bioanalysis, 2015, 7, 1237–1251 CrossRef CAS PubMed.
- Q. Hong, C. B. Lebrilla, S. Miyamoto and L. R. Ruhaak, Anal. Chem., 2013, 85, 8585–8593 CrossRef CAS PubMed.
- P. M. Ladwig, D. R. Barnidge, M. R. Snyder, J. A. Katzmann and D. L. Murray, Clin. Chem., 2014, 60, 1080–1088 CAS.
- Q. Zhang, D. S. Spellman, Y. L. Song, B. Choi, N. G. Hatcher, D. Tomazela, M. Beaumont, M. Tabrizifard, D. Prabhavalkar, W. Seghezzi, J. Harrelson and K. P. Bateman, Anal. Chem., 2014, 86, 8776–8784 CrossRef CAS PubMed.
- S. Gallien and B. Domon, Expert Rev. Proteomics, 2015, 12, 489–498 CrossRef CAS PubMed.
- S. Gallien and B. Domon, Methods, 2015, 81, 15–23 CrossRef CAS PubMed.
- S. Gallien, E. Duriez, K. Demeure and B. Domon, J. Proteomics, 2013, 81, 148–158 CrossRef CAS PubMed.
- L. Dillen, W. Cools, L. Vereyken, W. Lorreyne, T. Huybrechts, R. de Vries, H. Ghobarah and F. Cuyckens, Bioanalysis, 2012, 4, 565–579 CrossRef CAS PubMed.
- L. P. Morin, J. N. Mess and F. Garofolo, Bioanalysis, 2013, 5, 1181–1193 CrossRef CAS PubMed.
- S. Ramagiri and F. Garofolo, Bioanalysis, 2012, 4, 529–540 CrossRef CAS PubMed.
- L. Sun, G. Zhu and N. J. Dovichi, Rapid Commun. Mass Spectrom., 2013, 27, 157–162 CrossRef CAS PubMed.
- K. Mekhssian, J. N. Mess and F. Garofolo, Bioanalysis, 2014, 6, 1767–1779 CrossRef CAS PubMed.
- Z. Ouyang, M. T. Furlong, S. Wu, B. Sleczka, J. Tamura, H. Q. Wang, S. Suchard, A. Suns, T. Olah, A. Tymiak and M. Jemal, Bioanalysis, 2012, 4, 17–28 CrossRef CAS PubMed.
- C. Lanshoeft, O. Heudi and S. Cianferani, Anal. Biochem., 2016, 501, 23–25 CrossRef CAS PubMed.
- N. Rauniyar, Int. J. Mol. Sci., 2015, 16, 28566–28581 CrossRef CAS PubMed.
- A. Bourmaud, S. Gallien and B. Domon, Proteomics, 2016, 16, 2146–2159 CrossRef CAS PubMed.
- J. Sherman, M. J. McKay, K. Ashman and M. P. Molloy, Proteomics, 2009, 9, 1120–1123 CrossRef CAS PubMed.
- M. W. Duncan, A. L. Yergey and S. D. Patterson, Proteomics, 2009, 9, 1124–1127 CrossRef CAS PubMed.
- A. C. Peterson, J. D. Russell, D. J. Bailey, M. S. Westphall and J. J. Coon, Mol. Cell. Proteomics, 2012, 11, 1475–1488 Search PubMed.
| This journal is © The Royal Society of Chemistry 2017 |