 Open Access Article
Creative Commons Attribution 3.0 Unported Licence
A comparative degradation study of commercial lithium-ion cells under low-temperature cycling
Yakun Zhang a,
Hao Gea,
Jun Huanga,
Zhe Li*ab and
Jianbo Zhang*ab
aState Key Laboratory of Automotive Safety and Energy, Tsinghua University, Beijing 100084, China. E-mail: zhe_li@tsinghua.edu.cn; jbzhang@tsinghua.edu.cn
bBeijing Co-innovation Center for Electric Vehicles, Beijing Institute of Technology, Beijing 100081, China
First published on 26th April 2017
Abstract
Severe deterioration of lithium-ion cells at low temperatures constitutes one of the bottlenecks for the wide adoption of electric vehicles. Notwithstanding the remarkable progress in fundamental understanding, a knowledge gap remains in how the low-temperature aging depends on the material chemistry, the application orientation that is mainly dictated by electrode structure, and the cell format. In this contribution, four types of lithium-ion cells that are different in application orientation (power or energy), cathode chemistry (LiNixMnyCo1−x−yO2 or LiNixCoyAl1−x−yO2), and cell format (18![[thin space (1/6-em)]](https://www.rsc.org/images/entities/char_2009.gif) 650 cell or pouch cell) are subjected to low-temperature cycling tests. The aging phenomena and mechanisms during low-temperature cycling are systematically analyzed using electrochemical methods. Cell resistance increases more remarkably for energy-type cells, while cell capacity decreases more quickly for power-type cells during low-temperature cycling. Different material chemistries lead to different limiting processes during low-temperature cycling. Generated heat dissipates much more easily for pouch cells than for 18
650 cell or pouch cell) are subjected to low-temperature cycling tests. The aging phenomena and mechanisms during low-temperature cycling are systematically analyzed using electrochemical methods. Cell resistance increases more remarkably for energy-type cells, while cell capacity decreases more quickly for power-type cells during low-temperature cycling. Different material chemistries lead to different limiting processes during low-temperature cycling. Generated heat dissipates much more easily for pouch cells than for 18![[thin space (1/6-em)]](https://www.rsc.org/images/entities/char_2009.gif) 650 cells, thereby making lithium plating more serious for pouch cells during low-temperature cycling.
650 cells, thereby making lithium plating more serious for pouch cells during low-temperature cycling.
Introduction
Electric vehicles (EVs) and hybrid electric vehicles (HEVs) are penetrating into our daily lives due to the increasing concerns of energy conservation and emission reduction. Lithium-ion cells (LICs) are the leading candidate energy storage systems for these vehicles due to their advantages of high specific energy and energy density, excellent rate capability, and good cycle life.1 Despite their ostensible triumph, LICs still need to overcome a series of technical barriers to achieve a deeper market penetration of HEVs and EVs. For example, LICs should meet the requirements of safe usage and long lifetime in a wide temperature range. However, low-temperature operations impair the usability and durability of the EVs in cold regions.2Aging of LICs is an unabated topic.3,4 The quintessential aging characteristics are capacity fade and resistance soaring, which originate from a number of physico-chemical processes and convoluted interactions among cell components. Understanding the degradation behaviours and mechanisms during low-temperature cycling is critical to lifetime engineering of LICs, which has attracted recent research interest.
Lithium plating on the graphite surface is revealed to be a pressing concern during low-temperature charging5–9 and is also proven to be a major aging mechanism at low temperatures.10–13
Waldmann et al. revealed the temperature dependence of the aging mechanism in LICs. The aging rate as a function of temperature follows an Arrhenius relation in the low-temperature range of −20 to 25 °C and high-temperature range of 25–70 °C, respectively. However, the variation trend of aging rate with temperature was opposite for the low- and high-temperature ranges. In the low-temperature range, the aging rate increased with decreasing temperature, which was attributed to lithium plating at the anode by using electrochemical methods and post-mortem analysis.10 A subsequent study developed a non-destructive method, that is, differential voltage/capacity analysis, to detect lithium plating during low-temperature cycling.11 Moreover, thermal characterization of fresh and cycled cells showed that lithium plating leads to a significant increase of heat generation rate during thermal runaway and thus to a higher safety hazard.12 The effects of charging parameters on mitigating lithium plating during low-temperature charging were examined in ref. 13. These research studies are limited to a specific type of LIC. It remains unclear how the observed aging phenomena and deduced aging mechanisms depend on the cell chemistry, format and size. This is the main objective of the present study. In this study, the aging phenomena and degradation mechanisms of four kinds of automotive LICs during low-temperature cycling were investigated. The cells are different in application orientation (power or energy), cathode chemistry (LiNixMnyCo(1−x−y)O2 or LiNixCoyAl(1−x−y)O2) and cell format (18![[thin space (1/6-em)]](https://www.rsc.org/images/entities/char_2009.gif) 650 cell or pouch cell). The resistance–capacity plot was proposed as an identification tool for the lithium plating.
650 cell or pouch cell). The resistance–capacity plot was proposed as an identification tool for the lithium plating.
Experiment
Cell information
Four kinds of commercial LICs were subjected to the low-temperature degradation test. The key parameters of these four kinds of cells are shown in Table 1. The LICs are different in application orientation, material chemistry, nominal capacities and format. For convenience, the four kinds of LICs are labelled as cell A, B, C, and D, respectively. For reproducibility considerations, three samples of each kind of cell were tested. All tested cells were placed into one temperature chamber (GDJW-225, Yashilin, China) for temperature control, and the surface temperature of the cells was recorded during the experiment. The cells were charged or discharged using a Maccor Series 4000 system (Maccor Inc., USA).Experiment protocol
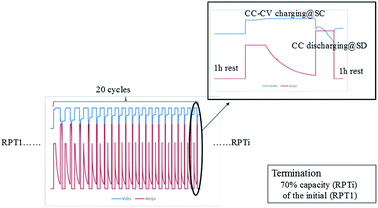
A reference performance test (RPT) test was designed during the cycling to characterize the degradation process at several designated points. Hence, the degradation experiment includes two parts, namely, the low-temperature cycling test (Fig. 1) and the RPT (Table 2). The low-temperature cycling test was conducted at −10 °C using protocols recommended by manufacturers. Constant current–constant voltage (CC–CV) charging method was used; that is, the cell was charged under constant current at SC current until the cell voltage reached the predesignated cutoff voltage, and then the cell was charged under constant voltage until the charging current fell below 1/10th of the SC current. Then, the cell was discharged under constant current at SD current. No rest period was placed between charging and discharging processes, while each charging–discharging cycle was followed by a rest period of 1 h. The low-temperature cycling test was terminated when the cell capacitance fell below 70% of the fresh capacity.| Protocol at 25 °C | Quantity |
|---|---|
| Rest for 1 h to ensure that temperature reaches equilibrium | |
| Discharge at SD current to the cutoff voltage | Residual capacity (ResCLT) |
| Rest for 1 h | |
| Charge the cell using CC–CV method | |
| Rest for 1 h | |
| Discharge at SD current to the cutoff voltage | Remaining useful capacity (RemCRT) |
| Rest for 1 h | |
| Charge the cell using CC–CV method | |
| Rest for 1 h | |
| Discharge the cell intermittently at SD current | Direct current resistance (RDC) |
RPT was conducted repeatedly every 20 low-temperature cycles. RPT consists of a capacity test and a direct-current resistance test, as shown in Table 2. Two capacity values can be derived from RPT. One is the residual capacity of the low-temperature cycling (designated as ResCLT) obtained from the first discharging process in the RPT, representing the capacity that cannot be further discharged at −10 °C but can be drawn from the cell at 25 °C. The other one is the remaining useful capacity of the cell at room temperature (RemCRT), calculated from the second discharging process in the RPT, which is used to characterize the degradation degree of the cell. The direct current resistance was calculated according to  , where V is the voltage value before discharging at a specific SOC, V′ the voltage after discharging for 60 seconds, and I the discharging current. The direct current resistance at 50% SOC was chosen as the representative resistance in subsequent analysis.
Results and discussion
Degradation
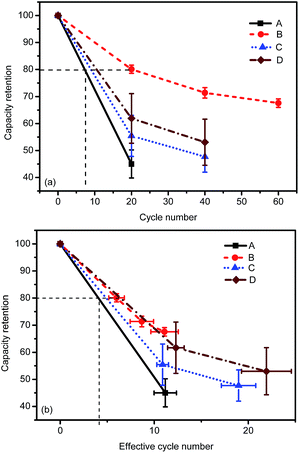
Fig. 2 shows the capacity retention calculated from the remaining useful capacity for the tested cells. The capacity values are normalized with respect to the respective initial values for comparison. Fig. 2(a) shows that the RemCRT decreases sharply in the aging process for all cells, and the degradation rate follows the order of A > C > D > B. Usually, cell lifetime is defined as the point at which the cell capacity fades to 80% of its initial value. Cell B, with NCM as cathode material, has a much longer lifetime than other cells under this low-temperature condition. This large lifetime difference among the cells is unexpected because the cells have similar chemistry, i.e. ternary material based on LiNiO2 at cathode and graphite at anode. The major cause, as discussed in SOC window section, is that the depth of discharge (DOD) for the four kinds of cells are different.To compensate for this difference, an effective cycle number considering the capacity throughput during low-temperature cycling is defined as  , where neff is the effective cycle number, n the cycle number, CLT the charging and discharging capacity (Ah-throughput) for one cycle at low temperature, and CRT the Ah-throughput for one cycle at room temperature. Since the lifetime of a cell is usually more than one thousand cycles, CRT is treated as a constant, namely, the nominal capacity given by the manufacturer, for each cell within dozens of cycles. The effective cycle number better illustrates the actual Ah-throughput of cell during cycling. Fig. 2(b) shows the RemCRT retention as a function of neff. Fig. 2(b) indicates that the cycling lifetimes of the cells at low temperature are similar on the scale of neff.
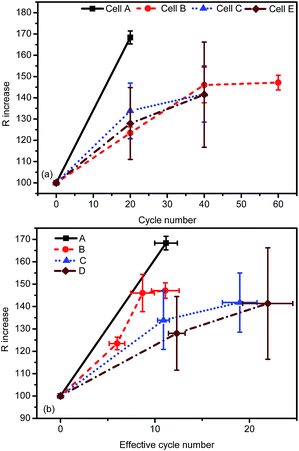
Cell resistance increases concomitantly when the cell capacity decreases during degradation. Hence, both cell resistance and cell capacity can be used to evaluate the degradation rate. Fig. 3(a) shows that the DC resistance at 50% SOC increases with the cycle number, in the same sequence as in Fig. 2(a). However, the increasing rates of DC resistance on the scale of neff are different from the capacity results in Fig. 2(b). DC resistance of energy-type cells (cell A and B) increases more significantly than that of the power-type cells (cell C and D) on the scale of neff. Besides, the cell-to-cell uniformity deteriorates with cell degradation. The error bars in Fig. 2 and 3 indicate that cell B retains the best uniformity during the low-temperature aging process.
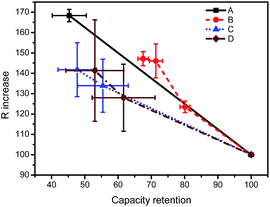
The R–Q plot, that is, DC resistance at SOC = 50% versus the RemCRT, is useful in analyzing aging mechanisms.14 Fig. 4 clearly shows that the R–Q plot falls into two regimes according to the cell type. For energy-type cells A and B, the DC resistance increases more remarkably than the capacity decrease during the degradation process. Meanwhile, for the power-type cells C and D, the capacity decrease is more intensified than the resistance increase.
Residual capacity
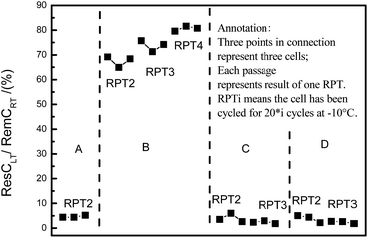
The ResCLT from RPT helps us to understand the limiting processes during low-temperature cycling. Fig. 5 shows the proportion of the ResCLT to the RemCRT, termed as the normalized ResCLT, of all cells during low-temperature cycling degradation. It can be seen in Fig. 5 that the normalized ResCLT follows a sequence: B ≫ A ≈ C ≈ D. To be specific, the normalized ResCLT of cells A, C and D is about 3%, implying that these cells could be discharged almost completely at −10 °C. The normalized ResCLT of the cell B is about 69% after 20 cycles at −10 °C and increases to 80% with increasing cycle number. This suggests that cell B can hardly be discharged completely at −10 °C. Hence, cell B, with NCA as cathode material, was cycled within a narrow SOC window due to the ‘early death’ during discharging. In other words, the limiting process for cell B under low-temperature cycling is the discharging process, not the widely accepted charging process. For the other three kinds of cells with NCM as cathode, they can be discharged almost completely at −10 °C. However, the capacity of these cells at −10 °C is much lower than at 25 °C. As a result, we conclude that the limiting process for these cells under low-temperature cycling is the charging process, as widely believed for LICs.15SOC window
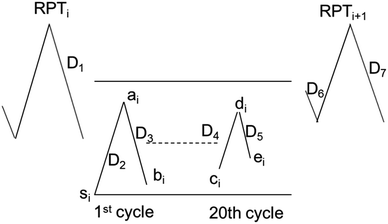
The SOC window within which the cells are cycled at −10 °C is important to understanding the degradation. Fig. 6 illustrates how to calculate the SOC window during low-temperature cycling. In the subsequent calculation, a basic approximation says that the inherent capacity, that is, the theoretical capacity that can be ideally drawn from or stored in the cell, is the same for the RPT and the first low-temperature cycle before/after the RPT. This inherent capacity is approximated by the RemCRT measured during RPT and used in the SOC calculation.The initial SOC of the 1st cycle of the low-temperature cycling test just after the RPT, si, is set as zero because the cell is completely discharged in RPT. Using si as a reference point, we calculate the SOC at the end of the 1st charging of the low-temperature cycling test, ai, according to:
 | (1) |
 | (2) |
Similarly, the SOC at the end of the discharging process of the 20th cycle can be calculated using ResCLT and RemCRT from the subsequent RPT, according to:
 | (3) |
 | (4) |
 | (5) |
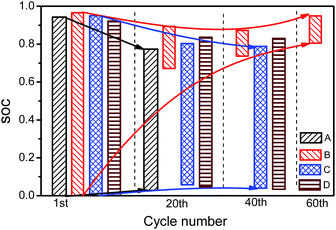
The SOC windows are shown in Fig. 7 for charging and Fig. 8 for discharging. The 18![[thin space (1/6-em)]](https://www.rsc.org/images/entities/char_2009.gif) 650 cell with NCA as cathode material (cell B) has a sharper narrowing of the SOC window, compared with cells with NCM as cathode material in package format (cell A, C and D). For the 1st charging process, the SOC windows are 0–95% for all the cells. With low-temperature cycling, the SOC at the beginning of charging increases while the SOC at the end of charging decreases, leading to narrowed SOC windows and smaller charging capacities. For cells A, C and D, the SOC at the beginning of charging increases gradually. In contrast, the SOC at the beginning of charging of cell B grows much higher than the other cells. The SOC at the end of charging of cells A, C and D decreases more significantly than that of cell B, implying that the limiting process under low-temperature cycling for cells A, C and D is charging, in which lithium plating is probably involved. In terms of the pouch cells, generated heat dissipates much more easily than the 18
650 cell with NCA as cathode material (cell B) has a sharper narrowing of the SOC window, compared with cells with NCM as cathode material in package format (cell A, C and D). For the 1st charging process, the SOC windows are 0–95% for all the cells. With low-temperature cycling, the SOC at the beginning of charging increases while the SOC at the end of charging decreases, leading to narrowed SOC windows and smaller charging capacities. For cells A, C and D, the SOC at the beginning of charging increases gradually. In contrast, the SOC at the beginning of charging of cell B grows much higher than the other cells. The SOC at the end of charging of cells A, C and D decreases more significantly than that of cell B, implying that the limiting process under low-temperature cycling for cells A, C and D is charging, in which lithium plating is probably involved. In terms of the pouch cells, generated heat dissipates much more easily than the 18![[thin space (1/6-em)]](https://www.rsc.org/images/entities/char_2009.gif) 650 cells. As a result, the temperature increase is smaller as compared with the 18
650 cells. As a result, the temperature increase is smaller as compared with the 18![[thin space (1/6-em)]](https://www.rsc.org/images/entities/char_2009.gif) 650 cells, making lithium plating more serious for pouch cells at low-temperature cycling.
650 cells, making lithium plating more serious for pouch cells at low-temperature cycling.
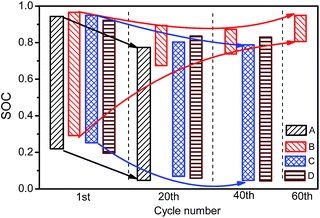
Fig. 8 shows the SOC window during the discharging process. For the 1st discharging process, the difference in SOC window among the four kinds of cells is not significant. With low-temperature cycling, the SOC at the beginning of discharging decreases. Among the four kinds of cells, cells with NCM as cathode material decrease most significantly. The SOC at the end of discharging exhibits a remarkable difference between the NCM cells (cells A, C and D) and NCA cells (cell B). For cells A, C and D, the SOC at the end of discharging decreases synchronously with the starting SOC point, resulting in a slightly changed SOC window length. For cell B, the SOC at the end of discharging rapidly increases with cycling. The SOC window is located in the high SOC region, representing markedly reduced discharge capacity, which is mainly caused by the large kinetic overpotential of cell B in 18![[thin space (1/6-em)]](https://www.rsc.org/images/entities/char_2009.gif) 650 format, Fig. 12(b).
650 format, Fig. 12(b).
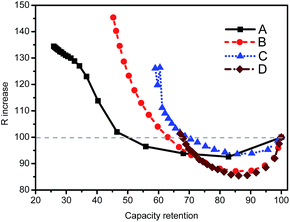
R–Q plot
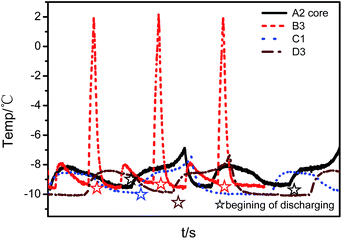
A R–Q plot is drawn for the first 20 low-temperature cycles in Fig. 9. The resistance (R) is calculated at the beginning of discharging. The discharging capacity decreases during the low-temperature cycling for all cells, but R decreases first and then increases quickly. As is well known, the R of a cell is affected by temperature, SOC and the degradation state. To clarify the reason why R decreases first, these three factors are analyzed one by one as follows.Fig. 10 shows the temperature variation curves during the first few low-temperature cycles. Cell B, with the 18![[thin space (1/6-em)]](https://www.rsc.org/images/entities/char_2009.gif) 650 format, exhibits the largest temperature variation due to the large heat generation rate as a consequence of the large overpotential and the small heat dissipation rate. For all cells, the temperature at the beginning of discharging returns to the preset value in the range between −9 °C to −10 °C. Therefore, the temperature influence on DC resistance is minor.
650 format, exhibits the largest temperature variation due to the large heat generation rate as a consequence of the large overpotential and the small heat dissipation rate. For all cells, the temperature at the beginning of discharging returns to the preset value in the range between −9 °C to −10 °C. Therefore, the temperature influence on DC resistance is minor.
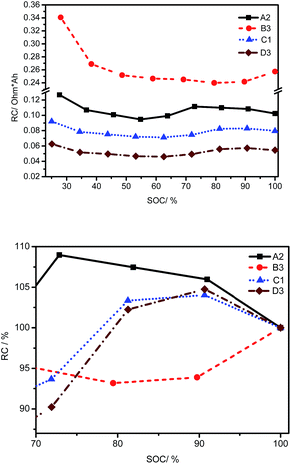
The SOC at the beginning of discharging can be known from Fig. 8, which is in the range of 77–97%, 87–96%, 78–95%, 83–93% for cells A, B, C and D, respectively. To compensate the capacity difference, a normalized resistance (Rnorm) is defined as the product of the DC resistance and the capacity. Rnorm at different SOCs are calculated at room temperature. Relative values of Rnorm at 70–100% SOC, normalized using the value at 100% SOC as a reference, are employed to characterize the sensitivity of Rnorm to SOC variations. Fig. 11(a) shows the Rnorm of four kinds of cells at different SOCs, and Fig. 11(b) shows the sensitivity of Rnorm to SOC variations at room temperature. Rnorm changes within 10% when the SOC changes from 70% to 100% for all examined cells. As a result, the variation in SOC at the beginning of discharging (namely, the end of charging) cannot account for the R variation in Fig. 9. In addition, Rnorm of cell B is much higher than that of the other three cells, which induces incomplete discharging.
It is reported that micro-cracking and lithium plating can reduce the resistance.16 In this case, we tentatively postulate that lithium plating decreases R in Fig. 9, as discussed in the following section.
Lithium plating and stripping
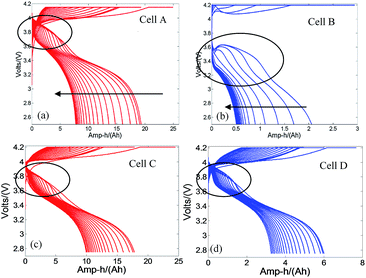
From the above discussions, it could be speculated that graphite anode experiences lithium plating under the CC–CV charging protocol at low temperatures. It is reported that lithium stripping will lead to a platform in the discharging curves.5 As a result, the discharging curves can be used to verify the assumption of lithium plating. Charging and discharging curves for the first 20 cycles at −10 °C are shown in Fig. 12. Platforms in discharging curves are observed for all types of cells during the first several cycles, indicating lithium plating on graphite anode material during the charging process at −10 °C.8In detail, the platforms of cell B are different from that of cells A, C and D. Cells A, C and D show platforms at the beginning of discharging, whereas the platform manifests at a lower voltage and shows a sign of voltage rebound for cell B. The lower cell voltage during discharging for cell B is attributed to the greater cell overpotential, as evidenced by the larger temperature rise (Fig. 10) and the larger Rnorm (Fig. 11(a)). Moreover, the larger temperature rise also explains the voltage rebound.17,18
Conclusions
This study compared the performance of four kinds of LICs during low-temperature cycling at −10 °C. These cells are different in application orientation (power or energy), cathode chemistry (LiNixMnyCo(1−x−y)O2 or LiNixCoyAl(1−x−y)O2), and cell format (18![[thin space (1/6-em)]](https://www.rsc.org/images/entities/char_2009.gif) 650 cell or pouch cell). By virtue of electrochemical analysis, we found that:
650 cell or pouch cell). By virtue of electrochemical analysis, we found that:
• DC resistance increased more remarkably for energy-type cells A and B, while the capacity decrease was more intensified for power-type cells C and D.
• The limiting process under low-temperature cycling for cell B with NCA as the cathode material is the discharging process, not the widely accepted charging process. For the other three kinds of cells with NCM as cathode material, the limiting process under low-temperature cycling is the charging process.
• In terms of pouch cells (cells A, C and D), generated heat dissipates much more easily than the 18![[thin space (1/6-em)]](https://www.rsc.org/images/entities/char_2009.gif) 650 cells (cell B). As a result, the temperature increase in pouch cells is smaller as compared with the 18
650 cells (cell B). As a result, the temperature increase in pouch cells is smaller as compared with the 18![[thin space (1/6-em)]](https://www.rsc.org/images/entities/char_2009.gif) 650 cells, making lithium plating more serious for pouch cells during low-temperature cycling.
650 cells, making lithium plating more serious for pouch cells during low-temperature cycling.
• The appearance of lithium plating at the graphite anode during low-temperature cycling was speculated by the R–Q plot and confirmed by platforms in the discharging curves.
Acknowledgements
This work is supported by the National Natural Science Foundation of China under the grant number of 51377097 and 51577104, and China Postdoctoral Science Foundation funded the project with grant number 2014M560079.References
- A. Barré, B. Deguilhem, S. Grolleau, M. Gérard, F. Suard and D. Riu, J. Power Sources, 2013, 241, 680–689 CrossRef
.
- Y. Ji, Y. C. Zhang and C. Y. Wang, J. Electrochem. Soc., 2013, 160, A636–A649 CrossRef CAS
.
- D. Burow, K. Sergeeva, S. Calles, K. Schorb, A. Börger, C. Roth and P. Heitjans, J. Power Sources, 2016, 307, 806–814 CrossRef CAS
.
- T. C. Bach, S. F. Schuster, E. Fleder, J. Müller, M. J. Brand, H. Lorrmann, A. Jossen and G. Sextl, Journal of Energy Storage, 2016, 5, 212–223 CrossRef
.
- M. Petzl and M. A. Danzer, J. Power Sources, 2014, 254, 80–87 CrossRef CAS
.
- S. Schindler, M. Bauer, M. Petzl and M. A. Danzer, J. Power Sources, 2016, 304, 170–180 CrossRef CAS
.
- M. Zier, F. Scheiba, S. Oswald, J. Thomas, D. Goers, T. Scherer, M. Klose, H. Ehrenberg and J. Eckert, J. Power Sources, 2014, 266, 198–207 CrossRef CAS
.
- A. Senyshyn, M. J. Mühlbauer, O. Dolotko and H. Ehrenberg, J. Power Sources, 2015, 282, 235–240 CrossRef CAS
.
- M. C. Smart and B. V. Ratnakumar, J. Electrochem. Soc., 2011, 158, A379–A389 CrossRef CAS
.
- T. Waldmann, M. Wilka, M. Kasper, M. Fleischhammer and M. Wohlfahrt-Mehrens, J. Power Sources, 2014, 262, 129–135 CrossRef CAS
.
- M. Petzl, M. Kasper and M. A. Danzer, J. Power Sources, 2015, 275, 799–807 CrossRef CAS
.
- M. Fleischhammer, T. Waldmann, G. Bisle, B.-I. Hogg and M. Wohlfahrt-Mehrens, J. Power Sources, 2015, 274, 432–439 CrossRef CAS
.
- M. Ouyang, Z. Chu, L. Lu, J. Li, X. Han, X. Feng and G. Liu, J. Power Sources, 2015, 286, 309–320 CrossRef CAS
.
- L. Su, J. Zhang, C. Wang, Y. Zhang, Z. Li, Y. Song, T. Jin and Z. Ma, Appl. Energy, 2016, 163, 201–210 CrossRef CAS
.
- Z. Li, J. Huang, B. Y. Liaw, V. Metzler and J. B. Zhang, J. Power Sources, 2014, 254, 168–182 CrossRef CAS
.
- J. Vetter, P. Novak, M. R. Wagner, C. Veit, K. C. Moller, J. O. Besenhard, M. Winter, M. Wohlfahrt-Mehrens, C. Vogler and A. Hammouche, J. Power Sources, 2005, 147, 269–281 CrossRef CAS
.
- S. C. Chen, C. C. Wan and Y. Y. Wang, J. Power Sources, 2005, 140, 111–124 CrossRef CAS
.
- W. Walker and H. Ardebili, J. Power Sources, 2014, 269, 486–497 CrossRef CAS
.
| This journal is © The Royal Society of Chemistry 2017 |


