 Open Access Article
Effective removal of salicylic and gallic acids from single component and impurity-containing systems using an isatin-modified adsorption resin
Fei Han†
 ab,
Chao Xu†
 ab,
Wei-Zhi Sun
 *a,
Shi-Tao Yu
 *b and
Mo Xian
 a
a
aCAS Key Laboratory of Bio-based Materials, Qingdao Institute of Biomass Energy and Bioprocess Technology, Chinese Academy of Sciences, Qingdao 266101, People's Republic of China. E-mail: sunwz@qibebt.ac.cn; Tel: +86-532-80662681
bCollege of Chemical Engineering, Qingdao University of Science & Technology, Qingdao 266042, People's Republic of China. E-mail: yushitaoqust@163.com; Tel: +86-532-84022879
First published on 26th April 2017
Abstract
In this study, an isatin-modified adsorption resin named HF-02, which effectively adsorbs and removes salicylic acid (SA) and gallic acid (GA) from aqueous phase, was prepared and characterized. Its adsorption capacity towards these two adsorbates was higher than for the commercial hyper-crosslinked resins H103 and CHA-111, and the macroporous resins HPD 500, Amberlite XAD-7 and XAD-4. This is attributed to its superior porous structure and modified groups. The adsorption capacity of HF-02 towards SA is higher than for GA and its uptake amounts for SA and GA calculated by Freundlich isotherm were 350.7 mg g−1 and 160.8 mg g−1, respectively. The difference is mainly because the utilization ratio of adsorption sites in resins is lower when adsorbing GA and the hydrophilicity of GA is stronger than SA. The thermodynamic parameters in single component systems indicated that the two adsorption processes are exothermic and physical in nature. Furthermore, the molecular structure, initial concentration and temperature determine the uptake amounts and adsorption rate of HF-02. It is noteworthy that 1% NaOH aqueous solution and absolute ethanol gave a more efficient desorption effect in the dynamic experiment than 363 K pure water. The salt-promoting effect of NaCl, the complex-forming effect of Ni(II) and the ionization-inhibiting effect of H+ would enhance the uptake amounts of HF-02 in impurity-containing systems.
1. Introduction
Salicylic acid (SA) and gallic acid (GA), as valuable pure chemicals and pharmaceutical intermediates, are widely employed in drug production, and in the cosmetics and food industries.1–5 In many complex production processes, a large amount of raw materials will be discharged with wastewater, resulting in a great waste of raw materials. To make matters worse, as typical aromatic compounds, SA and GA have potential carcinogenic and mutagenic risks.6 Consequently, the efficient removal and recycling of SA and GA could play a significant role in the transformation of the traditional chemical industry and in the development of the new environmental protection industry. On the other hand, as valuable plant acids, SA and GA are widely present in organic matter.7,8 The high concentration of the two substances in the extract solution is of great value in the reduction of material costs and in the high-value utilization of biomass.As a green technology, adsorption has been widely utilized in recent years because of its high separation efficiency and enrichment capacity. In addition to the natural modified material adsorbents, such as activated carbon, chitosan and biosorbents, various synthetic adsorbents have been used for the adsorption of organic matter and heavy metals. Zhang and colleagues prepared a series of three-dimensionally ordered macroporous polymers. The materials have a relatively large and uniformly distributed pore size, but the specific surface area is typically relatively low.9,10 The materials could adsorb SA with a high adsorption capacity, but the pore sizes are much larger for SA and the utilization ratios of pores are therefore low. Metal organic frameworks are versatile materials with high porosity, adjustable pore size and various functional groups, and can be used for catalysis and adsorption. Hasan and colleagues calcined a series of Zr-based metal organic frameworks with mean pore sizes of the materials close to microporous. This is conducive to the adsorption of SA.11 However, their specific surface areas are relatively low and this would be a drawback for adsorption. Graphene has reasonable adsorption properties owing to its high specific surface area and uniform adsorption sites. Lee et al. prepared a series of graphene-based nanosorbents through the acid or alkali heat treatment of graphene.12 These materials possess the ability to remove SA at low concentrations, but their adsorption capacities would generally decrease at high concentrations. In addition, these materials are currently difficult to produce in large-scale applications.
Resins, hyper-crosslinked resins in particular, have been widely used to remove aromatic adsorbates from aqueous solution due to their high specific surface area, tunable pore structure and their superior mechanical strength.13 However, generally, resins also have the shortcoming of low selectivity. In 1969, Davankov produced a hyper-crosslinked resin for the first time by a post-crosslinking reaction of polystyrene.14 Since resin adsorption has the advantages of simple operation, high adsorption capacity and outstanding regenerative performance, hyper-crosslinked resins have a wide range of applications in the recovery of phenolic compounds,15 purification of natural products16 and the treatment of wastewater containing heavy metals.17 A large number of commercial hyper-crosslinked resins including H103 and CHA-111 are used in industrial production, and they generally have a high adsorption capacity.13,18,19 To further improve the adsorption capacity and adsorption selectivity, modification is often conducted to introduce functional groups into chloromethyl polystyrene (CMPS),20 and modified amino, hydroxyl, carboxyl and carbonyl groups are effective towards aromatic adsorbates.
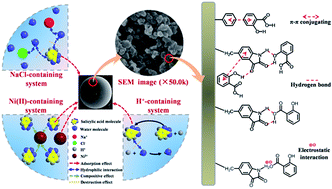
According to previous studies on resin properties, physical interaction was the dominant factor during the adsorption of aromatic compounds from aqueous media. In addition, the π–π conjugating effect between aromatic compounds and the benzene ring of the resin, hydrogen-bonding effect and electrostatic interaction between the adsorbate groups and the modified functional groups of the resin also contribute to the adsorption capacity.21,22
In this study, an isatin-modified hyper-crosslinked resin (HF-02) was synthesized by a one-pot reaction based on chloromethylated polystyrene resin. After the modification, its polarity was raised and the steric hindrance effect of the adsorption was weakened. In addition, the benzene ring, acylamino and carbonyl groups would form a chemical interaction with SA and GA. Compared to the series of commercial resins, HF-02 displayed greater physical adsorption of SA and GA due to its higher specific surface area and more regular pore structure. In addition, the π–π conjugating effect, hydrogen-bonding effect and electrostatic interaction between the isatin group and the adsorbates further improved its adsorption capacity. HF-02 was used to adsorb and enrich SA and GA in single component systems, and in contrast, its adsorption properties in systems containing NaCl, Ni(II) and H+ were also investigated. Thus, the salt-promoting effect of NaCl, the complex-forming effect of Ni(II) and the ionization-inhibiting effect of H+ were evaluated under different conditions. Based on this study, the structure matching relationship between HF-02 and adsorbates was preliminarily explored, and could provide a theoretical basis for resource utilization and harmless treatment of the two compounds.
2. Materials and methods
2.1 Chemicals
Chloromethylated styrene–divinylbenzene copolymer (CMPS) was obtained from Tianjin Yunneng Co., Ltd. CHA-111, H103 and HPD 500 were supplied by Zhenzhou Qinshi Co., Ltd. The Amberlite XAD-7 and XAD-4 were supplied by Rohm & Haas Company. Isatin (C8H5NO2), anhydrous aluminum chloride (AlCl3), salicylic acid (C7H6O3), gallic acid (C7H6O5) and nitrobenzene (C6H5NO2) were obtained from Sinopharm Chemical Reagent Co., Ltd. All reagents used in the present investigation were analytical grade and were used without further purification.2.2 Preparation of HF-02 adsorbent
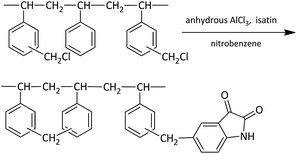
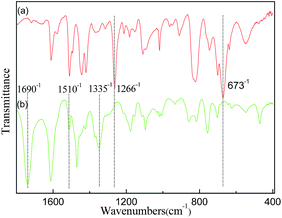
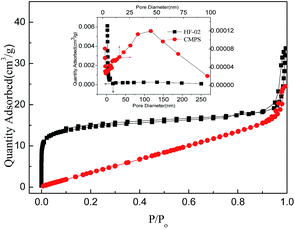
In a three-necked round-bottomed flask, 30.0 g of CMPS (17.82% chlorine equivalent weight) was swollen in 250 mL of nitrobenzene with mechanical agitation at 298 K overnight. Then 5.0 g of anhydrous AlCl3 was added rapidly to the system and the reaction mixture was refluxed at 383 K for 4 h (8% chlorine equivalent weight remained). This post-crosslinking reaction was optimized according to an earlier study.23 After cooling to 363 K, 11.9 g isatin (1.2 times the mole ratio to chlorine) and 2.0 g anhydrous AlCl3 were added, and the system was refluxed for another 6 h. After that, the solid particles were filtered from the solution, and extracted by Soxhlet extractor with ultrapure water and acetone and dried at 323 K. The dried sample of resin was named HF-02.The probable process of the reaction is shown in Scheme 1, and HF-02 was characterized by Fourier transform infrared spectroscopy (FT-IR Nicolet iN10 IR Microscope, Thermo Fisher, USA), elemental analysis (VarioELCube, GmbH, Germany) and N2 adsorption (ASAP2020 M+C, Micromeritics, USA).
2.3 Adsorption experiments in single component systems
| Qe = (C0 − Ce) × V/W | (1) |
The Freundlich isotherm model was employed to describe the adsorption curve according to eqn (2):24
| Qe = KfCe1/n | (2) |
 | (3) |
 | (4) |
 | (5) |
The fixed-bed column was washed with ethanol and deionized water until the concentration of desorption solutions was lower than 0.02C0, and it was then used repeatedly in further adsorption–desorption processes and the equilibrium capacity was measured in every cycle.
2.4 Adsorption experiments in impurity-containing systems
In order to investigate the influence of inorganic salt, heavy metal ions and pH value on the adsorption behavior of SA and GA on HF-02, experiments were also carried out in systems containing various amounts of NaCl, Ni(II) and HCl or NaOH.3. Results and discussion
3.1 Characterization of HF-02
![[double bond, length as m-dash]](https://www.rsc.org/images/entities/char_e001.gif) O group, N–H group and C–N group, respectively (Fig. 1b), indicating that a carbonyl group and secondary amides were successfully introduced into the framework.29
O group, N–H group and C–N group, respectively (Fig. 1b), indicating that a carbonyl group and secondary amides were successfully introduced into the framework.29
| Resin | Element content (%) | |||
|---|---|---|---|---|
| C | O | N | Cl | |
| CMPS | 75.82 | — | — | 17.82 |
| HF-02 | 79.66 | 9.58 | 3.72 | 0.85 |
| Resin | SBET (m2 g−1) | Vt (cm3 g−1) | Pore size (nm) |
|---|---|---|---|
| CMPS | 20.627 | 0.85 | 26.0 |
| HF-02 | 1222.9 | 1.17 | 3.8 |
3.2 Adsorption in single component systems
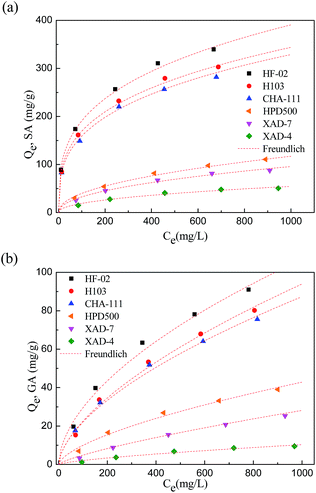 | ||
| Fig. 3 Comparison of adsorption of resins towards SA (a) and GA (b) and the fitting of the Freundlich equation. | ||
| Adsorbent | Adsorbate | Freundlich equation | Kf | n | R2 |
|---|---|---|---|---|---|
| HF-02 | SA | ln![[thin space (1/6-em)]](https://www.rsc.org/images/entities/char_2009.gif) Qe = 0.3109 × ln Qe = 0.3109 × ln![[thin space (1/6-em)]](https://www.rsc.org/images/entities/char_2009.gif) Ce + 3.8201 Ce + 3.8201 |
45.610 | 3.2162 | 0.9900 |
| GA | ln![[thin space (1/6-em)]](https://www.rsc.org/images/entities/char_2009.gif) Qe = 1.2608 × ln Qe = 1.2608 × ln![[thin space (1/6-em)]](https://www.rsc.org/images/entities/char_2009.gif) Ce + 0.8182 Ce + 0.8182 |
2.2664 | 0.7931 | 0.9690 | |
| H103 | SA | ln![[thin space (1/6-em)]](https://www.rsc.org/images/entities/char_2009.gif) Qe = 0.3079 × ln Qe = 0.3079 × ln![[thin space (1/6-em)]](https://www.rsc.org/images/entities/char_2009.gif) Ce + 3.7134 Ce + 3.7134 |
40.994 | 3.2482 | 0.9882 |
| GA | ln![[thin space (1/6-em)]](https://www.rsc.org/images/entities/char_2009.gif) Qe = 0.6199 × ln Qe = 0.6199 × ln![[thin space (1/6-em)]](https://www.rsc.org/images/entities/char_2009.gif) Ce + 0.2608 Ce + 0.2608 |
1.2980 | 1.6133 | 0.9766 | |
| CHA-111 | SA | ln![[thin space (1/6-em)]](https://www.rsc.org/images/entities/char_2009.gif) Qe = 0.3151 × ln Qe = 0.3151 × ln![[thin space (1/6-em)]](https://www.rsc.org/images/entities/char_2009.gif) Ce + 3.6193 Ce + 3.6193 |
37.313 | 3.1737 | 0.9883 |
| GA | ln![[thin space (1/6-em)]](https://www.rsc.org/images/entities/char_2009.gif) Qe = 0.5969 × ln Qe = 0.5969 × ln![[thin space (1/6-em)]](https://www.rsc.org/images/entities/char_2009.gif) Ce + 0.3458 Ce + 0.3458 |
1.4131 | 1.6751 | 0.9775 | |
| HPD 500 | SA | ln![[thin space (1/6-em)]](https://www.rsc.org/images/entities/char_2009.gif) Qe = 0.4691 × ln Qe = 0.4691 × ln![[thin space (1/6-em)]](https://www.rsc.org/images/entities/char_2009.gif) Ce + 1.5217 Ce + 1.5217 |
4.5849 | 2.1317 | 0.9859 |
| GA | ln![[thin space (1/6-em)]](https://www.rsc.org/images/entities/char_2009.gif) Qe = 0.6339 × ln Qe = 0.6339 × ln![[thin space (1/6-em)]](https://www.rsc.org/images/entities/char_2009.gif) Ce − 0.6210 Ce − 0.6210 |
0.5374 | 1.5775 | 0.9755 | |
| XAD-7 | SA | ln![[thin space (1/6-em)]](https://www.rsc.org/images/entities/char_2009.gif) Qe = 0.4696 × ln Qe = 0.4696 × ln![[thin space (1/6-em)]](https://www.rsc.org/images/entities/char_2009.gif) Ce + 1.3249 Ce + 1.3249 |
3.7618 | 2.1341 | 0.9819 |
| GA | ln![[thin space (1/6-em)]](https://www.rsc.org/images/entities/char_2009.gif) Qe = 0.7613 × ln Qe = 0.7613 × ln![[thin space (1/6-em)]](https://www.rsc.org/images/entities/char_2009.gif) Ce − 1.9921 Ce − 1.9921 |
0.1463 | 1.3135 | 0.9917 | |
| XAD-4 | SA | ln![[thin space (1/6-em)]](https://www.rsc.org/images/entities/char_2009.gif) Qe = 0.4572 × ln Qe = 0.4572 × ln![[thin space (1/6-em)]](https://www.rsc.org/images/entities/char_2009.gif) Ce + 0.8401 Ce + 0.8401 |
2.3166 | 2.1873 | 0.9651 |
| GA | ln![[thin space (1/6-em)]](https://www.rsc.org/images/entities/char_2009.gif) Qe = 0.6958 × ln Qe = 0.6958 × ln![[thin space (1/6-em)]](https://www.rsc.org/images/entities/char_2009.gif) Ce − 2.4747 Ce − 2.4747 |
0.0842 | 1.4372 | 0.9582 |
The different adsorption properties of the series of resins are closely related to their structural properties, and both physical and chemical interactions would be involved in the adsorption process. From the point of view of physical structure, H103 and CHA-111 are typical hyper-crosslinked resins, and XAD-7, XAD-4 and HPD 500 are representative macroporous resins. The related physical and structural parameters are presented in Table 4.
| Resin | SBET (m2 g−1) | Average pore size (nm) | Polarity | Framework |
|---|---|---|---|---|
| HF-02 | 1222.9 | 3.8 | Polar | Styrene (with isatin-group) |
| H103 | 1207.8 | 4.0 | Nonpolar | Styrene |
| CHA-111 | 934.0 | 1.2 | Weak-polar | Styrene (with carbonyl-group) |
| HPD 500 | 520 | 11.0 | Weak-polar | Styrene (with cyano-group) |
| XAD-7 | 539 | 6.2 | Polar | Acrylate |
| XAD-4 | 747.1 | 9.9 | Nonpolar | Styrene |
The hyper-crosslinked resin exhibited better adsorption capacities towards SA and GA due to their higher Brunauer–Emmett–Teller (BET) surface areas, and this would provide more combining sites for the adsorption of adsorbate molecules than macroporous resins.
In addition, pore size is also very important for the combination of adsorbate and adsorbent. The molecular sizes of SA and GA are 0.60 × 0.48 × 0.11 (nm) and 0.79 × 0.58 × 0.11 (nm), respectively. According to a previous study, when the pore size of the adsorbent is 2–6 times as large as the molecular size of the adsorbate, the optimum adsorption interaction is formed.32 The narrower porous structure of CHA-111 would definitely reduce its adsorption capacity.
Due to the partial combination of Cl-sites with isatin, the post-8 crosslinking reaction of HF-02 is incomplete, but HF-02 possesses a similar porous structure to complete post-crosslinked resin H103 owing to the optimized post-crosslinking reaction researched previously.23 Beyond that, the introduced isatin group possesses both carbonyl and secondary amine functional groups. These are able to form hydrogen bonds with the active hydrogen atoms, and the secondary amine could also act as a hydrogen donor to interact with the oxygen in the acids. All of these chemical interactions will no doubt enhance the uptake amount of adsorbate. Moreover, after the modification, part of the adsorption sites will transfer onto the introduced group, which can reduce the adsorptive steric hindrance and increase the polarity of the resin. These changes provide HF-02 with a better compatibility with the two polar adsorbate molecules.
For macroporous resins HPD 500, Amberlite XAD-7 and XAD-4, the BET surface area is generally lower and the average pore size is larger than in the hyper-crosslinked resin, and these differences provide a weaker surface adsorption capacity and a greater space wastage. For the three adsorbents, the BET surface area, the polarity and the framework have a mutual effect on the adsorption capacity. Compared with XAD-4, the weakly polar HPD 500 is better able to contact the polar adsorbate and, in addition, its cyano group can form hydrogen bonding with the adsorbate. Similarly, the polarity and acrylate structure of XAD-7 contribute to its adsorption capacity. The adsorption capacity of HPD 500 is higher than that of XAD-7, but they possess similar BET surface areas. Besides the pore factor, the π–π conjugation adsorption probably makes a higher contribution to the adsorption capacity.
The values of Kf, a relative indicator of adsorption capacity in Freundlich theory, indicate that the adsorption capacity of the resin for SA is higher than that for GA. There are two main reasons for the difference.
On the one hand, the physical structure of the adsorbent has a selective adsorption effect towards the two adsorbates. As a sort of synthetic adsorbent, resin generally has a uniform pore distribution. The pore size distribution of resins can range from 1.1 to 25 nm, and the micropores in the applied resins account for more than 30% of the pore volume. For the two adsorbates with different molecular volumes, the interception ability of the surface layer of resin towards them would be different. Most micropores are sensitive to the molecular size of the adsorbate. The larger adsorbate molecule is more likely to be intercepted on the surface layer of the resin, and less likely to enter the inner layer of the resin and be adsorbed by the inner adsorption sites. The utilization ratio of adsorption sites is lower for larger adsorbates, and the macroscopic result of this phenomenon is that the adsorption capacity towards larger adsorbates is lower. Accordingly, since the molecular size of GA is larger than that of SA, the adsorption of the applied resins towards GA is less efficient than towards SA.
On the other hand, the hydrophilic nature of GA is stronger as a result of its three hydroxyl groups. For SA, there are fewer hydrophilic groups on its benzene ring, and its neighboring hydroxyl and carboxyl groups are more inclined to form an intramolecular hydrogen bond, thus its hydrophilic nature is weaker than for GA. For the more hydrophilic GA, the adsorption site must overcome a stronger resistance to form an adsorption effect with it, and as a result, the uptake amounts of the adsorbent towards GA are lower.
It is the interaction of these two factors that results in the different adsorption performances of the two adsorbates. What is more, it is interesting to note that hyper-crosslinked resin exhibited a larger advantage over macroporous resin when subjected to SA. This is probably because the higher specific surface area of hyper-crosslinked resin is favorable for the adsorption of smaller-sized adsorbate molecules.
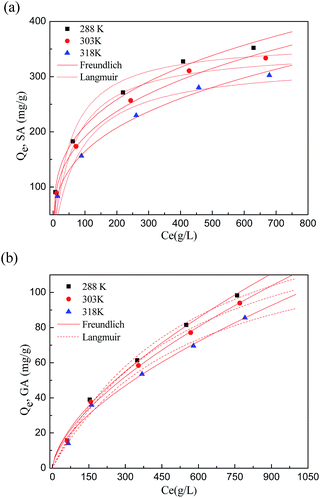 | ||
| Fig. 4 Adsorption isotherms of SA (a) and GA (b) on HF-02 (solid line for the Freundlich equation, dotted line for the Langmuir equation). | ||
The constants evaluated by the Langmuir and Freundlich isotherm equations are included in Table 5. The monolayer adsorption capacities of SA and GA calculated by the Langmuir equation are 350.7 mg g−1 and 160.1 mg g−1 at an equilibrium concentration of 1000 mg L−1 at 303 K. The decrease in temperature benefits the adsorption process, which indicates that the process is exothermic and physical in nature. Freundlich equations are more suitable for correlating the equilibrium isotherm data, which shows the heterogeneity of the adsorbent surface, and the adsorption behavior was a preferential process with n > 1.25
| Adsorbate | Temperature (K) | Langmuir isotherm | Freundlich isotherm | ||||
|---|---|---|---|---|---|---|---|
| Qm | b | R2 | Kf | n | R2 | ||
| SA | 288 | 365.2 | 0.019 | 0.908 | 54.21 | 3.394 | 0.993 |
| 303 | 350.7 | 0.016 | 0.928 | 45.67 | 3.218 | 0.990 | |
| 318 | 326.5 | 0.012 | 0.924 | 35.84 | 3.021 | 0.994 | |
| GA | 288 | 171.3 | 0.002 | 0.992 | 1.472 | 1.575 | 0.991 |
| 303 | 160.1 | 0.002 | 0.990 | 1.452 | 1.593 | 0.992 | |
| 318 | 141.6 | 0.002 | 0.983 | 1.377 | 1.616 | 0.986 | |
The adsorption equilibrium constants Kd (=Qe/Ce) at different temperatures and different initial concentrations are given in Table 6. The constants could reflect the binding capacity between the adsorbent and adsorbate.33 Kd decreases with increasing initial concentration, and this is mainly because the adsorbate has priority to form an adsorption effect with the surface adsorption sites of the adsorbent at high concentrations, and the adsorption effect of the inner sites would be hindered, which leads to a decrease in overall binding ability. Furthermore, Kd increases with decreasing adsorption temperature, which shows that the adsorbate and adsorbent will combine more readily at lower temperatures. In addition, Kd(SA) is larger than Kd(GA) under the same adsorption conditions, which is the same sequence as for equilibrium adsorption capacity.
| Adsorbate | C0 (mg L−1) | Kd | ||
|---|---|---|---|---|
| 288 K | 303 K | 318 K | ||
| SA | 100 | 12![[thin space (1/6-em)]](https://www.rsc.org/images/entities/char_2009.gif) 839.87 839.87 |
8015.81 | 5999.77 |
| 250 | 3017.00 | 2460.29 | 1802.02 | |
| 500 | 1278.40 | 1050.15 | 916.81 | |
| 750 | 837.10 | 755.45 | 640.27 | |
| 1000 | 589.19 | 498.29 | 473.13 | |
| GA | 100 | 256.46 | 251.98 | 214.27 |
| 250 | 249.67 | 233.59 | 219.52 | |
| 500 | 172.95 | 164.90 | 142.39 | |
| 750 | 145.38 | 127.76 | 117.43 | |
| 1000 | 126.86 | 119.38 | 105.70 | |
ΔG0 = −RT![[thin space (1/6-em)]](https://www.rsc.org/images/entities/char_2009.gif) ln ln![[thin space (1/6-em)]](https://www.rsc.org/images/entities/char_2009.gif) Kd Kd
| (6) |
 | (7) |
The thermodynamic parameters for SA and GA are summarized in Table 7. The values of ΔH0 for SA and GA are all negative and their absolute values are all less than 40 kJ mol−1, which illustrates that the adsorption process is exothermic and physical in nature. Similarly, the negative values of ΔS0 imply the decreasing degree of system chaos, and this is because the thermal motion of adsorbate molecules is impeded because of the adsorption effect. The two parameters illustrate that the adsorption process is exothermic and spontaneous reaction.
| Adsorbate | C0 (mg L−1) | ΔG0 (kJ mol−1) | ΔH0 (kJ mol−1) | ΔS0 (J K−1 mol−1) | ||
|---|---|---|---|---|---|---|
| 288 K | 303 K | 318 K | ||||
| SA | 100 | −22.65 | −22.64 | −20.83 | −40.44 | −60.52 |
| 250 | −19.18 | −19.67 | −17.95 | −31.39 | −41.45 | |
| 500 | −17.13 | −17.52 | −16.33 | −25.03 | −26.14 | |
| 750 | −16.11 | −16.70 | −15.47 | −22.57 | −21.41 | |
| 1000 | −15.27 | −15.65 | −14.75 | −20.52 | −17.04 | |
| GA | 100 | −13.28 | −13.93 | −12.85 | −17.71 | −14.42 |
| 250 | −13.22 | −13.74 | −12.91 | −16.43 | −10.41 | |
| 500 | −12.34 | −12.86 | −11.87 | −17.06 | −15.24 | |
| 750 | −11.92 | −12.22 | −11.41 | −17.01 | −17.25 | |
| 1000 | −11.60 | −12.05 | −11.16 | −16.01 | −14.82 | |
The negative values of ΔG0 imply that the adsorption process is an exothermic reaction, and its absolute value is in the range of 10–20 kJ mol−1 indicating that the adsorption is basically a physical process. Furthermore, it is noted that ΔG0 increases with temperature indicating that elevated temperature can promote the spontaneous process of adsorption. In addition, the absolute values for SA are larger than those for GA, coinciding with the uptake amounts of HF-02 towards them.
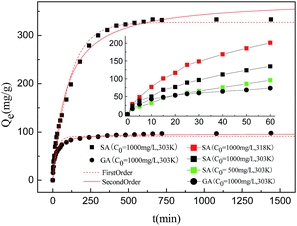
HF-02 has a higher adsorption rate in the initial stages, as can be seen in the inset graph in Fig. 5; the adsorption capacities towards SA and GA after 60 minutes can reach 40.4% and 75.6% of the equilibrium adsorption capacities (Qe), respectively. This can be explained by the mass transfer process. The interception effect of the surface layer of HF-02 towards GA is higher than for SA, and the utilization of inner adsorption sites is correspondingly lower. After the adsorbate is adsorbed on the surface, the inner driving force of the concentration difference is reduced accordingly. Thus, a higher utilization of inner adsorption sites needs a longer time to reach the adsorption equilibrium, and the ability of SA to reach equilibrium in unit time is poorer.
By comparison of the adsorption behavior of SA at different temperatures and initial concentrations, it was found that the adsorption capacities towards SA at 318 K, 1000 mg L−1 and 303 K, 500 mg L−1 can reach 66.5% and 37.3% of the Qe in 60 minutes, respectively. This could directly reflect the driving process of adsorption. A higher temperature results in a shorter time required to reach equilibrium due to the higher diffusion rate of the SA molecules into the pores of the resin, and a lower initial concentration of SA requires more time to reach equilibrium owing to the weaker driving force of the concentration gradient.
The pseudo-first-order and pseudo-second-order equations were used to fit the kinetic adsorption data, and all the constants evaluated by the application of equations are included in Table 8.
| Adsorbate | Pseudo-first-order equations | Pseudo-second-order equations | ||||
|---|---|---|---|---|---|---|
| Qe | k1 | R2 | Qe | k2 | R2 | |
| SA | 327.22 | 0.0090 | 0.9858 | 374.67 | 0.0000 | 0.9906 |
| GA | 91.045 | 0.0397 | 0.9403 | 96.237 | 0.0006 | 0.9897 |
Both equations fit well for SA adsorbed by HF-02 owing to the high correlation factors (R2 > 0.98), which indicates that both physical diffusion and chemical adsorption are the rate-limiting factors.35 The utilization of inner sites is relatively high when HF-02 adsorbs SA, and a weak driving force of the inner adsorption effect limits the adsorption rate. Furthermore, the chemical adsorption involving adsorption force through sharing or exchange of electrons between HF-02 and SA is another rate-limiting factor; this is because the secondary amine could have an electrostatic interaction with dissociated carboxyl or hydroxyl groups.22 But for GA, the kinetic adsorption data are better fitted by the pseudo-second-order equation compared to the pseudo-first-order equation, which suggests that the rate-limiting factor is primarily the chemical adsorption.
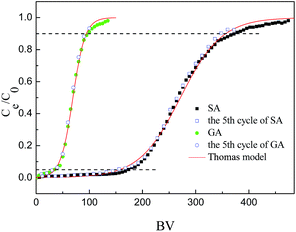
The Thomas model supposes that the flowing behavior in the fixed-bed adsorption column is the plug flow process.36 The Thomas model is employed to correlate the adsorption curve and it is given by:
 | (8) |
The Thomas model could fit well to the dynamic curves of the two adsorbates [R2(SA) = 0.9972, R2(GA) = 0.9976]. This model is based on the assumption that external and internal diffusion in the adsorbent are not the primary rate-determining steps.
It is generally believed that the adsorption process consists of three stages, including external diffusion, internal diffusion and the combination process. The combination process on the adsorption sites probably limits the adsorption rate. This process between the adsorbate molecules in the solvent and the sites on the solid surface is complex, and it can be assumed that an aqueous membrane covers the solid surface, and that the molecules transferring from the aqueous membrane to the surface of the adsorbent can be reduced to a free diffusion process. In order to combine with the adsorption sites, it is necessary for the adsorbate molecules to overcome the resistance of the liquid membrane, and this is the most likely rate-determining step.37
It was found that the time to reach adsorption equilibrium for SA was longer than for GA. This is because the inner adsorption process could not achieve its maximum mass transfer driving force until the external adsorption sites had achieved adsorption equilibrium, and a weak impetus driving force results in a longer time to reach adsorption equilibrium.
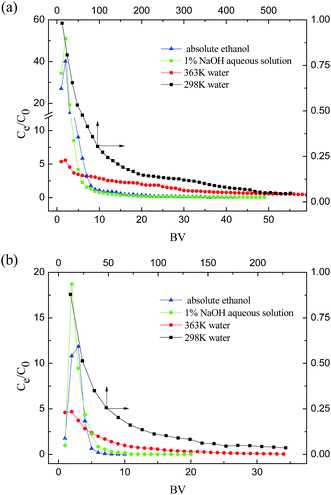
After HF-02 had achieved its adsorptive saturation, different desorption liquids including 1% NaOH aqueous solution, absolute ethanol, 363 K pure water and 298 K pure water, were employed to concentrate the adsorbates. The desorption curves of SA and GA with the different desorption liquids are shown in Fig. 7.
Absolute ethanol is an effective low-cost organic solvent and it could terminate the sorption effect and release the adsorbate into the organic phase. In addition, the hydroxyl structure of the adsorbate could be destroyed by salification in alkaline solution, and the adsorbate would be dissolved in the aqueous phase after the combined effect between the acids and adsorbent was disrupted.38 For hot water, because the adsorption behavior is a kind of exothermic process, hot solvent could reduce the adsorption capacity of the adsorbent and achieve an enrichment effect.
As can be seen in Fig. 7, absolute ethanol and 1% NaOH aqueous solution achieved a high enrichment of SA and GA, and the concentration of SA and GA in the desorption liquid could reach 30 and 10 times the feed concentration, respectively. At the same time, the two desorption agents also have an effective desorption capacity, because they could collect 90% of SA and GA within 4 BV. Compared with room temperature water, 363 K pure water has an enrichment effect, and the desorption liquid can reach four times the feed concentration in the first 2 BV. In addition, it could also washup the column (C/C0 < 0.02) using less solvent volume than room temperature water. Compared with the other two desorption agents, a greater volume of 363 K pure water is required to washup the column, and the concentration in solution is lower. These different desorption properties show that the destructive effect of hot water towards the combination between the adsorbates and HF-02 is weaker compared with absolute ethanol and 1% NaOH.
According to a comparative study of the three desorption methods, it is concluded that all three methods possess their respective features. Absolute ethanol has the advantages of adsorbate purification and solvent recovery because the organic solvent can be easily recycled by evaporation; however, this solvent is flammable in commercial production. Alkaline solution could treat the acid-containing wastewater more safely, but has the possibility to introduce impurities and produce secondary contamination. Hot water could recycle the adsorbate purely and safely, but its desorption technology requires more energy consumption.
The HF-02 fixed-bed resin column was then used repeatedly for five cycles in the continuous adsorption–desorption process, and its dynamic adsorption curves for the fifth cycles are presented in Fig. 6. The uptake amounts of HF-02 towards SA and GA decreased to 96.3% and 93.7%, respectively, indicating that the resin exhibited excellent reusability and possessed a reliable regeneration performance.
3.3 Adsorption experiments in impurity-containing systems
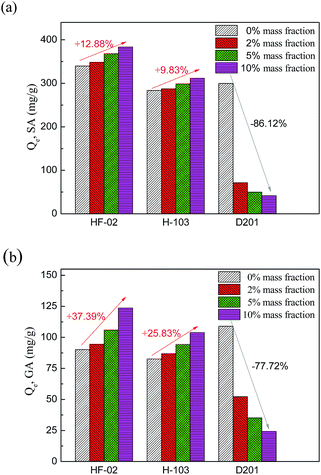 | ||
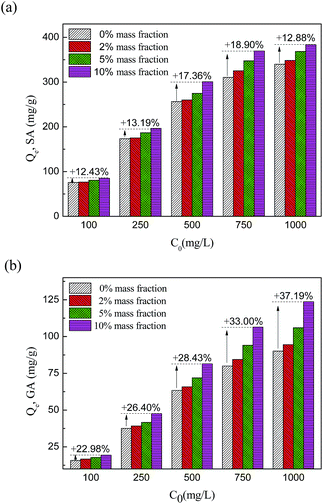
| Fig. 8 Variation of adsorption capacity of HF-02, H103 and D201 towards SA (a) and GA (b) influenced by inorganic salt content. | ||
This can be interpreted by the salting-out effect.39 On the one hand, the dielectric constant of the water molecule is much larger than that of aromatic molecules and the inorganic ions in the system will attract water molecules and reject acid molecules. After the water molecules are collected by the inorganic ions, the excluded adsorbate molecules are more inclined to be adsorbed by the adsorbent. Thus, a higher concentration of inorganic salt results in a lower solubility of organic solutes and this kind of hydrophobic interaction will increase the uptake amount of the adsorbent. Furthermore, according to the theory of compression of the electric double layer,40 more ions will thin the layer of adsorption sites and increase its conductivity, which will enhance the hydrogen bond interaction and lead to a stronger electrostatic interaction between carboxyl or hydroxyl groups and amide group. For this reason, the increased adsorptive quantity of HF-02 is much higher than that of H103. The two effects jointly promote the influence of NaCl impurities on HF-02.
For D201, as a kind of ion-exchange resin, the electrostatic interaction between hydroxyl, carboxyl and functional groups in D201 dominates its adsorption capacity. Therefore, the strong competition for adsorption sites between salt anions and adsorbate molecules could reduce the equilibrium capacity during the adsorption process,41 and the adsorption capacity of D201 decreases sharply.
The influence of NaCl at different initial concentrations of GA and SA is shown in Fig. 9. For GA, a higher initial concentration results in a larger increased proportion of adsorption capacity owing to the stronger salt-promoting effect. But for SA, the increased proportion goes against this trend at an initial concentration of 1000 mg L−1 SA. Since the salting-out effect could be regarded as a partial hydrophobic effect, this effect would not be obvious in a high concentration system of a hydrophobic substance.
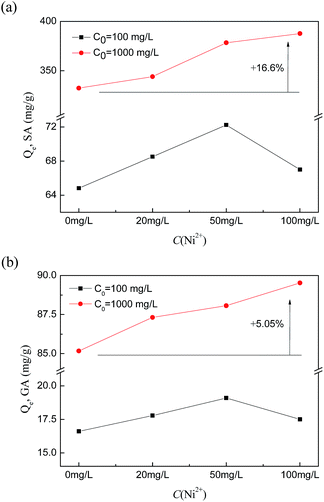
In contrast to the increase proportions of the two uptake amounts, the proportions of SA are much higher than those of GA. This can be explained by the structure of the complex. A Ni(II) ion can form a complex compound with four hydroxyl groups, which requires four SA molecules to form the complex with it. But for GA, which has three hydroxyl groups, fewer gallic acid molecules are required to form a stable complex compound with Ni(II), and it is considered that two molecules of GA could form a stable complex with Ni(II).42 The structural differences of the complex compounds lead to different uptake amounts of HF-02 towards the two molecules.
Furthermore, at lower initial concentration of acids and higher initial concentration of Ni(II), the increase proportion goes against the rising trend. This is mainly because the acylamino group of HF-02 can coordinate with the heavy metal,39 and the competitive effect towards adsorption sites between Ni(II) and complex compounds would reduce the adsorption capacity towards acid molecules.
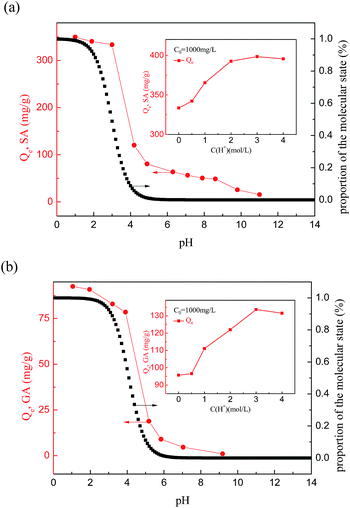
It was found that the adsorption capacity of HF-02 is extremely sensitive to the pH of the aqueous solutions containing SA or GA. The tendency for adsorption is similar to the dissociation curves for SA and GA, which implies that the molecular form of the adsorbate is favorable for adsorption. In addition, the isatin group and acids all demonstrate negative charge in the alkaline solution and the charge repulsion between the two molecules will reduce the amount of adsorption of SA and GA.
What is more, it was found that HF-02 has a better adsorption capacity in strongly acidic solution, as shown in the inset graph in Fig. 11, and whose uptake amounts towards SA and GA increase by 19.5% and 38.9%, respectively, in the system with 4 mol L−1 of H+. This is because the higher H+ concentration results in a higher degree of molecular structure due to inhibition of the ionization effect,44 which is more favorable for the formation of hydrogen bonds between acids and isatin group. At the same time, a large amount of existing H+ would promote the hydrophobic interaction of adsorbate molecules owing to the formation of hydronium ions, and this extra interaction would further add to the uptake amounts of HF-02.
3.4 Structure–activity relationship between SA, GA and HF-02
After isatin had been introduced into the framework, the polarity of HF-02 increased owing to the introduction of a benzene ring and its accessory structure. The steric hindrance of the adsorption behavior became weakened owing to protrusion of the adsorption site. The joint effects of the superior specific surface area, the regular pore structure and the functional adsorption of isatin, contribute to the outstanding adsorption capacity of HF-02.As shown in the Fig. 12, π–π conjugation of the two benzene rings between the framework and adsorbate molecules is the typical chemical adsorption effect. The acylamino group of isatin could form a stable hexatomic-ring structure by dual hydrogen bonding with the hydroxyl groups of SA and GA, which would enhance its adsorption capacity and enthalpy. In addition, the carbonyl group and benzene ring of isatin could form additional hydrogen bonds and π–π conjugation with more adsorbate molecules. Furthermore, from the perspective of ionization, the secondary amine could form an electrostatic interaction with a dissociated carboxyl or hydroxyl group. Correspondingly, the carbonyl group and benzene ring, as kinds of nonionic functional groups, would be more stable in an alkaline environment.
 | ||
| Fig. 12 Diagrammatic sketch of the structure–activity matching relationship (taking SA as an example). | ||
4. Conclusions
An isatin-modified hyper-crosslinked resin, HF-02, which effectively adsorbs and removes SA and GA from aqueous phase, was prepared and characterized by FT-IR and elemental analysis for its functional groups, and by N2 adsorption for its porous structure. The adsorption capacities of HF-02 towards SA and GA were higher than those of commercial hyper-crosslinked resins H103 and CHA-111, and macroporous resins HPD 500, Amberlite XAD-7 and XAD-4. Its adsorption capacity towards SA and GA at 303 K was calculated to be 350.7 mg g−1 and 160.8 mg g−1, respectively, using the Freundlich isotherm. In addition, the uptake amounts of SA by HF-02 were higher than those of GA; the different molecular volumes and hydrophilicities of the two adsorbates determine the adsorption capacity of HF-02. Furthermore, 1% NaOH aqueous solution and absolute ethanol had a more efficient desorption effect on HF-02 than 363 K pure water. Moreover, the adsorption capacity of HF-02 could be enhanced in systems containing NaCl, Ni(II) and H+. Thus, resin HF-02 is potentially useful in separating and concentrating GA and SA from single, inorganic salt-containing, heavy metal-containing and acidic systems.Acknowledgements
The authors gratefully acknowledge the generous support provided by the Natural Science Foundation of Shandong Province (ZR2016BQ39) and Taishan Scholars Climbing Program of Shandong (No. tspd20150210).References
- K. Kaur, H. Michael, S. Arora, P. Harkonen and S. Kumar, J. Ethnopharmacol., 2005, 99, 353–360 CrossRef PubMed.
- M. Li, L. Chen and K. Wu, Chem. World, 2001, 6, 313–315 Search PubMed.
- G. U. S. Orre Gordon, S. D. Wratten, M. Jonsson, M. Simpson and R. Hale, Biol. Control, 2013, 64, 106–115 CrossRef CAS.
- J. Sun, J. Fu and R. Zhou, Saudi J. Biol. Sci., 2014, 21, 185–190 CrossRef CAS PubMed.
- D. Wang, X. Zhang, W. Wei and Y. Sun, Catal. Commun., 2012, 28, 159–162 CrossRef CAS.
- L. Ma, J. Tang, Z. Li and Q. Liao, China J. Chin. Mater. Med., 2006, 10, 804–806 Search PubMed.
- C. Matito, F. Mastorakou, J. J. Centelles, J. L. Torres and M. Cascante, Eur. J. Nutr., 2003, 42, 43–49 CrossRef CAS PubMed.
- M. Herrero, A. Cifuentes and E. Ibanez, Food Chem., 2006, 98, 136–148 CrossRef CAS.
- X. Wang, Y. Wang, L. Feng, P. Liu and X. Zhang, Chem. Eng. J., 2012, 203, 251–258 CrossRef CAS.
- X. Zhang, G. Li, H. Zhang, X. Wang, J. Qu, P. Liu and Y. Wang, Soft Matter, 2013, 9, 6159 RSC.
- Z. Hasan, D. W. Cho, I. H. Nam, C. M. Chon and H. Song, Materials, 2016, 9, 261 CrossRef.
- X. J. Lee, N. Chemmangattuvalappil and L. Y. Lee, Chem. Eng. Trans., 2015, 45, 1387–1392 Search PubMed.
- S. F. Lo, S. Y. Wang, M. J. Tsai and L. D. Lin, Chem. Eng. Res. Des., 2012, 90, 1397–1406 CrossRef CAS.
- M. P. Tsyurupa and V. A. Davankov, React. Funct. Polym., 2006, 66, 768–779 CrossRef CAS.
- M. L. Soto, A. Moure, H. Domínguez and J. C. Parajó, J. Food Eng., 2011, 105, 1–27 CrossRef CAS.
- K. Chen, H. Lyu, S. Hao, G. Luo, S. Zhang and J. Chen, Bioresour. Technol., 2015, 182, 160–168 CrossRef CAS PubMed.
- C. Xu, F. Q. Liu, J. Gao, L. J. Li, Z. P. Bai, C. Ling, C. Q. Zhu, D. Chen and A. M. Li, J. Hazard. Mater., 2014, 280, 1–11 CrossRef CAS PubMed.
- L. Zhou, H. Zhong, C. Li and G. Zhao, Chin. J. Process Eng., 2010, 3, 462–469 Search PubMed.
- B. C. Pan, Y. Xiong, Q. Su, A. M. Li, J. L. Chen and Q. X. Zhang, Chemosphere, 2003, 51, 953–962 CrossRef CAS PubMed.
- C. Ling, X. Zhengwen, H. Qing, S. Jing, L. Jiangang, Z. Yunlong, L. Fengying and C. Mindong, Polym. Bull., 2014, 03, 23–29 Search PubMed.
- C. Ling, X. Li, Z. Zhang, F. Liu, Y. Deng, X. Zhang, A. Li, L. He and B. Xing, Environ. Sci. Technol., 2016, 50, 10015–10023 CrossRef CAS PubMed.
- T. Chen, F. Liu, C. Ling, J. Gao, C. Xu, L. Li and A. Li, Environ. Sci. Technol., 2013, 47, 13652–13660 CrossRef CAS PubMed.
- F. Han, C. Xu, W. Sun and S. Yu, Ion Exch. Adsorpt., 2017, 01, 32–45 Search PubMed.
- H. Freundlich, Z. Phys. Chem., Stoechiom. Verwandtschaftsl., 1906, 57, 385–470 CAS.
- I. Langmuir, J. Am. Chem. Soc., 1918, 40, 1361–1403 CrossRef CAS.
- G. Mckay and Y. S. Ho, Process Biochem., 1999, 34, 451–465 CrossRef.
- Y. S. Ho and G. Mackay, Chem. Technol., 1997, 213–222 Search PubMed.
- J. T. Wang, Q. M. Hu, B. S. Zhang and Y. M. Wang, Organic Chemistry, Nankai University Press, 1998 Search PubMed.
- M. C. Xu, Z. Q. Shi and B. L. He, Acta Polym. Sin., 1996, 4, 446–449 Search PubMed.
- K. S. W. Sing, D. H. Everett, R. A. W. Haul, L. Moscou, R. A. Pierotti, J. Rouquerol and T. Siemieniewska, Pure Appl. Chem., 1985, 57, 603–619 CrossRef CAS.
- B. L. He and W. Q. Huang, The Science and Education, Press of Shanghai, 1995 Search PubMed.
- N. Fontanals, M. Galià, R. M. Marcé and F. Borrull, J. Chromatogr. A, 2004, 1030, 63–68 CrossRef CAS PubMed.
- A. Baraka, P. J. Hall and M. J. Heslop, J. Hazard. Mater., 2007, 140, 86–94 CrossRef CAS PubMed.
- M. K. Moftakhar, M. R. Yaftian and M. Ghorbanloo, Int. J. Environ. Sci. Technol., 2016, 13, 1707–1722 CrossRef CAS.
- D. Mohan, K. P. Singh and V. P. Singh, J. Hazard. Mater., 2006, 135, 280–295 CrossRef CAS PubMed.
- H. C. Thomas, J. Am. Chem. Soc., 1944, 66, 1664–1666 CrossRef CAS.
- C. Costa and A. Rodrigues, Chem. Eng. Sci., 1985, 40, 983–993 CrossRef CAS.
- C. Hong, W. Zhang, B. Pan, L. Lv, Y. Han and Q. Zhang, J. Hazard. Mater., 2009, 168, 1217–1222 CrossRef CAS PubMed.
- A. Turner and M. C. Rawling, Water Res., 2002, 36, 2011–2019 CrossRef CAS PubMed.
- B. Saha and M. Streat, Ind. Eng. Chem. Res., 2005, 44, 8671–8681 CrossRef CAS.
- G. Li, S. Gao, G. Zhang and X. Zhang, Chem. Eng. J., 2014, 235, 124–131 CrossRef CAS.
- F. Liu, L. Li, B. Li, J. Gao and A. Li, CN.Pat., 101967209A, 2011.
- S. O. Shan and D. Herschlag, J. Am. Chem. Soc., 1996, 118, 5515–5518 CrossRef CAS.
- J. Huang, J. Colloid Interface Sci., 2009, 339, 296–301 CrossRef CAS PubMed.
Footnote |
| † These authors contributed equally to this work. |
| This journal is © The Royal Society of Chemistry 2017 |

