
 Open Access Article
 This Open Access Article is licensed under a Creative Commons Attribution-Non Commercial 3.0 Unported Licence
Supercritical CO2 dried chitosan nanoparticles: production and characterization
F. J. Caro Leóna,
J. Lizardi-Mendoza *a,
W. Argüelles-Monalb,
E. Carvajal-Millana,
Y. L. López Francoa and
F. M. Goycooleac
*a,
W. Argüelles-Monalb,
E. Carvajal-Millana,
Y. L. López Francoa and
F. M. Goycooleac
aCentro de Investigación en Alimentación y Desarrollo A.C., Grupo de Investigación en Biopolímeros, Carr. a La Victoria km 0.6, Hermosillo, Sonora, Mexico 83304. E-mail: jalim@ciad.mx
bCentro de Investigación en Alimentación y Desarrollo A.C., Coord. Reg. Guaymas, Polímeros Naturales, Carr. a Varadero Nacional km. 6.6, Guaymas, Sonora, Mexico 85480
cSchool of Food Science and Nutrition, University of Leeds, Woodhouse Ln, Leeds LS2 9JT, UK
First published on 15th June 2017
Abstract
Herein are reported the production and characteristics of chitosan nanoparticles that go through supercritical CO2 drying. First, chitosan nanoparticles in aqueous colloidal suspension were produced by ionic crosslinking with sodium tripolyphosphate. The produced nanoparticles have a surface charge (ζ-potential) of +27 mV and an average diameter of approximately 100 nm, measured by dynamic light scattering and field emission-scanning electron microscopy observations. The liquid phase of the nanoparticle suspension was replaced successively with ethanol and supercritical CO2 to produce dried chitosan nanoparticles finally. The main characteristics of the obtained nanoparticles were determined by diverse analytical techniques. Infrared spectroscopy, solid-state 13C nuclear magnetic resonance and X-ray diffraction studies were performed to explore possible physicochemical changes induced by the drying procedure. Also, the thermal stability of the dry chitosan nanoparticles was determined by thermogravimetric assay and dynamic scanning calorimetry. Structural properties were analyzed and compared with lyophilized nanoparticles finding that the supercritically dried chitosan nanoparticles have a surface area an order of magnitude higher. Microscopy images showed that the supercritically dried chitosan nanoparticles have a porous conglomerated structure, suggesting that there is particle aggregation through the drying process. Notwithstanding, the dry chitosan nanoparticles resuspended in the dilute acid medium readily; microscopy observations showed that the size of the resuspended particles remains in the nanoscale range. The proposed procedure is able to furnish dried chitosan nanoparticles with structural characteristics and functional properties that are appealing for their use in diverse applications.
1. Introduction
Polysaccharides are natural compounds that have been proved valuable for application in diverse areas mainly due to their structural properties, stability and biocompatibility.1 Chitosan (Cs) is a linear aminopolysaccharide composed of 2-acetamide-2-deoxy-D-glucopyranose and 2-amino-2-deoxy-D-glucopyranose (N-acetyl glucosamine and glucosamine units, respectively) linked by β(1 → 4) bonds. The amino groups distributed along the Cs chain provide it with a polycationic character, a rather unique feature among natural polymers. The attention to this biopolymer has been increasing over the years due to its availability and a set of interesting functional properties, including being biocompatible, biodegradable, non-toxic, antimicrobial, adsorptive, mucoadhesive, hemostatic, among others.2–4 Since the chemical characteristics of Cs, particularly the molecular weight and degree of acetylation, determine such functional properties it is possible to choose or adjust them according to the application.5–7 Consequently, chitosan is one of the biopolymers most extensively used to a wide range of materials such as films, gels, scaffolds, capsules or particulates.8–12The use of biopolymers, particularly chitosan, in nanotechnology began exploring biocompatible alternatives to metals, inorganic compounds and synthetic polymers that provide limited stability to incorporated proteins.13 Initially, Cs nanoparticles were obtained generating covalent bonds between the amino groups of the polysaccharide with diverse cross-linking agents (e.g. glutaraldehyde).14,15 Later, Cs nanoparticles based on ionic interactions were developed to avoid the use of potentially toxic solvents, cross-linkers or other additives.16,17 Further research explores the utility of physical interactions for simplified preparation of Cs nanoparticles.18 Over the years, different preparation processes have been proposed trying to improve the properties of the nanoparticulated systems such as size, stability, surface charge and drug loading capacity.13,14
The use of nanoparticles in colloidal suspensions faces several difficulties imposed by instability processes that could be of physical (i.e. aggregation or sedimentation) or chemical nature (i.e. hydrolysis, diffusion or reactivity). The occurrence of these problems is reflected in the limited time that nanoparticle suspensions may be stored.19 Removing the liquid phase, usually water, from the colloidal suspension is an effective way to improve the stability of the nanoparticles. Furthermore, dry nanoparticles are usually preferred in certain applications, such as drug delivery formulation for inhalation.20 The most used procedures to obtain dry chitosan nanoparticles either rely on evaporation (e.g. spray-drying) or sublimation (e.g. freeze-drying) to remove water or other solvents.19,21
The supercritical CO2 (scCO2) technology provides alternatives to produce diverse nanoparticles.22 However, the production of chitosan nanoparticles from aqueous solutions is mainly constrained by the low solubility of water in scCO2. Up to this point, some supercritical techniques depending on compatible co-solvents and specially configured equipment (e.g. supercritical anti-solvent, supercritical assisted atomization or rapid expansion of supercritical solution) have been used to obtain nanoparticles containing chitosan.23–26 Although there are reports about the use of simple scCO2 drying procedures to obtain Cs materials with different sizes and morphologies, such as monolith and microparticles,27,28 none of these materials is at the nanoscale. Usually, the materials obtained by scCO2 drying have the large specific surface area, low density and mesoporous structure, providing appealing properties for diverse applications, including active transport of bioactive substances.29–32 As a result, scCO2 drying was used to process Cs nanoparticles previously produced by ionotropic gelation. The physicochemical and structural properties of the dry Cs nanoparticles were studied and reported. The performance of the dry Cs nanoparticles on resuspension and the comparison with freeze dried Cs nanoparticles were also analyzed.
2. Experimental
The materials used and experimental procedures are described below. Also, the experimental scheme is included in Fig. 1.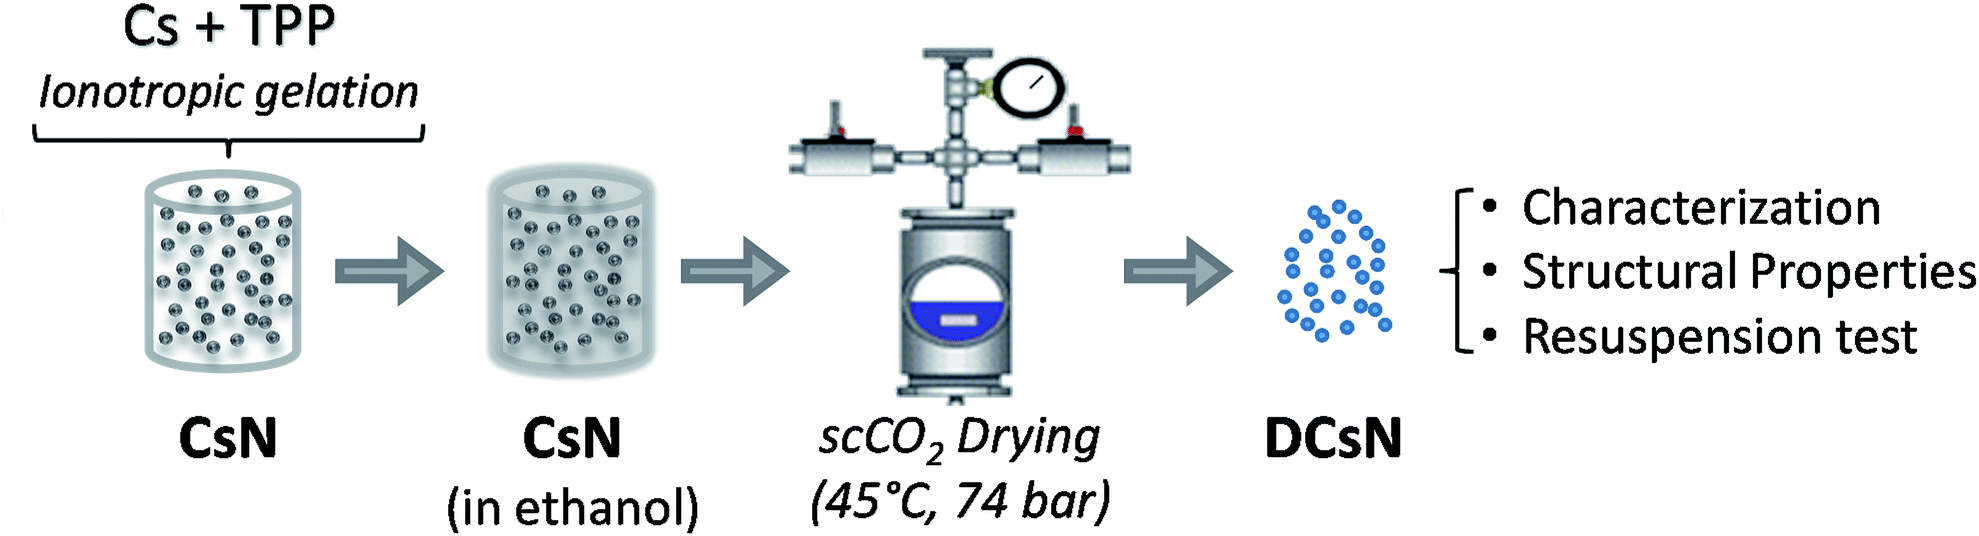 | ||
| Fig. 1 Experimental scheme for dry Cs nanoparticles production and characterization. | ||
2.1. Materials
Chitosan was provided by Primex (ChitoClear); it has a degree of acetylation (DA) of 20% and weight average molecular mass (Mw) of 250 kg mol−1 (supplier data). Tripolyphosphate pentasodium salt (TPP) practical grade was obtained from Sigma-Aldrich (St. Louis, Missouri, USA). Reagent grade solvents and chemicals, acquired from recognized commercial distributors, were used. Deionized water was utilized throughout unless stated otherwise.2.2. Nanoparticle preparation and characterization
An aqueous suspension of Cs nanoparticles (CsN) was produced by previously described ionotropic gelation method with some modifications.33 Briefly, Cs was fully dissolved (1.0 mg mL−1) in 2% v/v CH3COOH under magnetic stirring. The pH of the solution was adjusted to 6.1 with NaOH (6% w/w). The nanoparticles were spontaneously formed upon mixing 20 mL of a TPP solution (1.0 mg mL−1) into 30 mL of the Cs solution under magnetic stirring (∼400 rpm) at room temperature for 10 min. The size of the nanoparticles was determined by dynamic light scattering with a non-invasive back scattering (DLS/NIBS) technology; simultaneously, the zeta potential (ζ-potential) of the particles was determined by laser Doppler electrophoresis with phase analysis light scattering (M3-PALS) using a Zetasizer Nano-ZS (ZEN 3600, Malvern instruments, Worcestershire, UK). The morphology of the CsN was studied by field emission-scanning electron microscopy (FE-SEM) using a SU 8000 Hitachi microscopy. To this end, 10 μL of nanoparticles suspension was dropped on a copper grid coated with a Formvar membrane, allowed to stand for 5 minutes, dried, and coated with Au/Pd.2.3. Nanoparticle drying
The CsN were subjected to scCO2 drying as follows. First, the aqueous medium of the nanoparticles was replaced with ethanol transferring the nanoparticles to 25, 50, 75 and 100% ethanol successively. Then, the ethanol was exchanged with CO2 in supercritical conditions in a pressurized vessel (74 bar, 45 °C). Finally, the CO2 was slowly released leaving dry Cs nanoparticles (DCsN).2.4. Physicochemical characterization
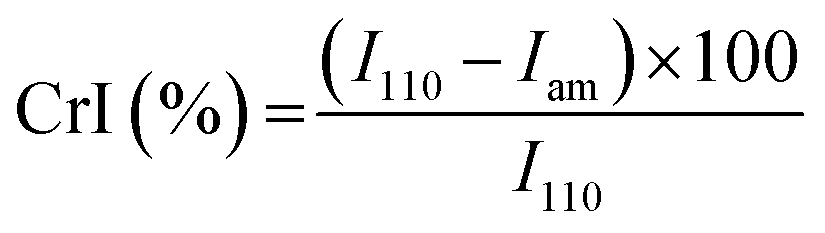
The main characteristics of the pristine Cs and the DCsN were determined using several techniques. Solid-state cross-polarization magic angle spinning 13C nuclear magnetic resonance (CP/MAS 13C-NMR) was performed in a Bruker Avance TM 400WB equipped with a wide-mouth superconducting magnet (89 mm) operating at 9.4 tesla. The experimental conditions were: 4.4 μs width 90° pulse with 4 s repetition time, cross-polarization contact time of 1 ms and spectra accumulation of 2000 scans, the samples were contained in a cylindrical ceramic rotor. Attenuated total reflection Fourier transform infrared (ATR-FTIR) spectra were collected on a Perkin-Elmer Spectrum One spectrophotometer; using 64 co-added scans with 4 cm−1 resolution over a spectral range of 500–4000 cm−1. Thermogravimetric analysis (TGA) was performed on a Q500 thermogravimetric analyzer (TA instruments), heating from 20 °C up to 800 °C at 10 °C min−1 rate, under nitrogen flow. Differential scanning calorimetry (DSC) was performed on DSC 7 calorimeter (Perkin Elmer) with two heating runs, first from −30 °C up to 190 °C and the second one from −30 °C up to 400 °C. X-ray diffraction (XRD) experiments were carried out on a Bruker D8 Advance diffractometer equipped with Cu Kα radiation. The angle range (2θ) was scanned from 2° to 40° at a step size of 0.02° and the working voltage, and current were 45 kV and 100 mH, respectively. The crystallinity index (CrI) was calculated from the corresponding XRD diffractogram using the following formula:where I110 is the maximum intensity of the 110 plane at 2θ = 20°, and Iam is the intensity of the amorphous diffraction at 2θ = 16°.34
2.5. Structural characterization
Specific surface area of dried nanoparticles was determined by nitrogen sorption on a Monosorb Surface Area Analyser MS-13 (Quantachrome). The samples were degassed at 80 °C for 18 h under vacuum prior to analysis. Six points in the range of relative pressure (P/P0) from 0.05 to 0.3 were used to calculate the surface areas by Brunauer–Emmett–Teller (BET) method.2.6. Resuspension tests
A sample of DCsN was resuspended (0.5 mg mL−1) in 2% v/v CH3COOH under constant vigorous magnetic stirring. Size and ζ-potential of the systems were measured by DLS, and morphological study of FE-SEM was performed as described previously.3. Results and discussion
3.1. Cs nanoparticles preparation and characterization
Under suitable conditions (e.g. Cs characteristics, reagents concentration, pH, temperature, stirring, etc.) the addition of TPP to a Cs solution produces nanoparticles due to the interaction of the positively charged polymer chains and the negatively charged TPP molecules.17 The use of TPP as chitosan crosslinker is a reliable method to produce stable nanoparticles in relatively large quantities, minimizing safety concerns. This method has been commonly used to obtain Cs nanoparticles achieving lower particle size of about 100 nm and positive ζ-potential.33,35,36 In accordance with this, the size of the CsN, measured by DLS, was 97 ± 46 nm with a polydispersity index (PDI) of 0.23, and ζ-potential of +27 ± 4 mV. The positive surface charge of the nanoparticles is related to the portion of amino groups of Cs not linked with TPP.36 Apparently, the CsN have a spherical shape and smooth surface, as can be observed on the FE-SEM image (Fig. 2). From measurements on micrographs, the diameter of the particles is in a range of 70 to 180 nm (average 117 ± 42 nm, PDI 0.36, n = 40), which is congruent with the DLS data, taking into account the variance associated to these measurements. The particles that were processed by scCO2 drying were similar to those previously reported in the literature.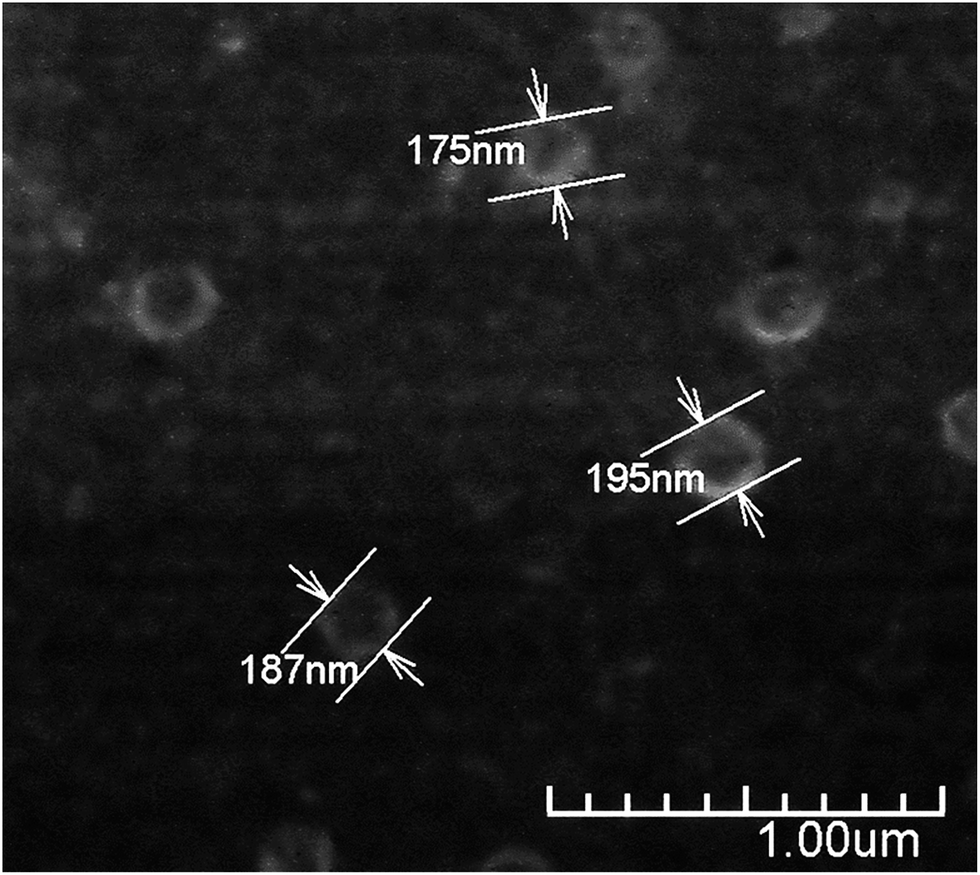 | ||
Fig. 2 FE-SEM image of the CsN. Magnification of 30![[thin space (1/6-em)]](https://www.rsc.org/images/entities/char_2009.gif) 000×, SE detector, 1.5 kV. 000×, SE detector, 1.5 kV. | ||
3.2. DCsN characteristics
The obtained DCsN were subjected to diverse analytical techniques in order to investigate the possible physicochemical and structural changes that the drying process could induce in the material.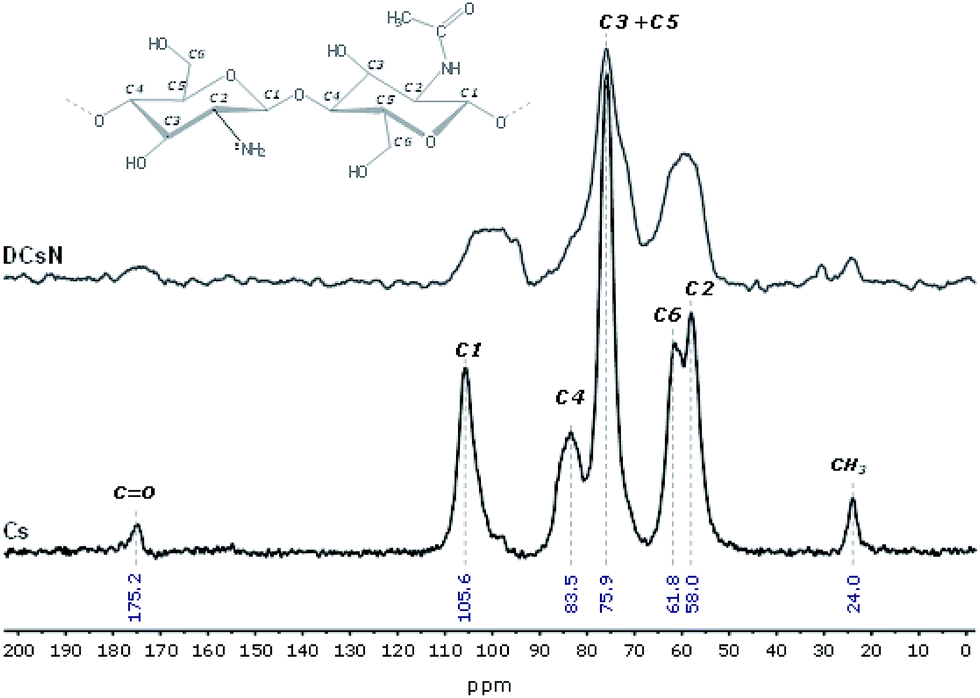 | ||
| Fig. 3 CP/MAS 13C-NMR spectra of Cs and DCsN. | ||
![[double bond, length as m-dash]](https://www.rsc.org/images/entities/char_e001.gif) O and NH2 vibrations bands (1650 and 1584 cm−1, respectively) are shifted to lower wavenumbers. Furthermore, the band at 1632 cm−1 is also broader which suggest different molecular environment in the DCsN structure due to intermolecular interactions.40 Finally, the bands observed at 1218 cm−1 and 892 cm−1 in the DCsN spectra are attributed to PO stretching vibration and P–O–P asymmetric stretching vibration, which also appear in the TPP spectrum, demonstrating its presence in the nanoparticles.40
O and NH2 vibrations bands (1650 and 1584 cm−1, respectively) are shifted to lower wavenumbers. Furthermore, the band at 1632 cm−1 is also broader which suggest different molecular environment in the DCsN structure due to intermolecular interactions.40 Finally, the bands observed at 1218 cm−1 and 892 cm−1 in the DCsN spectra are attributed to PO stretching vibration and P–O–P asymmetric stretching vibration, which also appear in the TPP spectrum, demonstrating its presence in the nanoparticles.40
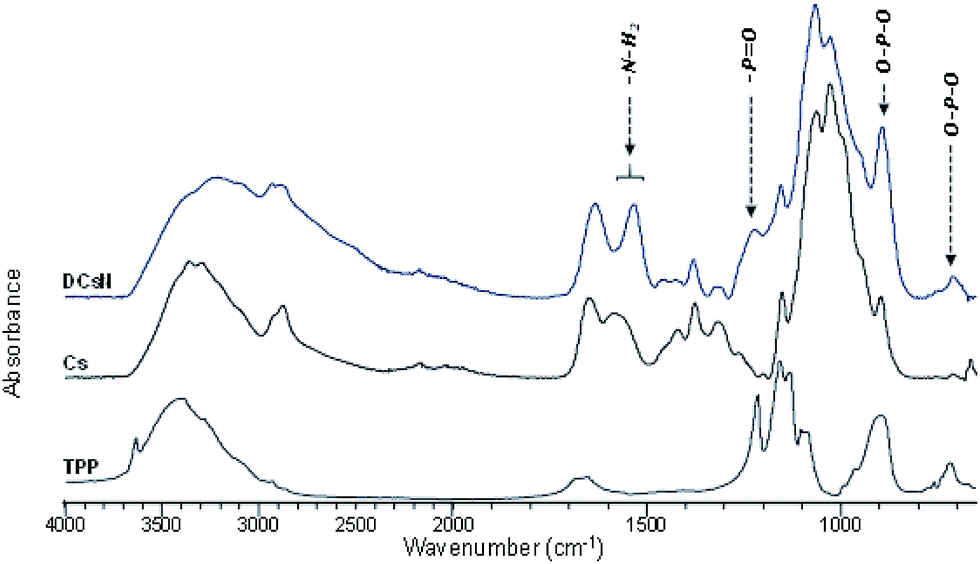 | ||
| Fig. 4 ATR-FTIR spectra of DCsN, Cs, and TPP. | ||
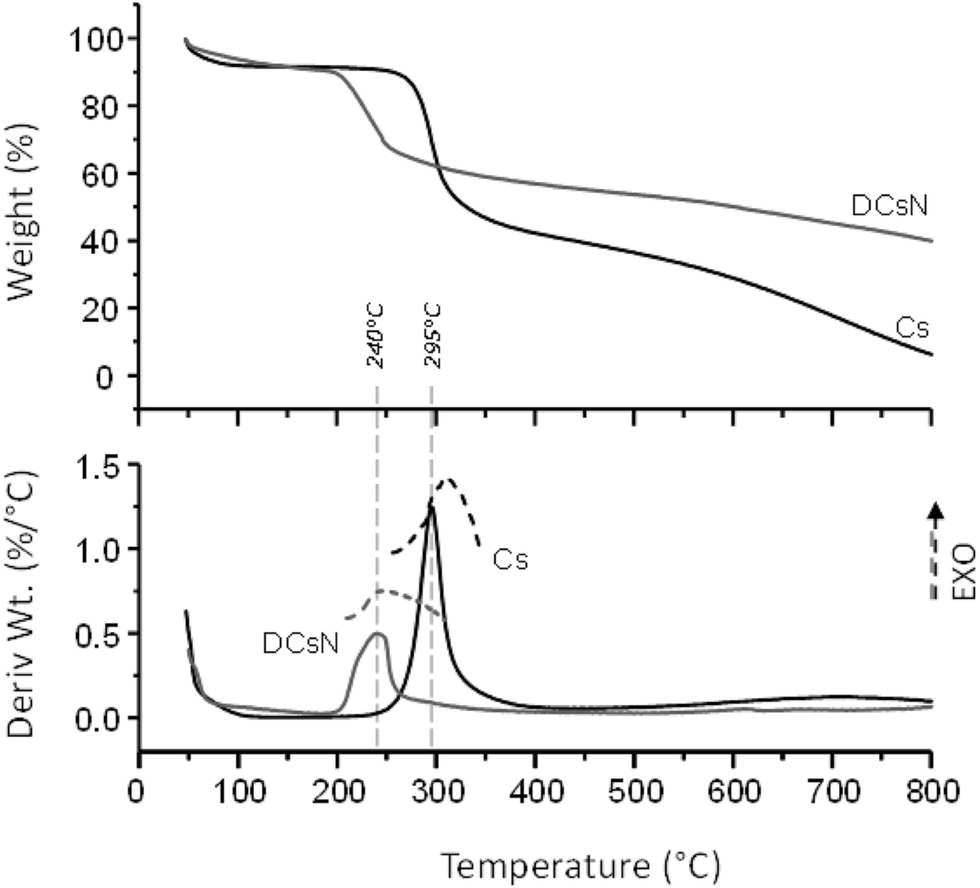 | ||
| Fig. 5 TGA, DTG and DSC curves (dash lines) of Cs and DCsN. | ||
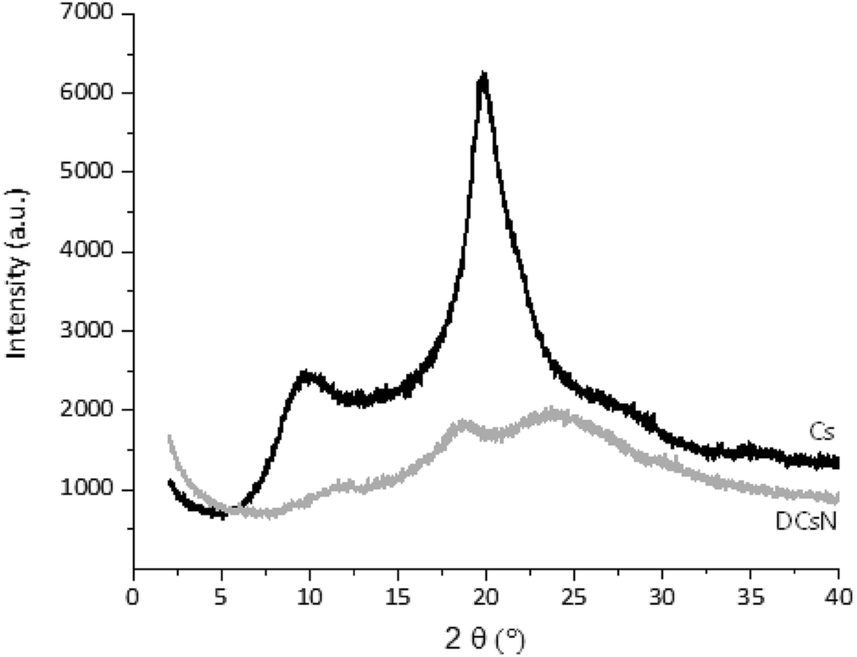 | ||
| Fig. 6 XRD diffractograms of Cs and DCsN. | ||
3.3. DCsN structural features
In order to shed light on the influence of scCO2 drying on the morphology of the DCsN, a sample of lyophilized Cs nanoparticles (LCsN) was obtained from CsN. The freezing process was carried out as fast as possible, in liquid nitrogen, to induce the formation of smaller and uniform ice crystals. The lyophilization is the most used technique to obtain dry nanoparticles, mainly in order to facilitate their characterization and storage.45The specific surface area of the dry nanoparticles (DCsN and LCsN) was measured by N2 sorption method using the BET (Brunauer–Emmett–Teller) model. In the adsorption isotherms (Fig. 7), it is possible to observe that DCsN display a type IV isotherm with hysteresis loop. This behavior has been associated with capillary condensation into mesopores and the limiting uptake over a range of high relative pressure.46 Whereas, the LCsN produce a type II adsorption isotherm that is associated to macroporous materials.46 Moreover, the DCsN have a specific surface area (10.76 m2 g−1) an order of magnitude higher than LCsN (1.97 m2 g−1).
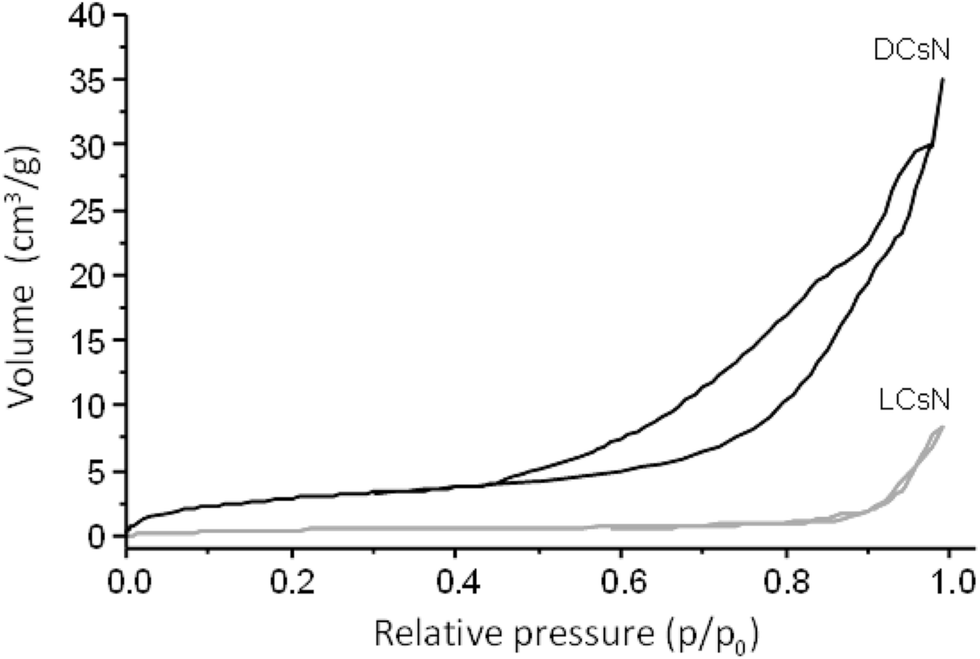 | ||
| Fig. 7 N2 adsorption–desorption isotherms of DCsN and LCsN. | ||
These results indicate structural differences among DCsN and LCsN that could be attributed to changes induced by their respective drying procedures based in dissimilar principles. Lyophilization tends to modify previously formed structures, primarily due to ice crystals formation and solutes concentration effects.47 As consequence of the multiple disruptions caused by the high concentration of ice crystals in the suspension, there is considerable loss of the intrinsic structure of the gel nanoparticles. Usually, freeze-dried materials resemble macroscopic porous structures made of xerogel films. Alternatively, the scCO2 drying technology is based on the replacement of the fluid phase of a colloidal system (e.g. a gel or particle suspensions) with CO2 in conditions over its critical point, and then the pressure is reduced to release the CO2 as a gas. Indeed, the network structure formed by the ionic gelation of Cs with TPP could be modified due to the successive replacement of liquid phase, from aqueous to ethanol, with different interaction with the polymer. However, at the drying stage, when the liquid phase (scCO2) turns into gas, the surface tension is negligible minimizing the effects over previously formed network structure. The scCO2 drying procedure reduces to a minimum the negative effects of surface tension over structural features normally producing mesoporous and low-density materials.48,49
Some of the mentioned structural features could be observed in the FE-SEM images of the different dry nanoparticles (Fig. 8). At the higher magnification, it is possible to perceive that the DCsN (Fig. 8B) form a porous structure by aggregated individual nanoparticles. It would appear that the liquid phase replacement procedure cause particle aggregation. Similar structural features have been seen in scCO2 dried materials from Cs chemical and physical gels.27,29 Also in agreement with the previous results, the LCsN materials appear to be made up by film-like structures forming macroporous scattered pieces (Fig. 8C and D).
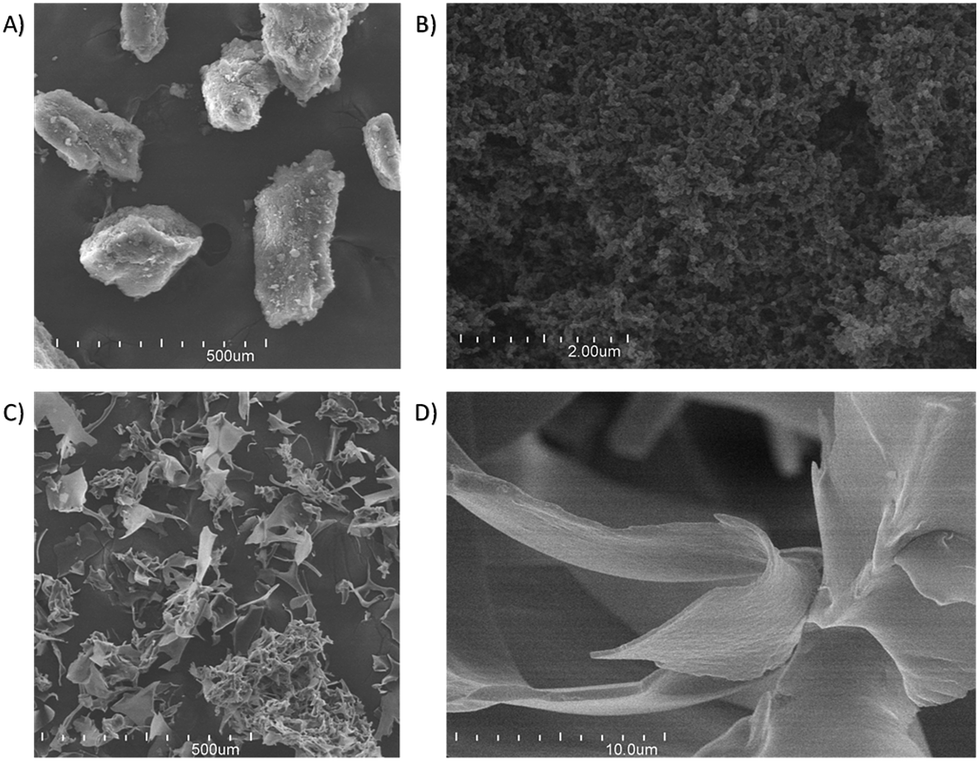 | ||
| Fig. 8 FE-SEM images of: (A) DCsN at 100× magnification; (B) DCsN at 20000× mag.; (C) LCsN at 100× mag.; (D) LCsN at 5000× mag. All images were acquired with SE detector and 20.0 kV. | ||
3.4. Resuspension of DCsN
DCsN resuspension tests, in dilute acid (CH3COOH 2% v/v) and pure water, were carried out to explore the functional behavior of the dry nanoparticles and envisage the possible applications of this material. When DCsN are mixed into acidic media, the particles were solvated, and an opalescent suspension was achieved. This indicates that the ionic crosslinks stand the acid conditions (pH ∼ 4) hindering the Cs dissolution process. A different outcome was observed in pure water where a considerable portion of the material remains aggregated. According to DLS measurements, the average hydrodynamic diameter of the resuspended DCsN in diluted acid was 149 ± 61 nm (PDI = 0.41) with a ζ-potential value of +52 ± 6 mV. As ζ-potential values above +50 mV are associated to colloidal systems with good stability,50 it is reasonable to expect that DCsN forms stable suspensions in slightly acidic aqueous media. Concerning to the increase of ζ-potential, compared with CsN, this may be due to molecular arrangements induced by the protonation of available amino groups of Cs chains in acidic medium. However, as can be observed in the FE-SEM image (Fig. 9) apparently the resuspended particles are formed by aggregated individual nanoparticles. The apparent diameter of the acid resuspended DCsN was 73 ± 21 nm, measured from SEM images. Similar size reduction has been observed in other materials dried by scCO2 treatment, mainly related to molecular interactions and rearrangements in the gels during the change of liquid phase.28,30 The aggregates of reduced size nanoparticles reach higher surface charge when are resuspended in an acidic media, however this charge is not enough to separate them completely.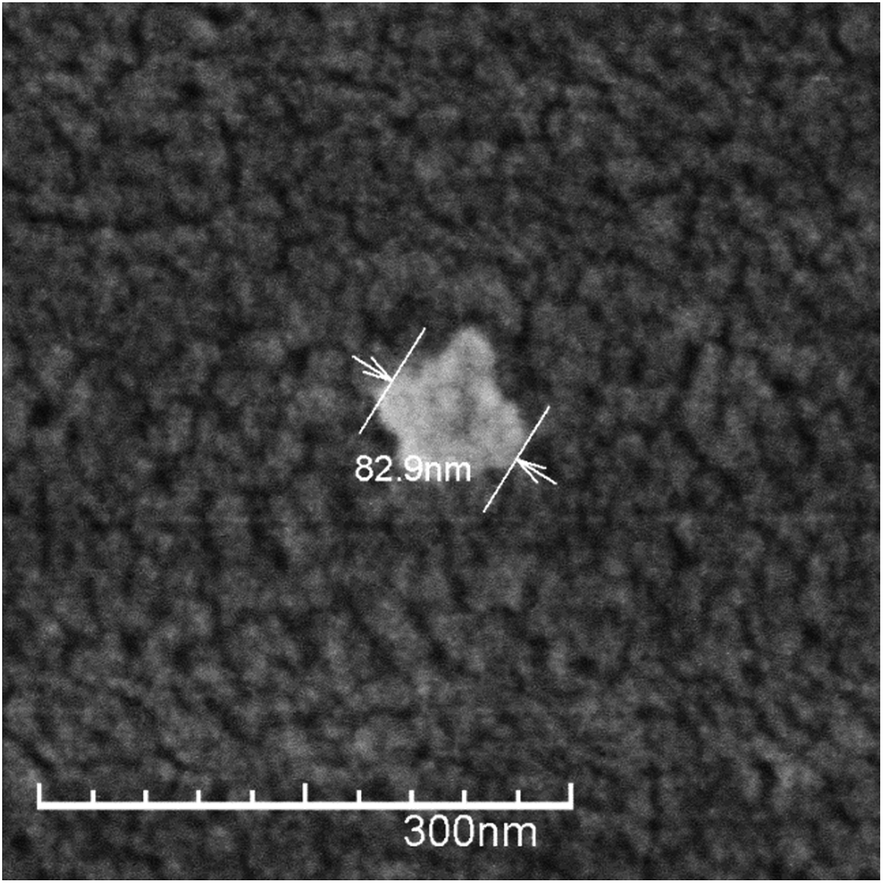 | ||
| Fig. 9 FE-SEM image of a re-suspended DCsN particle. Magnification of 150000×; SE detector, 1.5 kV. | ||
4. Conclusions
Drying Cs nanoparticles by simple supercritical CO2 drying procedure was possible. Initially, spherical Cs nanoparticles were produced by ionotropic gelation with an average of approximately 97 nm of hydrodynamic diameter and positive surface charge in water suspension. The proposed drying procedure includes a liquid phase replacement process (i.e. water to ethanol) that apparently generates particles aggregation. As a consequence a conglomerated porous structure is observed in the DCsN. The further structural analysis demonstrates that the scCO2 dying produces materials with higher surface area compared with the lyophilized CsN. The physicochemical characterization indicates that the scCO2 dying does not affect the chemical structure of the polysaccharide and the thermal properties observed are related to the ionic crosslinking induced by the TPP. The DCsN were effectively dispersed in diluted acidic media resulting in stable colloidal suspension. These results open the possibility to produce dry chitosan nanomaterials with the extended surface area, porous structure and good resuspension capacity using an uncomplicated and environmentally safe scCO2 dying technology. It is estimated that materials with such properties result appealing for diverse application. Studies to explore the possibilities to use DCsN type materials as bioactive compounds carriers are in progress.Acknowledgements
The authors want acknowledge the financial support of CONACYT through the Project CB-2011-01-169626 and the fellowship DC2013-256 for JCL. Similarly it is recognized the valuable input of the technical staff of the Biopolymer Research Group of CIAD.References
- M. Rinaudo, Prog. Polym. Sci., 2006, 31, 603–632 CrossRef CAS
.
- D. Bento, H. F. Staats, T. Gonçalves and O. Borges, Eur. J. Pharm. Biopharm., 2015, 93, 149–164 CrossRef CAS PubMed
- S. Rodrigues, M. Dionísio, C. R. López and A. Grenha, J. Funct. Biomater., 2012, 3, 615–641 CrossRef CAS PubMed
- Y. Zhou, S. Liu, H. Peng, L. Yu, B. He and Q. Zhao, Int. Immunopharmacol., 2015, 28, 34–43 CrossRef CAS PubMed
- T. Kean and M. Thanou, Adv. Drug Delivery Rev., 2010, 62, 3–11 CrossRef CAS PubMed
- J. Lizardi-Mendoza, W. M. Argüelles Monal and F. M. Goycoolea Valencia, in Chitosan in the Preservation of Agricultural Commodities, ed. Silvia Bautista-Baños, G. Romanazzi and A. Jiménez-Aparicio, Academic Press, San Diego, 2016, pp. 3–31 Search PubMed
- C. K. S. Pillai, W. Paul and C. P. Sharma, Prog. Polym. Sci., 2009, 34, 641–678 CrossRef CAS
- V. T. Tchemtchoua, G. Atanasova, A. Aqil, P. Filée, N. Garbacki, O. Vanhooteghem, C. Deroanne, A. Noël, C. Jérome, B. Nusgens, Y. Poumay and A. Colige, Biomacromolecules, 2011, 12, 3194–3204 CrossRef CAS
- F. Croisier and C. Jérôme, Eur. Polym. J., 2013, 49, 780–792 CrossRef CAS
- Z. Fülöp, P. Saokham and T. Loftsson, Int. J. Pharm., 2014, 472, 282–287 CrossRef
- V. Hamilton, Y. Yuan, D. A. Rigney, B. M. Chesnutt, A. D. Puckett, J. L. Ong, Y. Yang, W. O. Haggard, S. H. Elder and J. D. Bumgardner, Polym. Int., 2007, 56, 641–647 CrossRef CAS
- K. Murakami, H. Aoki, S. Nakamura, S. Nakamura, M. Takikawa, H. Motoaki, S. Kishimoto, H. Hattori, Y. Tanaka, T. Kiyosawa, Y. Sato and M. Ishihara, Biomaterials, 2010, 31, 83–90 CrossRef CAS PubMed
- M. Garcia-Fuentes and M. J. Alonso, J. Controlled Release, 2012, 161, 496–504 CrossRef CAS PubMed
- A. Grenha, J. Drug Targeting, 2012, 20, 291–300 CrossRef CAS PubMed
- Y. Ohya, M. Shiratani, H. Kobayashi and T. Ouchi, J. Macromol. Sci., Part A: Pure Appl.Chem., 1994, 31, 629–642 CrossRef
- F. Sonvico, A. Cagnani, A. Rossi, S. Motta, M. T. Di Bari, F. Cavatorta, M. J. Alonso, A. Deriu and P. Colombo, Int. J. Pharm., 2006, 324, 67–73 CrossRef CAS PubMed
- P. Calvo, C. Remuñán-López, J. L. Vila-Jato and M. J. Alonso, J. Appl. Polym. Sci., 1997, 63, 125–132 CrossRef CAS
- H. Tokumitsu, H. Ichikawa and Y. Fukumori, Pharm. Res., 1999, 16, 1830–1835 CrossRef CAS
- W. Abdelwahed, G. Degobert, S. Stainmesse and H. Fessi, Adv. Drug Delivery Rev., 2006, 58, 1688–1713 CrossRef CAS PubMed
- A. Grenha, B. Seijo and C. Remuñán-López, Eur. J. Pharm. Sci., 2005, 25, 427–437 CrossRef CAS PubMed
- L. T. K. Ngan, S.-L. Wang, Đ. M. Hiep, P. M. Luong, N. T. Vui, T. M. Đinh and N. A. Dzung, Res. Chem. Intermed., 2014, 40, 2165–2175 CrossRef CAS
- P. Sheth, H. Sandhu, D. Singhal, W. Malick, N. Shah and M. S. Kislalioglu, Curr. Drug Delivery, 2012, 9, 269–284 CrossRef CAS
- N. Hijazi, E. Rodier, J.-J. Letourneau, H. Louati, M. Sauceau, N. Le Moigne, J.-C. Benezet and J. Fages, J. Supercrit. Fluids, 2014, 95, 118–128 CrossRef CAS
- S. M. Ghoreishi, A. Hedayati and M. Kordnejad, J. Supercrit. Fluids, 2016, 111, 162–170 CrossRef CAS
- H.-T. Wu, H.-K. Lee, H.-C. Chen and L.-J. Chien, Chem. Eng. Res. Des., 2015, 104, 615–625 CrossRef CAS
- R. P. Cabral, A. M. L. Sousa, A. S. Silva, A. I. Paninho, M. Temtem, E. Costa, T. Casimiro and A. Aguiar-Ricardo, J. Supercrit. Fluids, 2016, 116, 26–35 CrossRef CAS
- H. Ennajih, R. Bouhfid, E. M. Essassi, M. Bousmina and A. El Kadib, Microporous Mesoporous Mater., 2012, 152, 208–213 CrossRef CAS
- R. Valentin, B. Bonelli, E. Garrone, F. Di Renzo and F. Quignard, Biomacromolecules, 2007, 8, 3646–3650 CrossRef CAS PubMed
- X. Chang, D. Chen and X. Jiao, J. Phys. Chem. B, 2008, 112, 7721–7725 CrossRef CAS PubMed
- C. A. García-González, M. Alnaief and I. Smirnova, Carbohydr. Polym., 2011, 86, 1425–1438 CrossRef
- S. Takeshita and S. Yoda, Chem. Mater., 2015, 27, 7569–7572 CrossRef CAS
- R. Zarzycki, Z. Modrzejewska, M. Dorabialska, G. Rogacki and A. Wojtasz-Pająk, Drying Technol., 2009, 27, 1370–1378 CrossRef CAS
- F. M. Goycoolea, G. Lollo, C. Remuñán-López, F. Quaglia and M. J. Alonso, Biomacromolecules, 2009, 10, 1736–1743 CrossRef CAS
- A. B. Vishu Kumar, M. C. Varadaraj, R. G. Lalitha and R. N. Tharanathan, Biochim. Biophys. Acta, Gen. Subj., 2004, 1670, 137–146 CrossRef CAS
- H. Zhang, Q. Huang, Z. Huang, T. Liu and Y. Li, Int. J. Pharm., 2015, 479, 212–218 CrossRef CAS
- Q. Gan, T. Wang, C. Cochrane and P. McCarron, Colloids Surf., B, 2005, 44, 65–73 CrossRef CAS PubMed
- H. Saito, R. Tabeta and K. Ogawa, Macromolecules, 1987, 20, 2424–2430 CrossRef CAS
- K. Ogawa, T. Yui and K. Okuyama, Int. J. Biol. Macromol., 2004, 34, 1–8 CrossRef CAS
- J. Brugnerotto, J. Lizardi, F. M. Goycoolea, W. Argüelles-Monal, J. Desbrieres and M. Rinaudo, Polymer, 2001, 42, 3569–3580 CrossRef CAS
- S. Walke, G. Srivastava, M. Nikalje, J. Doshi, R. Kumar, S. Ravetkar and P. Doshi, Carbohydr. Polym., 2015, 128, 188–198 CrossRef CAS
- C. Peniche-Covas, W. Argüelles-Monal and J. San Román, Polym. Degrad. Stab., 1993, 39, 21–28 CrossRef CAS
- D. Fernández-Quiroz, Á. González-Gómez, J. Lizardi-Mendoza, B. Vázquez-Lasa, F. M. Goycoolea, J. San Román and W. M. Argüelles-Monal, Carbohydr. Polym., 2015, 134, 92–101 CrossRef
- L. S. Guinesi and E. T. Gomes Cavalheiro, Carbohydr. Polym., 2006, 65, 557–561 CrossRef CAS
- Y. Zhang, C. Xue, Y. Xue, R. Gao and X. Zhang, Carbohydr. Res., 2005, 340, 1914–1917 CrossRef CAS
- P. Fonte, S. Reis and B. Sarmento, J. Controlled Release, 2016, 225, 75–86 CrossRef CAS PubMed
- K. S. W. Sing, Pure Appl. Chem., 2009, 57, 603–619 Search PubMed
- F. Franks, Eur. J. Pharm. Biopharm., 1998, 45, 221–229 CrossRef CAS PubMed
- M. Alshrah, M.-P. Tran, P. Gong, H. E. Naguib and C. B. Park, J. Colloid Interface Sci., 2017, 485, 65–74 CrossRef CAS PubMed
- R. Valentin, K. Molvinger, F. Quignard and D. Brunel, New J. Chem., 2003, 27, 1690–1692 RSC
- S. Bhattacharjee, J. Controlled Release, 2016, 235, 337–351 CrossRef CAS
| This journal is © The Royal Society of Chemistry 2017 |