 Open Access Article
Surface spermidine functionalized PEGylated poly(lactide-co-glycolide) nanoparticles for tumor-targeted drug delivery†
Jianming Li a,
Juan Maoa,
Jing Tangb,
Guo Lia,
Fengling Fanga,
Yana Tanga and
Jinsong Ding*a
aXiangya School of Pharmaceutical Sciences, Central South University, Changsha 410013, Hunan, China. E-mail: dingjs0221@163.com; Fax: +86-731-82650442; Tel: +86-731-82650250
bDepartment of Pharmaceutics, Changsha Medical University, Changsha 410219, Hunan, China
First published on 26th April 2017
Abstract
Development of targeted drug delivery systems for tumor therapy provides an effective approach to minimize the side effects originating from arbitrary in vivo drug distribution after systemic administration. In this study, we reported DOX-loaded PEG–PLGA nanoparticles with the surface modified with spermidine (SPD) (SPD–DOX-NPs) for targeted delivery of DOX into tumor cells, which benefits from the polyamine transport system (PTS) on the tumor cell surface. The as-prepared NPs showed a typical spherical morphology with about 150 nm diameter and near electric neutrality of surface charge. The in vitro drug release displayed a sustained release profile. Characterization by fluorescence microscopy and flow cytometry revealed that the cellular uptake of SPD–DOX-NPs in A549 cells depends on SPD content on the surface of the particles. The uptake efficiency can be further increased by adding eflornithine (DMFO) and competitively inhibited by free SPD pre-treatment. These results collectively suggest that PTS is essential for particle internalization. Furthermore, the SPD–DOX-NPs exhibited significantly enhanced cytotoxicity towards A549 cells than the free DOX solution and SPD-free DOX-NPs. Taken together, our results demonstrate that SPD-functionalized nanoparticles are a potential candidate for targeted delivery of drugs into tumor cells.
1. Introduction
Cancer is a major public health problem with increasing incidence and mortality.1,2 While significant efforts have been made globally for the treatment of cancer over the past 50 years, it still remains the second-leading cause of death worldwide.3 Although chemotherapeutic agents are commonly used in the clinic to treat cancer, the inevitable side effects have required the improvement of antineoplastic therapies to prolong the survival time of patients in medical intervention.4With the development of nanomedicine, the past two decades have witnessed a rapid development of nanotechnology-based drug delivery systems as they provide an alternative therapy for progressive and long-term delivery of therapeutic agents, such as liposomes, micelles, solid lipid nanoparticles (SLNs) or polymeric nanoparticles.5,6 The design methodology of novel drug delivery systems is considered to be the key part of targeting and localized delivery of chemotherapy drugs to the cancer tissues. Compared with conventional formulations, the therapeutic agents encapsulated in nanoparticles possess characteristics of desired solubility, enhanced bioavailability and selective biodistribution endowed by their carriers. Among the carriers, the nanoparticles (NPs) prepared from poly (lactide-co-glycolide) (PLGA) have been extensively used due to its biocompatible, biodegradable and nontoxicity, which have also been demonstrated to be advantageous for sustained and controlled drug release with clinical safety.7,8 Further modification of such particles with poly (ethylene glycol) (PEG) could enhance the systemic retention, since it can reduce nonspecific protein adsorption, opsonization and subsequent clearance by the reticuloendothelial system (RES). As a result, the improved drug accumulation within tumor tissues can be expected via the enhanced permeability and retention (EPR) effects.9,10
However, one major limitation of PLGA-NPs is that it cannot differentiate the cancerous cells from normal cells. Recent advances have indicated that the particles with surface modified by targeting ligands, such as aptamers, antibodies, peptides and integrin, could actively internalize into cancerous via ligands/acceptors (overexpressed on tumor cells) interactions.11–13 Herein, we focused on a specific type of ligand, namely polyamines (PAs), such as putrescine (PUT), spermine (SPM) and spermidine (SPD), which are small molecular aliphatic amines involved in cell cycle, apoptosis and autophagy.14
It is known that various tumor cells, such as neuroblastoma, leukemia, breast cancer, lung cancer and melanomas, overexpress the polyamine transport system (PTS, a specific energy-dependent transporter or ion channel) on their surface to transport exogenous PAs into cells.15,16 It shows that PTS may offer an alternative targeting delivery strategy as PAs (or PAs analogue)-drug conjugates can selectively penetrate into tumor cells via the molecular recognition events involved in polyamine skeleton. An additional benefit is that chemical conjugation of PAs could effectively improve the solubility of chemotherapeutics.17–19 However, the PTS mediated antineoplastic drug loaded targeting delivery systems have yet been explored. As PAs possess extraordinary binding affinity and specificity to PTS,20 we reason that PAs-modified NPs holds great potential as a promising vector for anti-tumor therapy.
Doxorubicin (DOX), an anthracycline derivative, is one of the most successful first-line chemotherapeutic anticancer drugs with broad spectrum effectiveness in clinical application against multiple cancers.21 However, the significant curative effect of DOX is often associated with unrestricted biodistribution and undesirable systemic toxicity to healthy tissues.22,23 Therefore, the design of targeted DOX delivery systems to inhibit the low bioavailability, rapid drug clearance and serious side effects (such as cardiotoxicity) is critically desired.24
In this study, we utilized SPD, a natural polyamine with moderate chain length and positive charge, as targeting ligand to prepare PAs conjugated, DOX-loaded PEG–PLGA (SPD–DOX-NPs) nanoparticles, aiming to actively deliver DOX to cancer cells via the specific binding between SPD and PTS. The constructed SPD-modified nanoparticles were characterized with average particle size, zeta potential, surface morphology, drug encapsulation efficiency (EE), drug loading capacity (LC) and in vitro drug release, respectively. Cellular uptake and in vitro antitumor efficacy of SPD–DOX-NPs for A549 cancer cells were then investigated.
2. Materials and methods
2.1 Materials
Carboxyl-terminated poly(D,L-lactic-co-glycolic acid) (PLGA–COOH) (average Mw: 20![[thin space (1/6-em)]](https://www.rsc.org/images/entities/char_2009.gif) 000 Da; lactic acid: glycolic acid = 50
000 Da; lactic acid: glycolic acid = 50![[thin space (1/6-em)]](https://www.rsc.org/images/entities/char_2009.gif) :
:![[thin space (1/6-em)]](https://www.rsc.org/images/entities/char_2009.gif) 50) was purchased from Daigang Biomaterial Co., Ltd. (Jinan, China). NH2–PEG–COOH (Mw: 3400) was obtained from Seebio Biotech, Co., Ltd. (Shanghai, China). N-(3-Dimethylaminopropyl)-N′-ethylcarbodiimide hydrochloride (EDC·HCl) and N-hydroxysuccinimide (NHS) were obtained from Qiyun Biotech, Co., Ltd. (Guangzhou, China). Spermidine (SPD), poly(vinyl alcohol) (PVA, 87–90% hydrolyzed, Mw: 30
50) was purchased from Daigang Biomaterial Co., Ltd. (Jinan, China). NH2–PEG–COOH (Mw: 3400) was obtained from Seebio Biotech, Co., Ltd. (Shanghai, China). N-(3-Dimethylaminopropyl)-N′-ethylcarbodiimide hydrochloride (EDC·HCl) and N-hydroxysuccinimide (NHS) were obtained from Qiyun Biotech, Co., Ltd. (Guangzhou, China). Spermidine (SPD), poly(vinyl alcohol) (PVA, 87–90% hydrolyzed, Mw: 30![[thin space (1/6-em)]](https://www.rsc.org/images/entities/char_2009.gif) 000–70
000–70![[thin space (1/6-em)]](https://www.rsc.org/images/entities/char_2009.gif) 000), N,N-diisopropylethylamine (DIEA) and 3-[4,5-dimethylthiazol-2-yl]-2,5-diphenyl tetrazolium bromide (MTT) were obtained from Sigma-Aldrich (MO, USA). 1,5-Bis-Boc-1,5,10-spermidine (Boc-SPD) was purchased from Chem-Impex Int'l. Inc., (IN, USA). Doxorubicin (DOX) was obtained from Macklin Biotech, Co., Ltd. (Shanghai, China). All the other solvents were analytical or chromatographic grade.
000), N,N-diisopropylethylamine (DIEA) and 3-[4,5-dimethylthiazol-2-yl]-2,5-diphenyl tetrazolium bromide (MTT) were obtained from Sigma-Aldrich (MO, USA). 1,5-Bis-Boc-1,5,10-spermidine (Boc-SPD) was purchased from Chem-Impex Int'l. Inc., (IN, USA). Doxorubicin (DOX) was obtained from Macklin Biotech, Co., Ltd. (Shanghai, China). All the other solvents were analytical or chromatographic grade.
Cell lines: A549 cells were obtained from XiangYa Central Experiment Laboratory (Hunan, China). Dubelcco's Modified Eagle's Medium (DMEM), fetal bovine serum (FBS) were purchased from GIBCO (Grand Island, NY, USA). Trypsine–EDTA, penicillin–streptomycin solution and 4′,6-diamidino-2-phenylindole (DAPI) were provided by Solarbio Biotech, Co., Ltd. (Beijing, China).
2.2 Synthesis of PLGA–PEG–SPD block copolymer
PLGA–COOH (4 g, 0.2 mmoL) dissolved in dichloromethane (DCM, 10 mL) was activated by EDC (307 mg, 1.6 mmoL) and (NHS, 186 mg, 1.6 mmoL) at RT under nitrogen atmosphere for 12 h. The resultant solution was precipitated and repeatedly washed in ice-cold diethyl ether and diethyl ether–methanol (7/3, v/v), respectively. After dried under vacuum, the activated PLGA-NHS (1 g, 0.05 mmoL) dissolved in DCM (4 mL) was followed by the addition of DIEA (26 mg, 0.2 mmoL) and NH2–PEG–COOH (210 mg, 0.06 mmoL) dissolved in DCM (2 mL) in a drop-wise manner with gentle stirring. After reacted at RT under nitrogen atmosphere for 24 h, the reaction was precipitated and repeatedly washed in ice-cold diethyl ether and diethyl ether–methanol (7/3, v/v), respectively. And the di-block copolymer PLGA–PEG–COOH was collected and dried.SPD-functionalized copolymer SPD–PEG–PLGA was synthesized by conjugating Boc-SPD to PLGA–PEG–COOH. Briefly, PLGA–PEG–COOH (2 g, 0.1 mmoL) was activated by above EDC/NHS system for 12 h. After purified and dried, the PLGA–PEG–NHS (1 g, 0.05 mmoL) dissolved in DCM (4 mL) was followed by the addition of DIEA (26 mg, 0.2 mmoL) and Boc-SPD (26 mg, 0.075 mmoL) dissolved in DCM (2 mL) in a drop-wise manner with gentle stirring. The reaction was carried out for 24 h under nitrogen atmosphere and the resultant solution was precipitated and repeatedly washed in ice-cold diethyl and diethyl ether–methanol (7/3, v/v). After dried, the block copolymer dissolved in DCM (4 mL) was mixed with trifluoroacetic acid (TFA, 1 mM) and adjusted the pH to 8 with a saturated sodium bicarbonate solution to remove of BOC protection. The final SPD–PEG–PLGA block copolymer was dried and stored at −20 °C until use.
The 1H NMR spectra of the PEG–PLGA and SPD–PEG–PLGA were recorded at RT using a Bruker Avance 400 MHz NMR spectrometer (Varian, USA) to verify PEG and SPD coupling occurred.
2.3 Preparation of nanoparticles
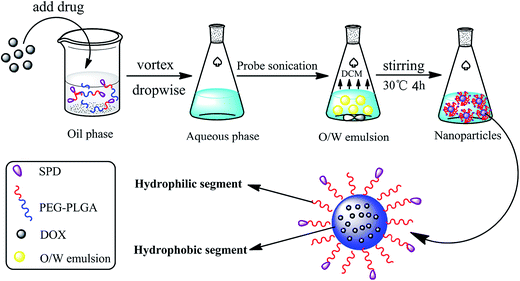
SPD–PEG–PLGA nanoparticles loaded with DOX (SPD–DOX-NPs) were prepared by the emulsification-solvent evaporation method.25,26 Briefly, SPD–PEG–PLGA (35 mg) and DOX (1.75 mg) were dissolved in 1 mL DCM. The organic phase was mixed with 2% PVA aqueous solution (4 mL) and emulsified by sonication (120 W, 3 min) on ice bath using probe sonication (Emerson Electric Holding, USA). The resulted O/W emulsion was further stirred at 30 °C for 4 h to evaporated the organic solvent (Scheme 1). The redundant materials and free molecules were removed by centrifugation (20![[thin space (1/6-em)]](https://www.rsc.org/images/entities/char_2009.gif) 000g, 4 °C) for 30 min and then resuspended in PBS buffer (pH 7.4) to obtain a final desired concentration for further use. The DOX-loaded PEG–PLGA nanoparticles (DOX-NPs) were prepared with the same procedure except PEG–PLGA for carrier material.
000g, 4 °C) for 30 min and then resuspended in PBS buffer (pH 7.4) to obtain a final desired concentration for further use. The DOX-loaded PEG–PLGA nanoparticles (DOX-NPs) were prepared with the same procedure except PEG–PLGA for carrier material.
2.4 Characterization of nanoparticles
![[thin space (1/6-em)]](https://www.rsc.org/images/entities/char_2009.gif) 000g) for 30 min. Another aliquot of the nanoparticles suspension was quantitated to determine the total DOX concentration. The DOX was determined by HPLC (LC 2010A, Shimazu, Japan) using an ODS C18 (200 × 4.6 mm, 5 μm, Diamonsil, Beijing, China) column with sodium lauryl sulfate (SDS) solution (contain 1.36 mL L−1 phosphoric acid)
000g) for 30 min. Another aliquot of the nanoparticles suspension was quantitated to determine the total DOX concentration. The DOX was determined by HPLC (LC 2010A, Shimazu, Japan) using an ODS C18 (200 × 4.6 mm, 5 μm, Diamonsil, Beijing, China) column with sodium lauryl sulfate (SDS) solution (contain 1.36 mL L−1 phosphoric acid)![[thin space (1/6-em)]](https://www.rsc.org/images/entities/char_2009.gif) :
:![[thin space (1/6-em)]](https://www.rsc.org/images/entities/char_2009.gif) acetonitrile
acetonitrile![[thin space (1/6-em)]](https://www.rsc.org/images/entities/char_2009.gif) :
:![[thin space (1/6-em)]](https://www.rsc.org/images/entities/char_2009.gif) methanol (50/50/6, v/v) as the mobile phase at the flow rate of 1.0 mL min−1. The column temperature was maintained at 40 °C, sample injection volume was 20 μL and the detection wavelength was 223 nm. The EE and LC were calculated using the following formulas:
methanol (50/50/6, v/v) as the mobile phase at the flow rate of 1.0 mL min−1. The column temperature was maintained at 40 °C, sample injection volume was 20 μL and the detection wavelength was 223 nm. The EE and LC were calculated using the following formulas:2.5 Cell culture
A549 cells were cultured in DMEM complete medium (containing 10% (v/v) FBS and 1% penicillin/streptomycin (100 U mL−1)) at 37 °C in a humidified atmosphere with 5% CO2, and subcultivated every 2–3 days at 80–90% confluence and digested with 0.25% trypsin–EDTA at a split ratio of 1![[thin space (1/6-em)]](https://www.rsc.org/images/entities/char_2009.gif) :
:![[thin space (1/6-em)]](https://www.rsc.org/images/entities/char_2009.gif) 2.
2.
2.6 In vitro cellular uptake study
For quantitative cellular uptake experiment, A549 cells were seeded in six-well culture plate at the density of 2 × 10⁵ cells per well for 24 h. After washed and incubated by 2 mL of free DOX, DOX-NPs, or SPD–DOX-NPs solution (with 5 μg mL−1 of DOX) for 1 h, respectively. The cells were washed thrice with cold PBS, trypsinized with 0.5 mL of trypsin–EDTA solution and harvested by centrifuged at 800 rpm for 5 min. After resuspended in 0.5 mL of PBS, the cellular uptake of various DOX formulations by A549 cells were measured by flow cytometry (FACSVerse, BD, USA), with 10![[thin space (1/6-em)]](https://www.rsc.org/images/entities/char_2009.gif) 000 events collected in each sample.
000 events collected in each sample.
2.7 In vitro antitumor activity evaluation
The in vitro antitumor activity of the NPs was evaluated using an MTT assay. A549 cells were seeded and cultured in 96-well plate at the density of 4 × 10³ cells per well for 24 h. After washed thrice with PBS, 100 μL of DMEM complete medium containing free DOX, DOX-NPs, or SPD–DOX-NPs at different DOX concentrations (0.01, 0.05, 0.1, 0.5, 1, 5, 10 μg mL−1) was added and incubated for 48 h in quadruplicate. Then 20 μL MTT (0.5 mg mL−1) solution was added to each well and cells were incubated for another 4 h. The MTT containing media were removed and 100 μL DMSO was added to dissolve the formazan crystals. The plate was shaked for 10 min at room temperature. Absorbance was measured at 490 nm with the multimode reader (Infinite M200, Tecan, CH) and the cell inhibition ratio was calculated.2.8 Statistical analysis
All the experiments were performed in triplicate and data was indicated as mean ± SD. One-way analysis of variance was used to determine the statistical significance of differences among multiple groups. And a P-values <0.05 were considered to be statistically significant.3. Results and discussion
3.1 Synthesis and characterization of SPD–PEG–PLGA copolymer
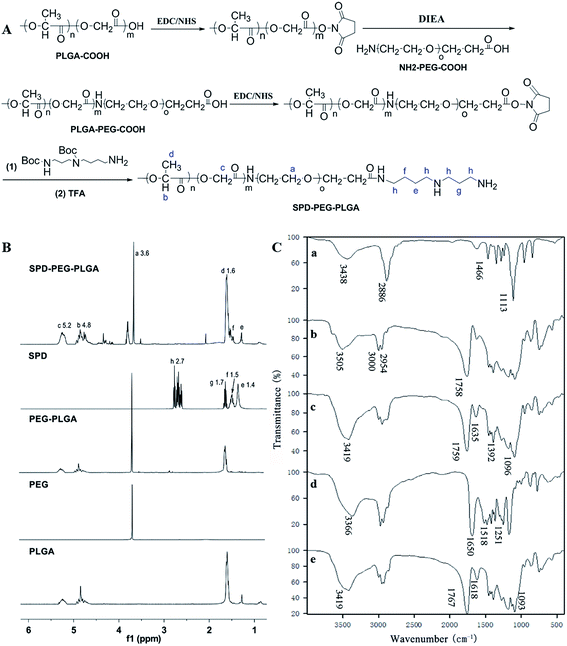
SPD–PEG–PLGA copolymer was synthesized via an EDC/NHS technique.29 Briefly, PLGA–COOH was firstly transformed into PLGA-NHS and then reacted with NH2–PEG–COOH. The resultant PLGA–PEG–COOH was subsequently activated and conjugated with Boc-SPD, and the t-butyloxy carbonyl was removed in the presence of TFA to obtain SPD–PEG–PLGA (Fig. 1A). The successful synthesis of SPD–PEG–PLGA was confirmed by 1H NMR spectrum (Fig. 1B). The sharp peak at 3.6 ppm belonged to the methene (–CH2) proton of PEG chain. The characteristic peaks at 1.6, 4.8 and 5.2 ppm were attributed to the methyl (–CH3), methine (–CH) and methene (–CH2) protons in PLGA segment, respectively. And the peak at 1.4, 1.5, 1.7 and 2.7 ppm were assigned to methene (–CH2) protons in SPD chains. The sharp peak of PEG at 3.6 ppm and the characteristic peaks of SPD at 1.4 and 1.5 ppm on product demonstrated the successful synthesis of SPD–PEG–PLGA copolymer.FTIR spectra confirmed the compositions of synthesized polymer (Fig. 1C). The characteristic bands at 3438 and 2886 cm−1 were attributed to –OH, –NH2 and C–H stretching vibration, respectively, and the sharp bands at 1466 and 1113 cm−1 were C–H deformation vibration and C–O–C absorption of NH2–PEG–COOH (Fig. 1C, trace a). The band at 1758 cm−1 belonged to carbonyl group of PLGA–COOH (Fig. 1C, trace b), which was also observed in PEG–PLGA copolymer. The absorption bands at 1635 and 1392 cm−1 of amide unit confirmed the successful conjugation of PEG with PLGA (Fig. 1C, trace c). Moreover, the infrared spectra at 1758–1759 cm−1 (C![[double bond, length as m-dash]](https://www.rsc.org/images/entities/char_e001.gif) O stretch), 1177–1133 and 1096–1091 cm−1 (C–O and C–C stretch) of PEG–PLGA polymer exhibited shifting and intensity increase upon SPD functionalization (Fig. 1C, trace e). The bands changes were attributed to the hydrophilic interactions of primary amine groups in polyamine with PEG–PLGA polymer skeleton.30,31
O stretch), 1177–1133 and 1096–1091 cm−1 (C–O and C–C stretch) of PEG–PLGA polymer exhibited shifting and intensity increase upon SPD functionalization (Fig. 1C, trace e). The bands changes were attributed to the hydrophilic interactions of primary amine groups in polyamine with PEG–PLGA polymer skeleton.30,31
3.2 Preparation and characterization of nanoparticles
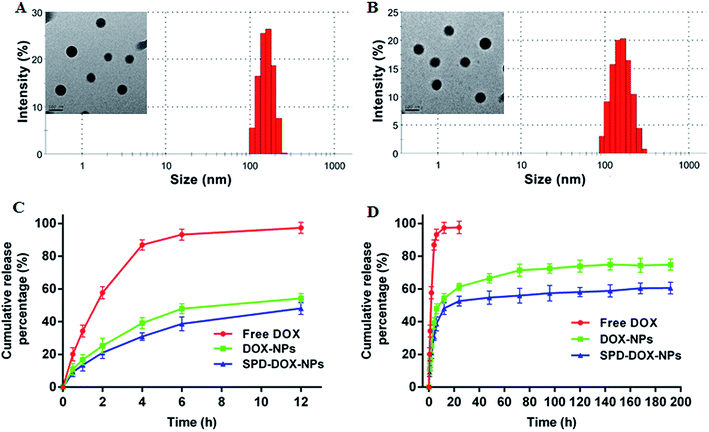
DOX-loaded nanoparticles was prepared by a typical emulsification-solvent evaporation method (Scheme 1). Briefly, the drug and synthesized polymers were first dissolved in DCM and quickly added into the aqueous phase. The O/W emulsions were transformed into uniform nano-droplets under probe sonication and evaporated the solvent to get stable nanoparticles. The as-prepared nanoparticles were characterized for the hydrodynamic size, polydispersity and zeta potential. Both the average diameter of DOX-NPs and SPD–DOX-NPs were about 151 nm with homogenous size distribution observed by DLS (PDI < 0.1, Fig. 2A and B). The morphology of the NPs was then characterized by transmission electron microscope (TEM). As showed in Fig. 2A and B, DOX-NPs or SPD–DOX-NPs exhibited relatively monodispersed spherical shapes with a uniform size and a smooth surface. The intact morphologies of nanoparticles provided a stable carrier support for drug encapsulation. Notably, the size of DOX-loaded NPs determined by TEM was slightly smaller than that measured by DLS, which could be ascribed to the swelling or stretching of the SPD–PEG chain in solution for DLS measurement, while shrinking and crimping on the copper grid surface during drying and vacuumizing for TEM characterization.32,33The zeta potential of DOX-NPs was observed to be about −5.2 mV. After SPD modification, the zeta potential of SPD–DOX-NPs was characterized to be nearly −2.4 mV. The decreased negative charge can be attributed to the fact that the electropositive SPD partly screened the negatively charged carboxyl groups tails on PEG–PLGA polymer. The EE and of LC of optimized DOX-NPs were calculated to be 56.4% and 0.83%, respectively. For SPD–DOX-NPs, a slightly decreased EE and LC were observed to be 50.1% and 0.78%, respectively. This may be due to the increased hydrophilicity of PLGA–PEG block copolymer after terminal conjugated with spermidine (SPD) hydrophilic chain, and the hydrophobic DOX tended to diffuse from nanoparticles to aqueous solvent due to the reduced binding affinity of DOX with SPD–PEG–PLGA during SPD–DOX-NPs preparation.
The amount of SPD on nanoparticles surface was determined by a fluorescamine-based assay (Fig. S1A†). In this assay, the fluorescamine agent could generate a fluorescent compound (λex: 390 nm, λem: 480 nm) in the presence of primary amine at pH 9.0 with extremely high sensitivity on the pM scale, while the excess reagents generate hydrolysis products with nonfluorescent.34 As showed in Fig. S1B and C,† the fluorescence intensity of fluorescamine at 480 nm was linear correlation with the concentration of Boc-SPD. Based on the calibration curve, the surface SPD content was measured to be 46.4 μmoL g−1.
3.3 In vitro drug release
In vitro drug release of DOX from DOX-loaded NPs at 37 °C was evaluated by a dialysis method at pH 7.4 for up to 192 h incubation. As showed in Fig. 2C, about 90% free DOX diffused to release medium within 4 h and almost released totally after 6 h. While DOX released from DOX-NPs or SPD–DOX-NPs revealed a remarkably slower release, and the two nanoparticles exhibited a similar release behaviors during the whole experiment period. An initial burst of DOX release from DOX-NPs or SPD–DOX-NPs was observed in the first 12 h (∼50%) due to a large amount of drug adsorbed on the surface of NPs. After the sudden release period, the release of DOX from NPs was sustained over following 192 h (Fig. 2D). In addition, a series of SPD–PEG–PLGA polymers with different SPD contents from 20 to 60 μmoL g−1 have also been synthesized to prepare SPD–DOX-NPs (Table 1). The cumulative release of DOX from SPD–DOX-NPs was gradually decreased with increased SPD contents (Fig. S2†). This can be explained by that terminal carboxyl groups of PEG chains are more labile to hydrolysis than that of amide bonded SPD chains, leading to faster erosion-controlled drug release from NPs. The phenomenon was also observed in Fig. 2C and D, as the cumulative release of DOX from DOX-NPs (nearly 75%) was significantly increased compared with that of SPD–DOX-NPs (nearly 61%) in 192 h.| SPD contents (μmol g−1) | Size (nm) | Zeta potential (mV) | EE (%) | LC (%) |
|---|---|---|---|---|
| 0 | 151.9 ± 3.6 | 5.2 ± 1.4 | 56.43 ± 1.97 | 0.83 ± 0.08 |
| 20 | 152.2 ± 2.0 | 4.0 ± 0.7 | 55.15 ± 1.50 | 0.78 ± 0.02 |
| 40 | 151.6 ± 2.4 | 3.2 ± 0.4 | 51.27 ± 2.78 | 0.80 ± 0.06 |
| 50 | 150.5 ± 1.0 | 2.3 ± 1.2 | 50.80 ± 1.13 | 0.82 ± 0.06 |
| 60 | 151.7 ± 1.9 | 1.4 ± 0.5 | 50.16 ± 1.11 | 0.78 ± 0.05 |
3.4 Cellular uptake of DOX loaded nanoparticles
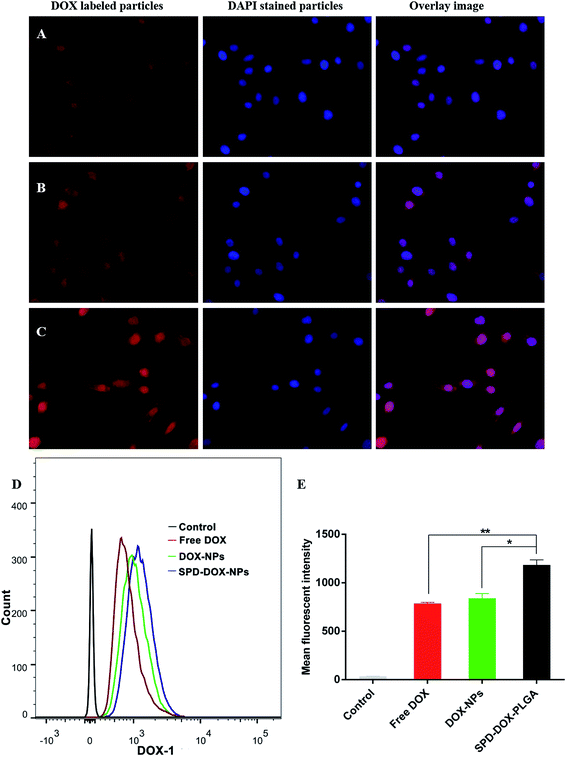
The fluorescence microscope was used to visualize the cellular uptake of free DOX and DOX loaded nanoparticles by A549 cells at an equivalent 5 μg mL−1 of DOX. The cells were imaged in the red channel for DOX and the blue channel for the nuclear stain. Among various groups, the brightest fluorescence was observed when A549 cells were incubated with SPD–DOX-NPs (Fig. 3A–C), indicating that the modification of SPD on the nanoparticles surface facilitates the cellular uptake of NPs. By contrast, free DOX solution exhibited weak fluorescence and DOX-NPs with only moderate fluorescence.Quantitative evaluation of cellular uptake of various groups was performed by flow cytometry after 1 h incubation. As showed in Fig. 3D and E, the fluorescence intensity of SPD–DOX-NPs was significantly enhanced compared to free DOX (P < 0.01) or DOX-NPs (P < 0.05), indicating the active uptake of SPD-modified NPs via affinity binding with PTS overexpressed on A549 cells surface. Meanwhile, though the cellular uptake of DOX-NPs was attributed to the endocytosis of NPs and free diffusion of DOX adsorbed on NPs surface, leading the mean fluorescence intensity of DOX-NPs enhanced ∼1.1 fold compared with that of free DOX, the cellular uptake of DOX-NPs by passive targeting was not significantly stronger than free DOX (P > 0.05).
3.5 Pretreatment with SPD or DFMO
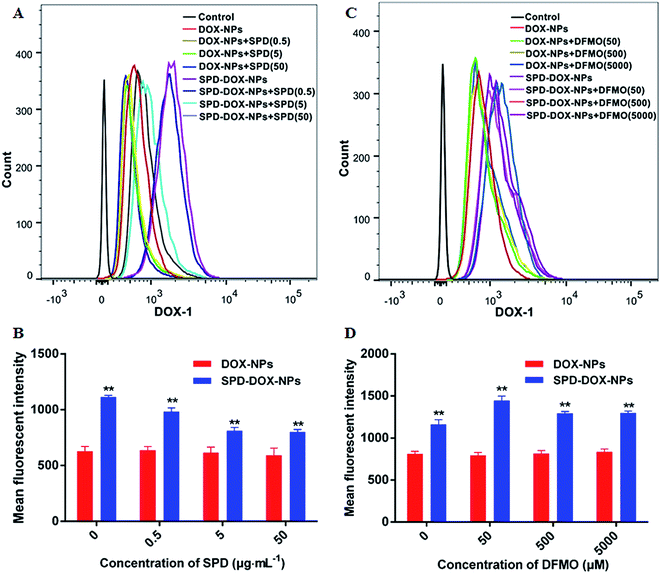
To confirm that the enhanced cellular uptake of SPD–DOX-NPs was due to its surface SPD modification, two parallel experiments were design. In the first experiment, the A549 cells were pre-treated with free SPD for 30 min so that the PTS on tumor cells surface was blocked. In this case, the specific enhancement effect of SPD–DOX-NPs can be abolished if PTS was important for particle uptake. Otherwise, the free SPD pre-treatment would not have much effect on particle internalization. As showed in Fig. 4A and B, the mean fluorescent intensity of A549 cells incubated with DOX-NPs was similar to treated cells with free SPD prior to the addition of NPs. While the internalization efficiency of SPD–DOX-NPs was reduced since the PTS binding sites was gradually occupied by free SPD. And the competitive effect was almost saturated when the amount of free SPD up to be 0.5 μg mL−1.In the other experiment, the cells were pre-treated with DFMO, a commonly used reagent to up-regulate the cell uptake of exogenous polyamines. As showed in Fig. 4C and D, the cell uptake of DOX-NPs changed lowness after pretreatment of DFMO due to its passive transport. By contrary, the mean fluorescent intensity of A549 cells incubated with SPD–DOX-NPs was increased significantly (P < 0.05) after DFMO preconditioning for 24 h. In fact, DFMO was as a suicide inhibitor of ornithine decarboxylase (ODC), one of the key enzymes involved in polyamine biosynthesis.35,36 The PTS activity of cancer cells was usually upregulated to replenish depleted intracellular polyamine pools,37,38 leading more SPD–DOX-NPs transported into cells. However, the internalization efficiency reduced slightly due to the affection of cell viability when the amount of DFMO over 50 μM (Fig. S3†). Taken together, the parallel experiments of SPD and DFMO pretreatment suggested that SPD–DOX-NPs was transported into cancer cells by a PTS-mediated endocytosis process.
3.6 The cellular uptake of NPs with various surface SPD contents
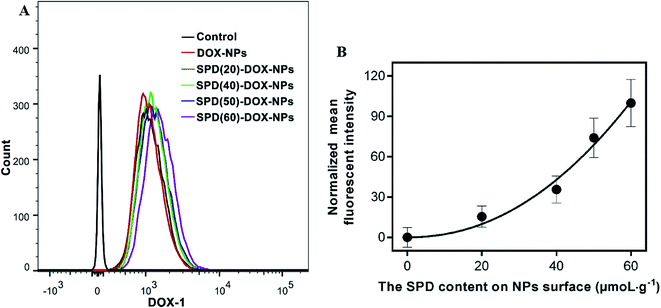
In order to investigate the effect of SPD density on cellular uptake efficiency, we synthesized SPD–PEG–PLGA polymers with different SPD contents from 20 to 60 μmoL g−1. As shown in Table 1, the variation of SPD contents had little impact on the particle size, drug-encapsulation ration and carried amount. Since the terminal carboxyl was reacted with the positive charge of polyamine skeleton, the zeta potential of SPD-NPs was near to neutrality with the improvement of SPD contents. After co-cultured with A549 cells for 1 h, the fluorescence intensity of the cells increased with the raise of SPD contents (Fig. 5A). Meanwhile, the relative fluorescent intensities of SPD–DOX-NPs with different SPD contents were normalized by that of non-SPD DOX-NPs. As shown in Fig. 5B, higher SPD content resulted in relatively stronger fluorescence intensity, indicating that SPD modification facilitates the internalization of NPs into A549 cells via SPD bound to the PTS overexpressed on the surface of cancer cells. However, the targeting ability of SPD was weakened with the SPD contents over 50 μmoL g−1. It was presumably caused by the affinity between conjugated SPD and PTS was reduced by the steric hindrance of nanoparticles, or the active sites of SPD were saturated with targeted NPs. These results indicated that the cellular internalization of SPD-modified NPs was receptor-dependent for anti-cancer therapy.3.7 In vitro cytotoxicity
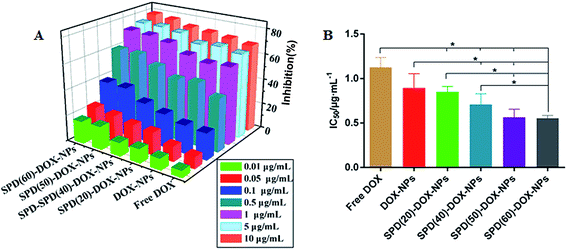
The flow cytometry analysis showed that the uptake of nanoparticles increased by PTS-overexpressing tumor cells after SPD modified on NPs surface. However, the antitumor activity is undefined. To understand the effects of this targeted drug delivery system on cancer cell proliferation, the in vitro antitumor efficacy of various DOX formulations was evaluated in A549 cells by MTT assay. Blank NPs or SPD-NPs did not exhibit obvious cytotoxicity at high concentration of 4 mg mL−1 (Fig. S4†), suggesting that the polymer delivery carriers possess satisfactory biocompatibility, and that cytotoxicity of DOX-loaded NPs was mostly caused by the encapsulated drug. As shown in Fig. 6A, the growth inhibition of A549 cells was increased apparently in a concentration- and formulation-dependent pattern. As a control, the IC50 value of free DOX was 1.13 ± 0.11 μg mL−1. DOX-loaded SPD-free NPs revealed similar cytotoxicity with IC50 0.89 ± 0.16 μg mL−1 compared to free DOX for A549 cells (P > 0.05). Meanwhile, the toxicity of SPD–DOX-NPs increased gradually with rising contents of surface SPD. At the highest SPD contents, the cytotoxicity reached 1.6-fold and 2.0-fold compared the SPD-free and free DOX formulation, respectively (Fig. 6B). Overall, PTS-mediated binding and internalization of SPD-NPs have been proposed to enhance the cancer cells proliferation inhibition of anticancer therapeutic agents.In fact, PTS was highly overexpressed in multiple tumor cells, implementation of PTS as a targeting site was a potential strategy for targeted delivery of chemotherapeutic agents into tumor cells. In this study, SPD, with moderate positive charge and chain length, was first exploited as a targeting ligand in a PEG–PLGA nanoparticle-based DOX delivery system. Since SPD exhibited high binding affinity to PTS, such a SPD–PEG–PLGA delivery system may have the potential to improve the delivery of DOX to cancer cells. Our results suggested that SPD–DOX-NPs could actively targeting to cancer cells and offer an effective antitumor efficiency compared to free DOX and DOX-NPs.
4. Conclusion
In this work, DOX-loaded SPD–PEG–PLGA nanoparticles were constructed and characterized. The NPs formulation was uniform spherical with sustained drug release profile, enhanced cellular uptake and thereby cytotoxicity in a concentration dependent manner with SPD contents on NPs surface. All of these results suggested that these SPD modified PEG–PLGA nanoparticle-based drug delivery system might be a promising drug carrier for targeting treatment strategy of cancers.Conflict of interest
The authors declare no conflicts of interest. The authors alone are responsible for the content and writing of this article.Acknowledgements
This work was supported by National Natural Science Foundation of China (81603061, 81573374), Graduate student independent exploration and Innovation Foundation of Central South University (2016zzts495). We thank the Analysis and Testing Center of Central South University for assistance on the 1H NMR characterization of SPD–PEG–PLGA copolymer and TEM imaging of nanoparticles. We also thank the Department of Pathology of Hsiang-Ya Medical College for assistance on the flow cytometry services.References
- R. L. Siegel, K. D. Miller and A. Jemal, Ca-Cancer J. Clin., 2016, 66, 7–30 CrossRef PubMed.
- R. Z. C. Academy and C. Acad, Ca-Cancer J. Clin., 2016, 66, 115–132 CrossRef PubMed.
- M. Heron, D. Ph, R. N. Anderson and D. Ph, NCHS Data Brief, 2016, vol. 254, pp. 1–8 Search PubMed.
- B. Colagiuri, H. Dhillon, P. N. Butow, J. Jansen, K. Cox and J. Jacquet, J. Pain Symptom Manage., 2013, 46, 275–281 CrossRef PubMed.
- M. E. Godsey, S. Suryaprakash and K. W. Leong, RSC Adv., 2013, 3, 24794–24811 RSC.
- S. Kumar and P. Maiti, RSC Adv., 2016, 6, 67449–67480 RSC.
- S. Acharya and S. K. Sahoo, Adv. Drug Delivery Rev., 2011, 63, 170–183 CrossRef CAS PubMed.
- I. Bala and S. Haribaran, Crit. Rev. Ther. Drug Carrier Syst., 2004, 21, 387–422 CrossRef CAS PubMed.
- S. M. Ryan, G. Mantovani, X. Wang, D. M. Haddleton and D. J. Brayden, Expert Opin. Drug Delivery, 2008, 5, 371–383 CrossRef CAS PubMed.
- S. Sharma, A. Parmar, S. Kori and R. Sandhir, TrAC, Trends Anal. Chem., 2015, 80, 30–40 CrossRef.
- M. Das, C. Mohanty and S. K. Sahoo, Expert Opin. Drug Delivery, 2009, 6, 285–304 CrossRef CAS PubMed.
- E. Agostinelli, F. Vianello, G. Magliulo, T. Thomas and T. J. Thomas, Int. J. Oncol., 2015, 46, 5–16 CAS.
- S. D. Steichen, M. Caldorera-moore and N. A. Peppas, Eur. J. Pharm. Sci., 2013, 48, 416–427 CrossRef CAS PubMed.
- C. Moinard, L. Cynober and J. P. de Bandt, Clin. Nutr., 2005, 24, 184–197 CrossRef CAS PubMed.
- S. Tomasi, J. Renault, B. Martin, S. Duhieu, V. Cerec, M. Le Roch, P. Uriac and J. G. Delcros, J. Med. Chem., 2010, 53, 7647–7663 CrossRef CAS PubMed.
- C. Wang, J. Delcros, J. Biggerstaff and O. Phanstiel, J. Med. Chem., 2003, 46, 2663–2671 CrossRef CAS PubMed.
- A. Muth, J. Kamel, N. Kaur, A. C. Shicora, I. S. Ayene, S. K. Gilmour and O. Phanstiel, J. Med. Chem., 2013, 56, 5819–5828 CrossRef CAS PubMed.
- S. L. Nowotarski, P. M. Woster and R. A. Casero, Expert Rev. Mol. Med., 2013, 15, e3 CrossRef PubMed.
- S. Q. Xie, J. H. Wang, H. X. Ma, P. F. Cheng, J. Zhao and C. J. Wang, Toxicology, 2009, 263, 127–133 CrossRef CAS PubMed.
- A. J. Palmer and H. M. Wallace, Amino Acids, 2010, 38, 415–422 CrossRef CAS PubMed.
- S. T. Matalon, A. Ornoy and M. Lishner, Reprod. Toxicol., 2004, 18, 219–230 CrossRef CAS PubMed.
- B. Chaveli-López, J. clin. exp. dent., 2014, 6, 3–5 Search PubMed.
- S. Piper and T. McDonagh, Future Cardiol., 2015, 11, 453–470 CrossRef CAS PubMed.
- K. Krukiewicz and J. K. Zak, Mater. Sci. Eng., C, 2016, 62, 927–942 CrossRef CAS PubMed.
- R. A. Jain, Biomaterials, 2000, 21, 2475–2490 CrossRef CAS PubMed.
- C. Pinto Reis, R. J. Neufeld, A. J. Ribeiro and F. Veiga, Nanomed. Nanotech. Biol. Med., 2006, 2, 8–21 CrossRef PubMed.
- J. M. Chalovich and E. Eisenberg, Nanotechnology, 2013, 24, 355101 CrossRef PubMed.
- F. Badalà, K. Nouri-mahdavi and D. A. Raoof, ACS Nano, 2012, 6, 512–522 CrossRef PubMed.
- M. Alibolandi, M. Ramezani, F. Sadeghi, K. Abnous and F. Hadizadeh, Int. J. Pharm., 2015, 479, 241–251 CrossRef CAS PubMed.
- S. M. Alex, M. R. Rekha and C. P. Sharma, Int. J. Pharm., 2011, 410, 125–137 CrossRef CAS PubMed.
- S. Sanyakamdhorn, P. Chanphai and H. A. Tajmir-Riahi, J. Photochem. Photobiol., B, 2014, 130, 30–39 CrossRef CAS PubMed.
- J. Li, Y. Zhou, C. Li, D. Wang, Y. Gao, C. Zhang, L. Zhao, Y. Li, Y. Liu and X. Li, Bioconjugate Chem., 2015, 26, 110–119 CrossRef CAS PubMed.
- N. Li, X. R. Li, Y. X. Zhou, W. J. Li, Y. Zhao, S. J. Ma, J. W. Li, Y. J. Gao, Y. Liu, X. L. Wang and D. D. Yin, Biomaterials, 2012, 33, 8881–8892 CrossRef CAS PubMed.
- S. Udenfriend, S. Stein, P. Böhlen, W. Dairman, W. Leimgruber and M. Weigele, Science, 1972, 178, 871–872 CAS.
- P. A. Sample, C. Boden, Z. Zhang, J. Pascual, T. Lee, L. M. Zangwill, R. N. Weinreb, J. G. Crowston, E. M. Hoffmann, F. A. Medeiros, T. Sejnowski and M. Goldbaum, Cancer Prev. Res., 2014, 7, 1198–1209 CrossRef PubMed.
- F. L. Meyskens and E. W. Gerner, Clin. Cancer Res., 1999, 5, 945–951 CAS.
- A. Muth, M. Madan, J. J. Archer, N. Ocampo, L. Rodriguez and O. Phanstiel, J. Med. Chem., 2014, 57, 348–363 CrossRef CAS PubMed.
- H. M. Wallace and A. V Fraser, Amino Acids, 2004, 26, 353–365 CrossRef CAS PubMed.
Footnote |
| † Electronic supplementary information (ESI) available. See DOI: 10.1039/c7ra02447a |
| This journal is © The Royal Society of Chemistry 2017 |

