
 Open Access Article
 This Open Access Article is licensed under a Creative Commons Attribution-Non Commercial 3.0 Unported Licence
Systematic study of the crystallization process of CrAPO-5 using in situ high resolution X-ray diffraction
Pei Shengab,
Guofu Wanga,
Mei Dong*a,
Gang Chenab,
Huanhuan Yangab,
Weibin Fan a,
Zhangfeng Qina and
Jianguo Wanga
a,
Zhangfeng Qina and
Jianguo Wanga
aState Key Laboratory of Coal Conversion, Institute of Coal Chemistry, Chinese Academy of Sciences, Taiyuan 030001, China. E-mail: mdong@sxicc.ac.cn; Tel: +86-0351-4046736
bUniversity of Chinese Academy of Sciences, Beijing 100049, China
First published on 26th April 2017
Abstract
Chromium substituted nano-porous aluminophosphate (CrAPO-5) was investigated to discuss the effect of Cr3+ ions on the crystallization kinetics and crystal structure parameters by in situ time-resolved high resolution X-ray powder diffraction (HRXRPD). Results showed that the introduction of Cr3+ into pure AlPO4-5 influenced both the crystallization velocity and structural parameters of the resultant AFI. The presence of Cr3+ ions can severely retard the crystallization of AFI. The more Cr3+ ions in the gels, the stronger inhibitory effect would be. A kinetic analysis of the crystallization of CrAPO-5 was performed. A fair linear relationship between the activation energy and Cr3+ content was concluded. The calculated Avrami exponent n was in the range of 1–1.4, implying a similar 1D growth mechanism to that of AlPO4-5. The extracted structural parameters showed obvious crystal expansion, which might be caused by the trapping of Cr3+ ions in the framework. However, this influence on the structural parameters was limited. The a (=b) parameters increased to a maximum with chromium content, which is similar to the influence on the crystal growing velocity. The grain size variation of AFI differed from other metal substituted aluminophosphate molecular sieves, which implied a different state of chromium in the AlPO4-5 framework. The time-resolved HRXRPD proves to be a direct and efficient method to reveal the influence of Cr3+ ions on the crystallization and shows indirect evidence on the state of Cr3+ in the crystalized CrAPO-5.
1. Introduction
Aluminophosphates have a crystalline three-dimensional network, in which aluminum and phosphorus tetrahedra are linked via oxygen atoms. The porous structure of molecular sieves, combined with their chemical composition, makes them uniquely suitable for use as catalysts or support materials. Isomorphous substitution of transition metal ions is an efficient technology to control cation-exchange capacity and acidity of the molecular sieve materials, which is a key parameter to determine the catalytic activity.1,2 Substitution for Al3+ has been claimed for a variety of metals,3–8 such as Mn(II), Co(II), Fe(II), Mg(II), Zn(II), which has attracted worldwide attention in the area of molecular sieve science and shape selective catalysis. It is worth mentioning that the pristine catalytic properties of chromium in redox reactions has evoked high interest in chromium containing molecular sieves over the past few years. Substitution of Al with Cr(III) in aluminophosphate molecular sieves (AlPO4-5) does not induce additional framework charge or ion-exchange ability as the parent framework is neutral. However, if the product exhibits a compositional heterogeneity with evenly distributed chromium centers, it influences the sorption properties of the material in a similar way as charged centers in other metal substituted AlPO4-5. These sorption centers are able to interact with molecules adsorbed in the pores and act as a catalyst for reactions such as the oxidation of secondary alcohols and hydrocarbons in the liquid phase.9–13 Therefore, it is highly important to understand the crystallization mechanisms taking place during hydrothermal synthesis of aluminophosphate molecular sieves and metal-substituted ones, which will shed light on rational design and synthesis of new molecular sieves with specific crystalline structure, morphology and particle size for catalytic applications.One problem generally overlooked in developing new catalytic system is the stability and heterogeneity of these materials under working conditions. Cr3+ in inorganic compounds exhibits a strong tendency to adapt octahedral coordination due to existence of stable trivalent ion and its 3d3 ground state which splits into three stabilizing and two destabilizing orbitals in an octahedral field. Substitution for Al3+ is consequently a difficult task as it requires tetrahedral coordination of chromium. On the other hand, the present methods used to investigate state of Cr ions heavily rely on ultraviolet/visible spectroscopy (UV-vis),14–16 Raman spectroscopy,17 electron paramagnetic resonance (EPR),15,18–24 X-ray absorption spectroscopy (XAS)25–27 and nuclear magnetic resonance (NMR),28 which all focused on the synthesized products. A large number of studies have been devoted to studying the transformation of gel to nanoporous materials using a variety of in situ techniques, like X-ray diffraction (XRD) methods,29–35 small-angle X-ray scattering (SAXS) techniques5 and X-ray absorption spectroscopy (XAS).36,37 Although a combined technique approach using all these methods has been reported to derive mechanistic aspects of the crystallization process,5,37 recent developments, particularly in the area of angular-dispersive high resolution powder X-ray powder diffraction (HRXRPD), make it possible to collect high-quality diffraction data in a very short time scale, which will not only determine the kinetics, but also the precise structural parameters, in particular the variation in lattice parameters of the reacting system. The in situ methods had been widely used on Co, Zn and Mn substituted aluminophosphate molecular sieves.5,32–34,36–41 However, there is no report so far on the in situ study of the crystallization process of CrAPO-5. We present here an in situ study of the hydrothermal crystallization of CrAPO-5 starting from the precursor gel prepared with the classical method to the crystalline material using the high resolution synchrotron powder X-ray diffraction (HRXRD). This approach allowed us to achieve a deep understanding of the influence of Cr ions on the crystallization process of CrAPO-5, to study the kinetics, to extract the structural parameters and to investigate the state of Cr ions in AlPO4-5 frameworks during the synthesis process.
2. Experimental methods
2.1 Sample preparation
The AlPOs gels were prepared by a traditional method reported elsewhere.7 About 80–100 mL of each gel was prepared, sufficiently large for all synthesis and diffraction experiments performed. The following procedure was applied in the preparation of the gels: H3PO4 was first dissolved in water, followed by the addition of the transition metal ion salts. Then pseudoboehmite was added to the solution under vigorously stirring after the transition metal salts were fully dissolved. Finally, after stirring for at least 60 min, triethylamine as templating molecule was introduced into the above mixture drop by drop under vigorous stirring. This mixture was further stirred for at least 2 h. The charges were stored at room temperature in polyethylene vials. The APO-gel was prepared with a similar procedure. Preliminary crystallization experiments were conducted at 200 °C in Teflon-lined autoclaves, and the obtained crystalline reaction products were identified from their X-ray powder patterns.42 The elemental composition analyzed by ICP were listed in Table 1.| Sample | Cr3+ content in the gels (wt%) | Cr content in the as-synthesized samples (wt%) | Element content in crystals (mol) |
|
|
||
|---|---|---|---|---|---|---|---|
| Cr | Al | P | |||||
| AlPO4-5 | 0 | 0 | — | — | — | — | — |
| CrAPO-5(0.01) | 0.09 | 0.24 | 0.006 | 0.992 | 1.00 | 1.00 | 0.008 |
| CrAPO-5(0.05) | 0.44 | 0.66 | 0.016 | 0.981 | 1.00 | 1.00 | 0.019 |
| CrAPO-5(0.08) | 0.70 | 0.82 | 0.020 | 0.983 | 1.00 | 1.00 | 0.017 |
No chemical analysis of the reaction products were performed, but a general composition can be given as
| Cr1−mAlPO4·1.0TEA·40H2O |
2.2 In situ measurements
A homemade device as shown in our previous work43 was designed to meet the demands of in situ XRD analysis. In the in situ experiments, two heating modes were used: (i) heating of the gels from ca. 28 to 200 °C in 90 min at a constant heating rate (temperature ramp) and (ii) heating of the gels in 1 min from ca. 28 °C to a temperature between 140 and 170 °C and keeping the temperature for a certain period of time (isothermal). The in situ set-up and its detailed operation were described in our early work.43 Four kind of gels with different Cr3+ content were studied using synchrotron radiation, as shown in Table 1.The in situ XRD experiment was performed on the 4B9A beamline of BSRF at a fixed wavelength of 1.54 Å with MYTHEN as the detector. The superiority of the MYTHEN detector used in the powder diffraction had been summarized and verified in some studies.44–46 The detailed information about the MYTHEN detector in BSRF was described by Du.45 Considering the signal-to-noise ratio of the spectra and the reaction speed, the duration of each data collection was optimized to 60 to 120 seconds to cover a 2-theta range of 120°. In fact, only the data in the range of 5 to 40 degrees was effective to extract the useful information. The data was processed using Jade 6.5 software to extract the lattice parameter of the crystallizing system as a function of time. The kinetic information was extracted using the Avrami equation. The structural parameters were calculated using the Debye–Scherrer equation.
3. Results and discussion
3.1 In situ XRD
 | ||
| Fig. 1 (a and b) Stack of powder XRD patterns obtained during the in situ crystallization process when heating the gels from room temperature to 200 °C: (a) AlPO4-5; (b) CrAPO-5(0.05); (c and d) patterns of the integral area of different reflection peaks vs. the crystallization time: (c) AlPO4-5 and (d) CrAPO-5(0.05). | ||
Fig. 2 showed the powder patterns of the CrAPO-5 gels with different Cr3+ content at 150 °C. The Bragg reflections appeared as soon as the gel was introduced into the cells when the molar ratio of Cr/P was 0.01. The time before the appearance of the Bragg reflections, named induction or nucleation time, became longer and longer with the increasing of the Cr3+ ions content in the gels. The nucleation time t0, to a certain extent, could present the apparent activation energy for the nucleation process.32 With the content of Cr3+ increasing, the nucleation time t0 at 150 °C was prolonged, which indicates the increase of the apparent activation energy for the nucleation process.
 | ||
| Fig. 2 Stack of powder XRD patterns obtained with CrAPO-5(m) when kept at 150 °C for the duration of the data collection: (a) AlPO4-5; (b) CrAPO-5(0.01); (c) CrAPO-5(0.05); (d) CrAPO-5(0.08). | ||
Kinetic information on the isothermal crystallization process can be derived from the Avrami–Erofe'ev47–49 expression that is widely used to model phase transitions and crystal growth in solid-state chemistry using the extent of the reaction, α, to time t using the relationship
| α = 1 − exp[−(k(t − t0))n] | (1) |
![[thin space (1/6-em)]](https://www.rsc.org/images/entities/char_2009.gif) lnk.52,53
lnk.52,53
The crystallization curves for the isothermal in situ synthesis of Cr3+-substituted aluminophosphates were analyzed in order to extract kinetic information. The evolution of diffraction peak intensity as a function of time can be used to derive valuable information on the kinetics and mechanism involved in the crystallization process. The intensity can be determined by fitting one or several Bragg peaks with a Gaussian function and measuring the corresponding areas that are then converted to the extent of reaction (α), scaled from 0 to 1, using the relationship α(t) = Ihkl(t)/Ihkl(max), where Ihkl(t) is the integral area of the given peaks at time t and Ihkl(max) is the maximum integral area of these peaks. The sum of four Bragg reflections of 100, 210, 002 and 102/211 contributes to each of the peak intensity.
The crystallization curves of CrAPO-5 with different Cr ion content were given in Fig. 3a, while the plot of the evolution of the (100) Bragg reflection at half-maximum (FWHM) as a function of temperature was shown in Fig. 3b. The Sharp–Hancock plot has been used to obtain the parameters n and k. The obtained plots of the crystallization of AlPO4-5 and CrAPO-5(m) at 150 °C presented in Fig. 4a are clearly linear over the whole extent of the data, confirming the validity of the model (outliers due to the occurrence of macroscopic inhomogeneity in the sample during the synthesis were not included in the linear fitting process). The calculated n and k were summarized in Table 2.
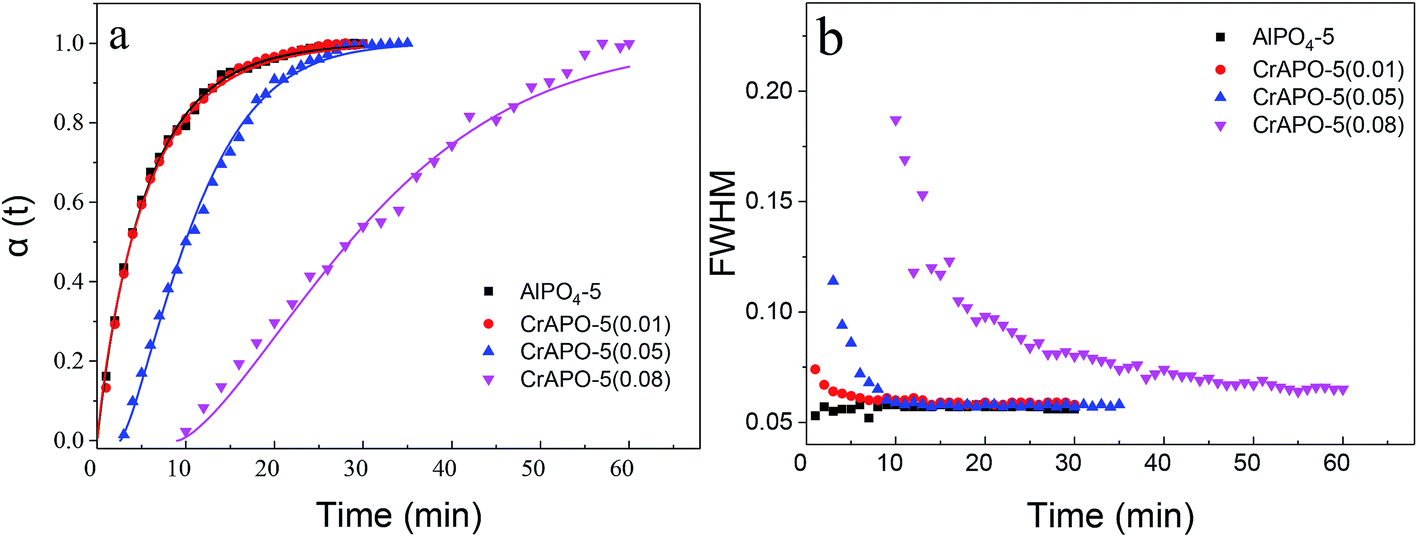 | ||
| Fig. 3 (a) Crystallization curves extracted from isothermal in situ powder diffraction experiments at 150 °C. Solid curves are the fits to the Avrami expression, eqn (1); (b) the evolution of the experimental full-width at half-maximum (FWHM) of the Bragg reflection of (100). | ||
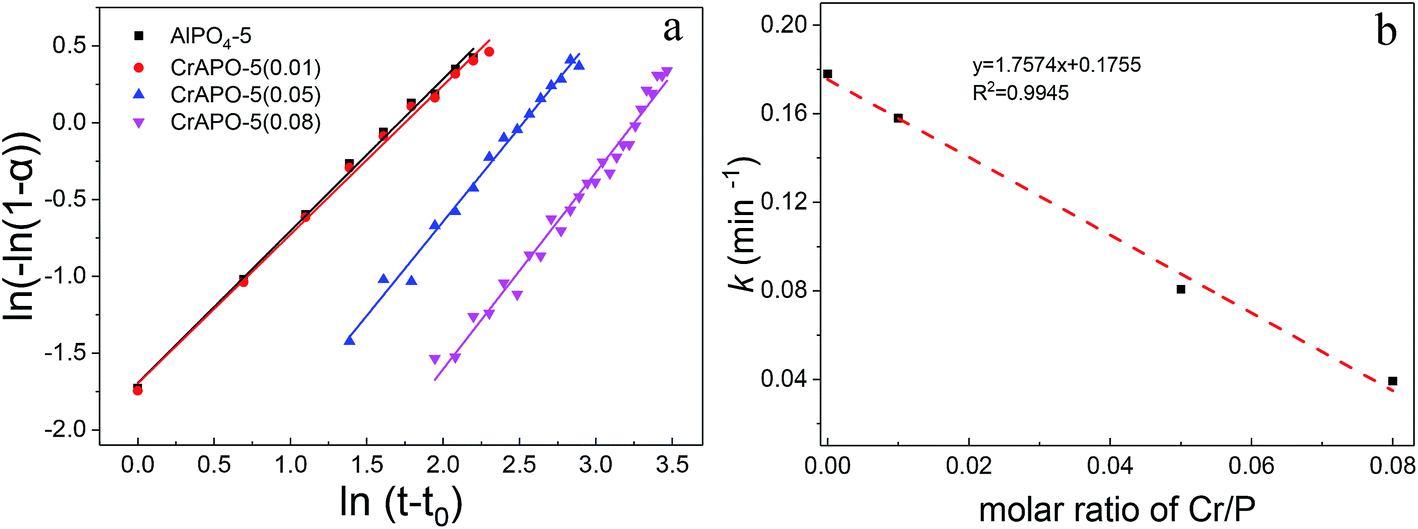 | ||
| Fig. 4 (a) Sharp–Hancock plots for the formation of AlPO4-5 and CrAPO-5(m) plotted data with the range from 0.15 to 0.8; (b) the plot of the rate constant k versus the Cr content in the gel at 150 °C. | ||
| Crystalline gel | T (°C) | n | k (min−1) | t0 (min) | Ea (kJ mol−1) |
|---|---|---|---|---|---|
| AlPO4-5 | 140.1 | 1.0 | 0.121 | 1.4 | 48.7 |
| 144.9 | 1.1 | 0.134 | 0.7 | ||
| 149.7 | 1.1 | 0.167 | 0.6 | ||
| CrAPO-5(0.01) | 140.1 | 1.0 | 0.111 | 7.2 | 53.5 |
| 144.9 | 1.1 | 0.142 | 4.3 | ||
| 149.7 | 1.1 | 0.158 | 0.5 | ||
| CrAPO-5(0.05) | 140.1 | 1.1 | 0.0533 | 12.7 | 62.7 |
| 144.9 | 1.2 | 0.0757 | 5.3 | ||
| 149.7 | 1.3 | 0.0813 | 4.1 | ||
| CrAPO-5(0.08) | 149.9 | 1.1 | 0.0383 | 10.7 | 65.7 |
| 150.9 | 1.1 | 0.0434 | 8.6 | ||
| 158.2 | 1.1 | 0.0558 | 3.8 |
When the ratio of Cr/P was less than or equal to 0.05 in the gel, the resulting crystallization curves were typical for a crystallization process in aqueous system consisting of an initial period of induction (or nucleation) followed by rapid crystallization of the material and gradual growth of the crystallites until a constant value is reached, which implied the completion of crystal growth. The results are similar to that of Me2+-substituted microporous aluminophosphates in aqueous system.32,34,36,38,41 The fitting curves using the n, k parameters calculated from the Sharp–Hancock plots showed highly consistent with the experimental crystallization curves. The Avrami exponent n of CrAPO-5 obtained from the Sharp–Hancock plots was larger than that of AlPO4-5, and the rate constant k was smaller than that of AlPO4-5, as shown in Table 2. These results illustrate that the nuclei growth and crystallization were both retarded in the presence of Cr ions. And the inhibitory effect became stronger and stronger with the increase of metal content in the gel. When the mole ratio of Cr/P was 0.01, the crystallization curve was almost overlapped by that of AlPO4-5. The obtained n for different Cr3+ content was in the range of 1.0 to 1.3, which showed little variation with Cr3+ content. We conclude that the growth mechanism of CrAPO-5 with different Cr3+ content was similar to that of AlPO4-5 and was independent with the Cr content within the studied range.
The FWHM, as manifested in Fig. 3b, was used to determine the variation in crystallite size with Cr3+ content. The FWHM values for all systems decreases sharply with the rate at which the decline takes place dependent upon the reaction temperature except AlPO4-5, which was at a rather high level at first and remained nearly unchanged later. It is interesting that the FWHM decreases to almost the same value within the study range. The phenomena was inconsistent with the observation with SEM results observed in ex situ studies, from which the particle size can be obtained. The size calculated from XRD spectra was crystallite size, while the particles observed in SEM picture was the aggregates of those small crystallites. The aggregating degree was different for CrAPO-5 with different chromium content, so the particle size calculated from SEM pictures was different.
The rate constants k for different crystallization process showed a perfect linear relationship with the molar ratio of Cr/P in the gel, as shown in Fig. 4b. It is generally accepted that as n becomes larger, the rate of formation of nucleation sites becomes increasingly important in determining the overall rate of crystallization. Similar to the crystallization of CoAPO-5,5 for CrAPO-5 the higher value of n parameter of ca. 1.3 indicates the following possible mechanism: CrAPO-5 crystallized with the same 1D mechanism as pure AlPO4-5 but the presence of chromium slowed down the nucleation and crystallization rate severely. The prolonged induction time and decreased k constant indicate that the inhibitory effect for both the two stages is proportional to the Cr ions content in the synthesis gels.
Fig. 5a–d exhibited the observed and calculated crystallization curves at different temperature, whereas the plot of the evolution of FWHM of the (100) Bragg reflection as a function of time is shown in Fig. 5e–h. It is consistent with former works that the crystallization rate was proportional to the temperature. Furthermore, the growth profiles for each phase showed little variation with temperature, which we conclude is the evidence that the growth mechanism is not temperature-dependent for the range of temperatures studied. As described above, the FWHM decreased very sharply up to a point that coincided approximately with the change in rate of the reaction and remained effectively constant until the extent of the reaction reaches α maximum observed in Fig. 5a–d. The sharp variations of FWHM during the crystallite growth were larger for CrAPO-5 than that for AlPO4-5, which was also observed in the crystallization process of CoAPO-5.5 Furthermore, the reduction became larger when the experimental temperature decreased. As has been proved in laboratory experiment that lower crystalline temperature is benefit for the formation of smaller crystals. The crystal size has relation to the FWHM to some extent, that is to say, the smaller the crystal size is, the larger the FWHM will be. The changes observed in the in situ experiments gave similar trend.
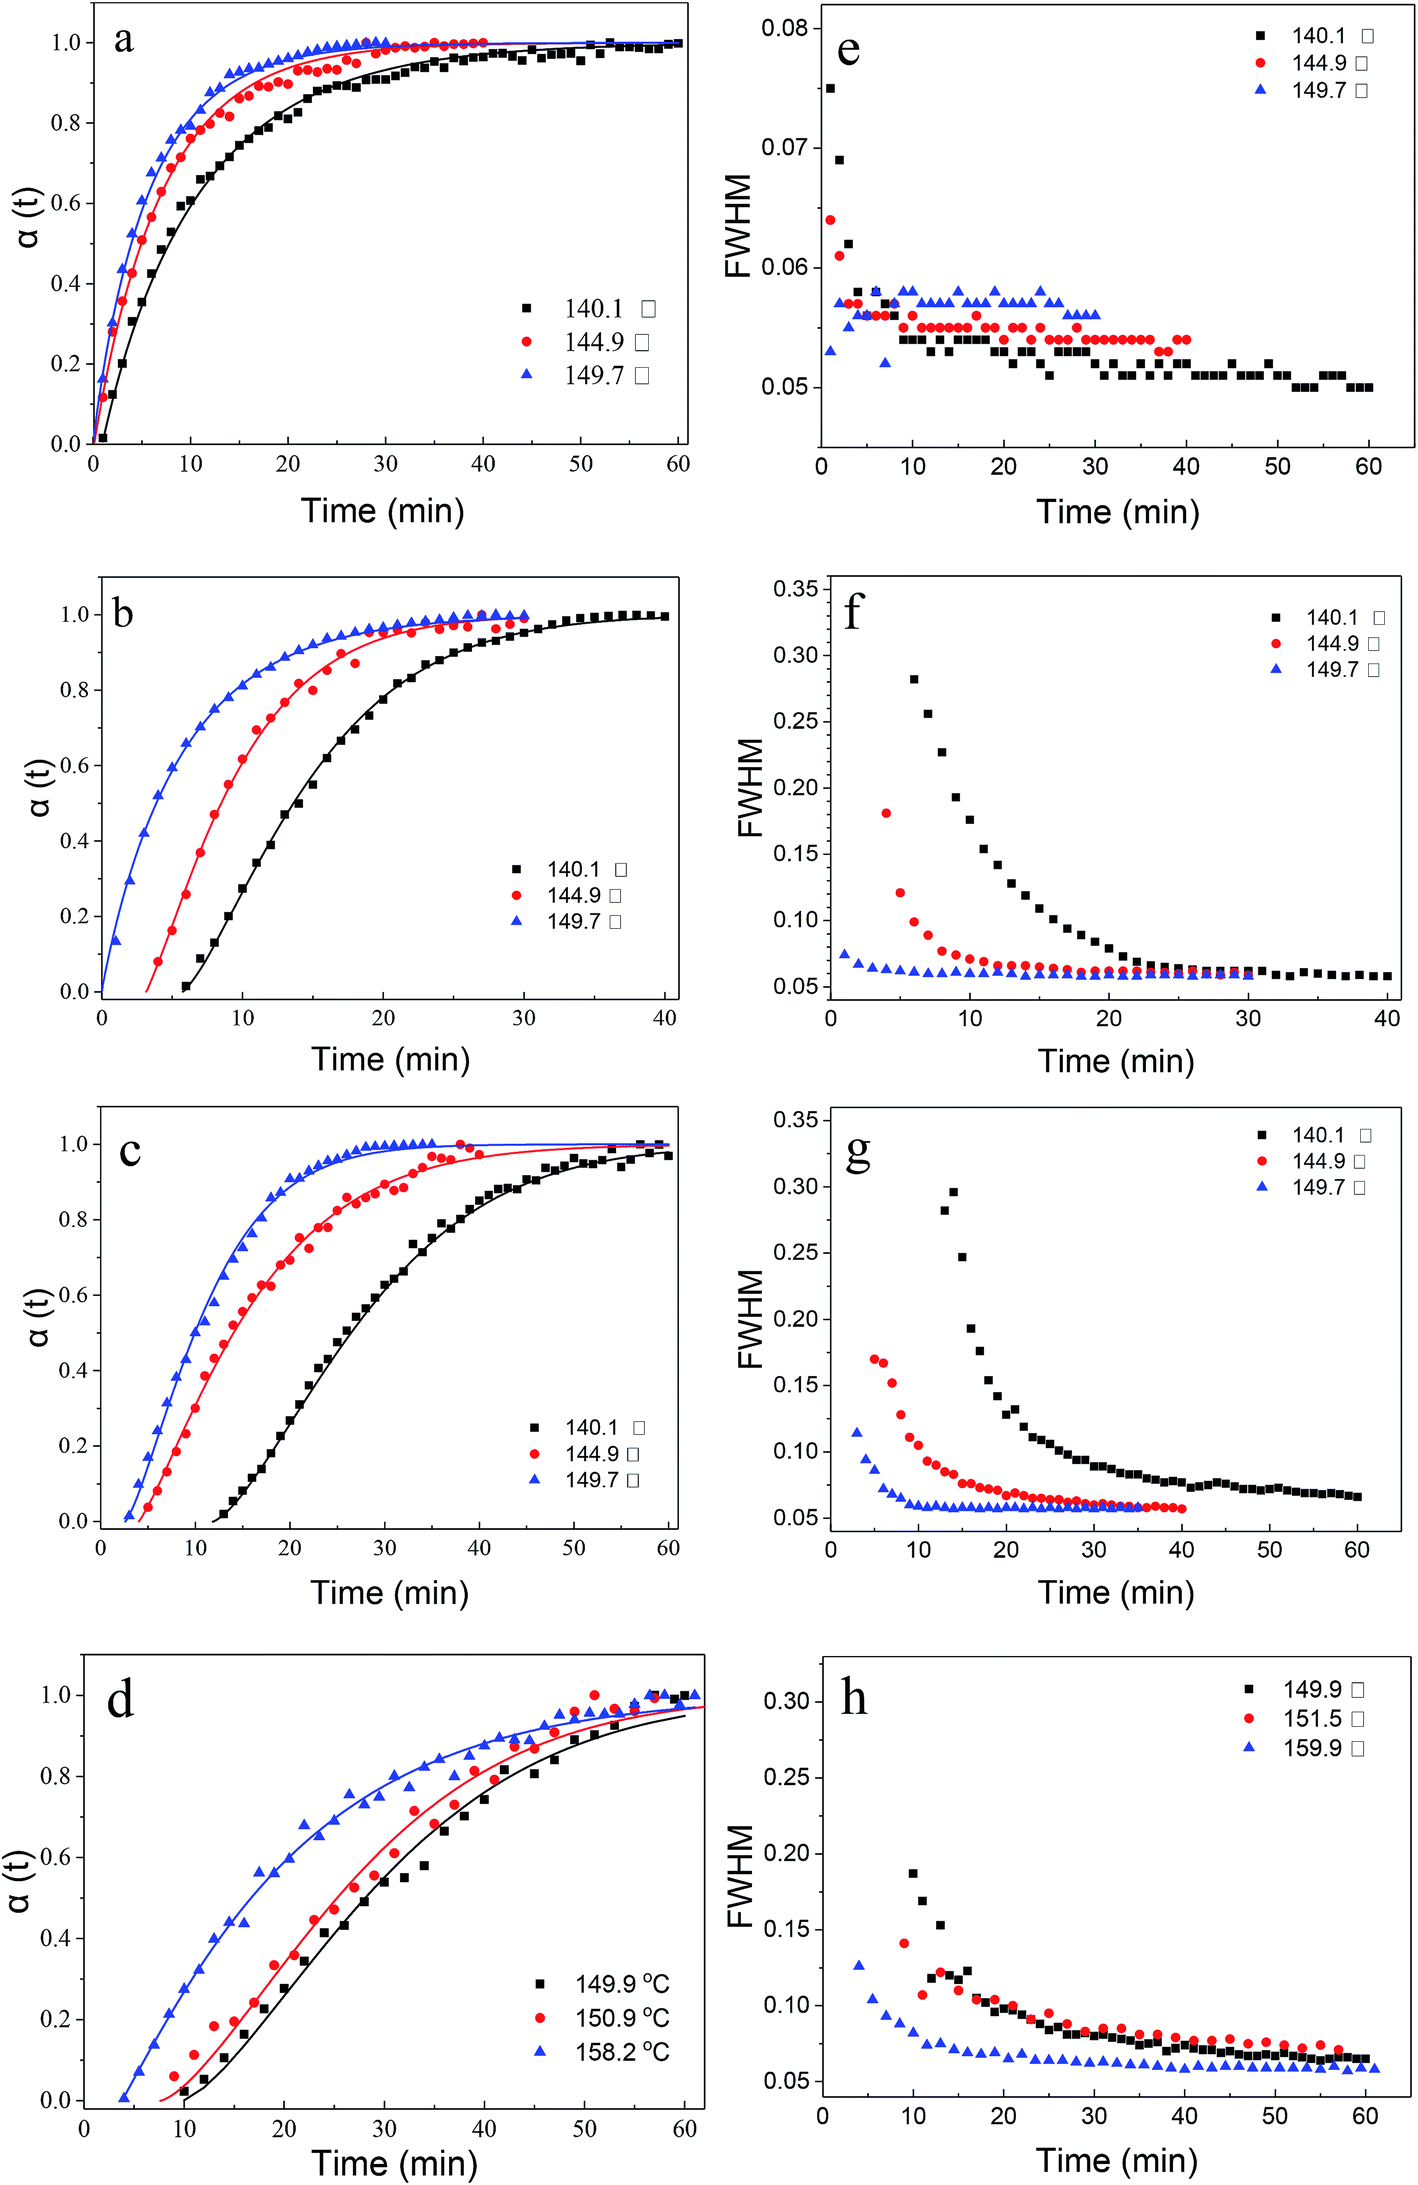 | ||
| Fig. 5 (a–d) Crystallization curves extracted from isothermal in situ powder diffraction experiments at temperatures between 140 and 160 °C. Solid curves are the fits to the Avrami expression, eqn (1); and (e–h) the evolution of the experimental full-width at half-maximum (FWHM) of the Bragg reflection of (100). (a and e) AlPO4-5, (b and f) CrAPO-5(0.01), and (c and g) CrAPO-5(0.05), (d and h) CrAPO-5(0.08). | ||
The general Arrhenius expression, k = Aexp(−Ea/RT), was used for the extraction of apparent activation energies for the crystal growth (see Fig. 6a and Table 2). As expected, the apparent activation energy for the crystal growth increased significantly with the introduction of Cr ions into pure AlPO4-5. It had a fair linear relationships between the apparent activation energy and the content of Cr3+ ions in the scope of the study. The increased apparent activation energy reflect the increasing difficulty for the prepared gels to crystallize.
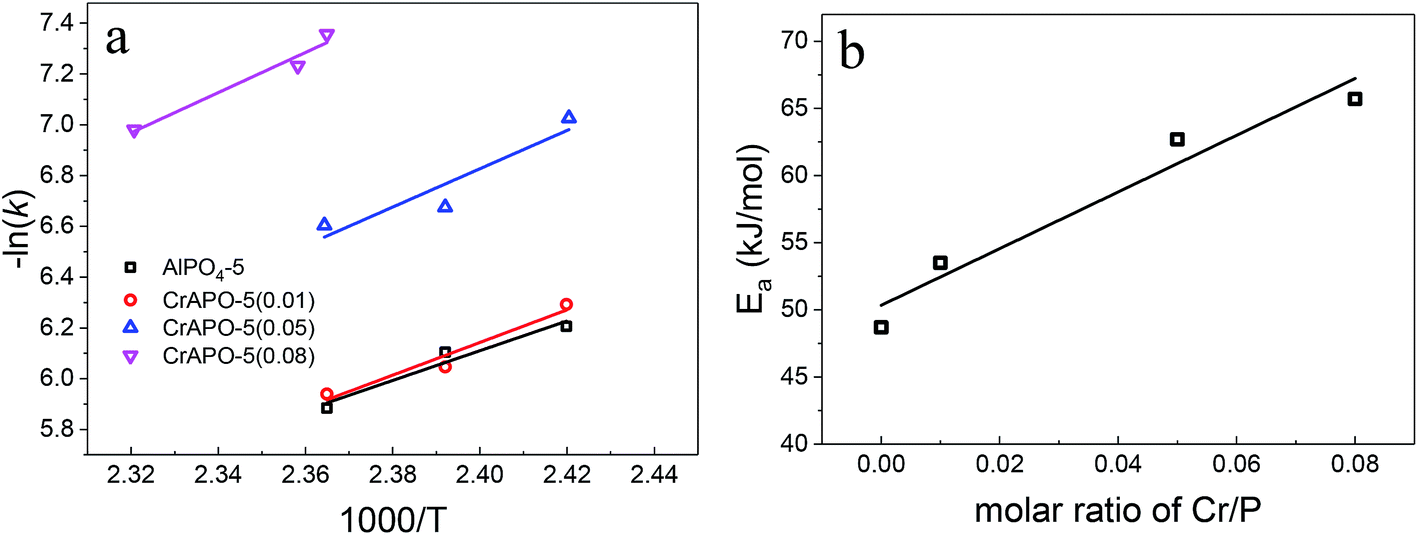 | ||
| Fig. 6 (a) Arrhenius plots for determination of activation energies for the crystallization of CrAPO-5 at different temperature; (b) the plot of the apparent activation energy Ea of crystal growth versus the molar ratio of Cr/P in the gel. | ||
|
D = Kλ/βcosθ
| (2) |
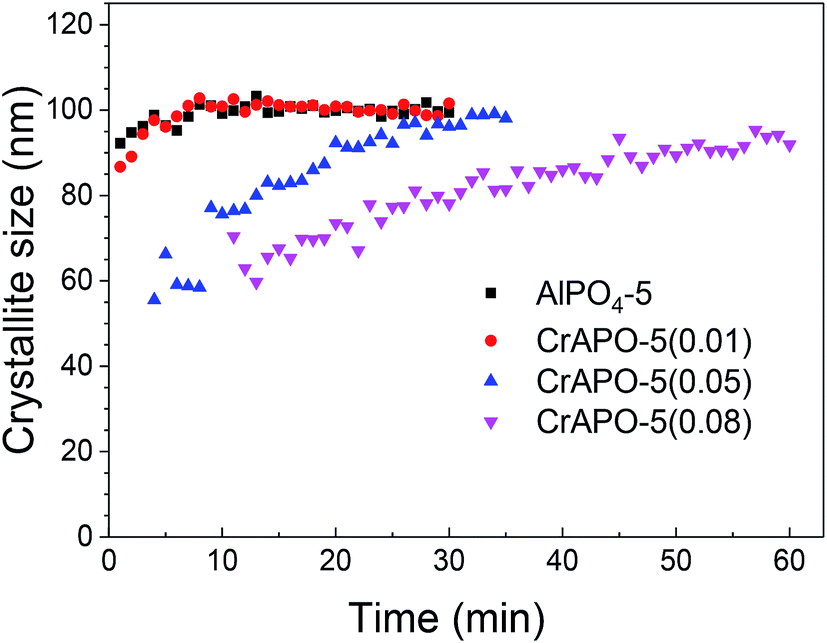 | ||
| Fig. 7 The variation in the grain size of the AFI crystals plotted against crystallization time. | ||
The plots of the a (=b) and c parameters over crystallization time including the cell volume at 150 °C were shown in Fig. 8. The a (=b) parameter remained nearly constant with a little decrease during the crystallization process and was found to increase with Cr3+ content. The values are 13.765 Å (CrAPO-5(0.01)), 13.816 Å (CrAPO-5(0.05)) and 13.817 (CrAPO-5(0.08)). The value was larger than that of Co2+- or Zn2+-substituted aluminophosphates.41 Compared to un-substituted AlPO4-5, 13.716 Å, the greater a (=b) parameters indicated that the metal ions was part of the framework, which could result in the lattice expansion. Furthermore, the lattice expansion was limited, which might relate to the amount of Cr3+ interacted with the framework was limited. It is to say that there is a highest amount of metal ions that could interact with the framework P atoms. The redundant metal ions are located in other extra-framework sites which have little influence to the structure change of the crystals. Octahedral coordinated Cr3+ cation has larger ionic radii, 0.615 Å, compared to Co(II), Zn(II) and Al(III) which have the ionic radii of 0.58 Å, 0.60 Å and 0.39 Å, respectively,57,58 therefore the larger expansion in the a (=b) direction is observed when a metal ion is trapped into the framework.
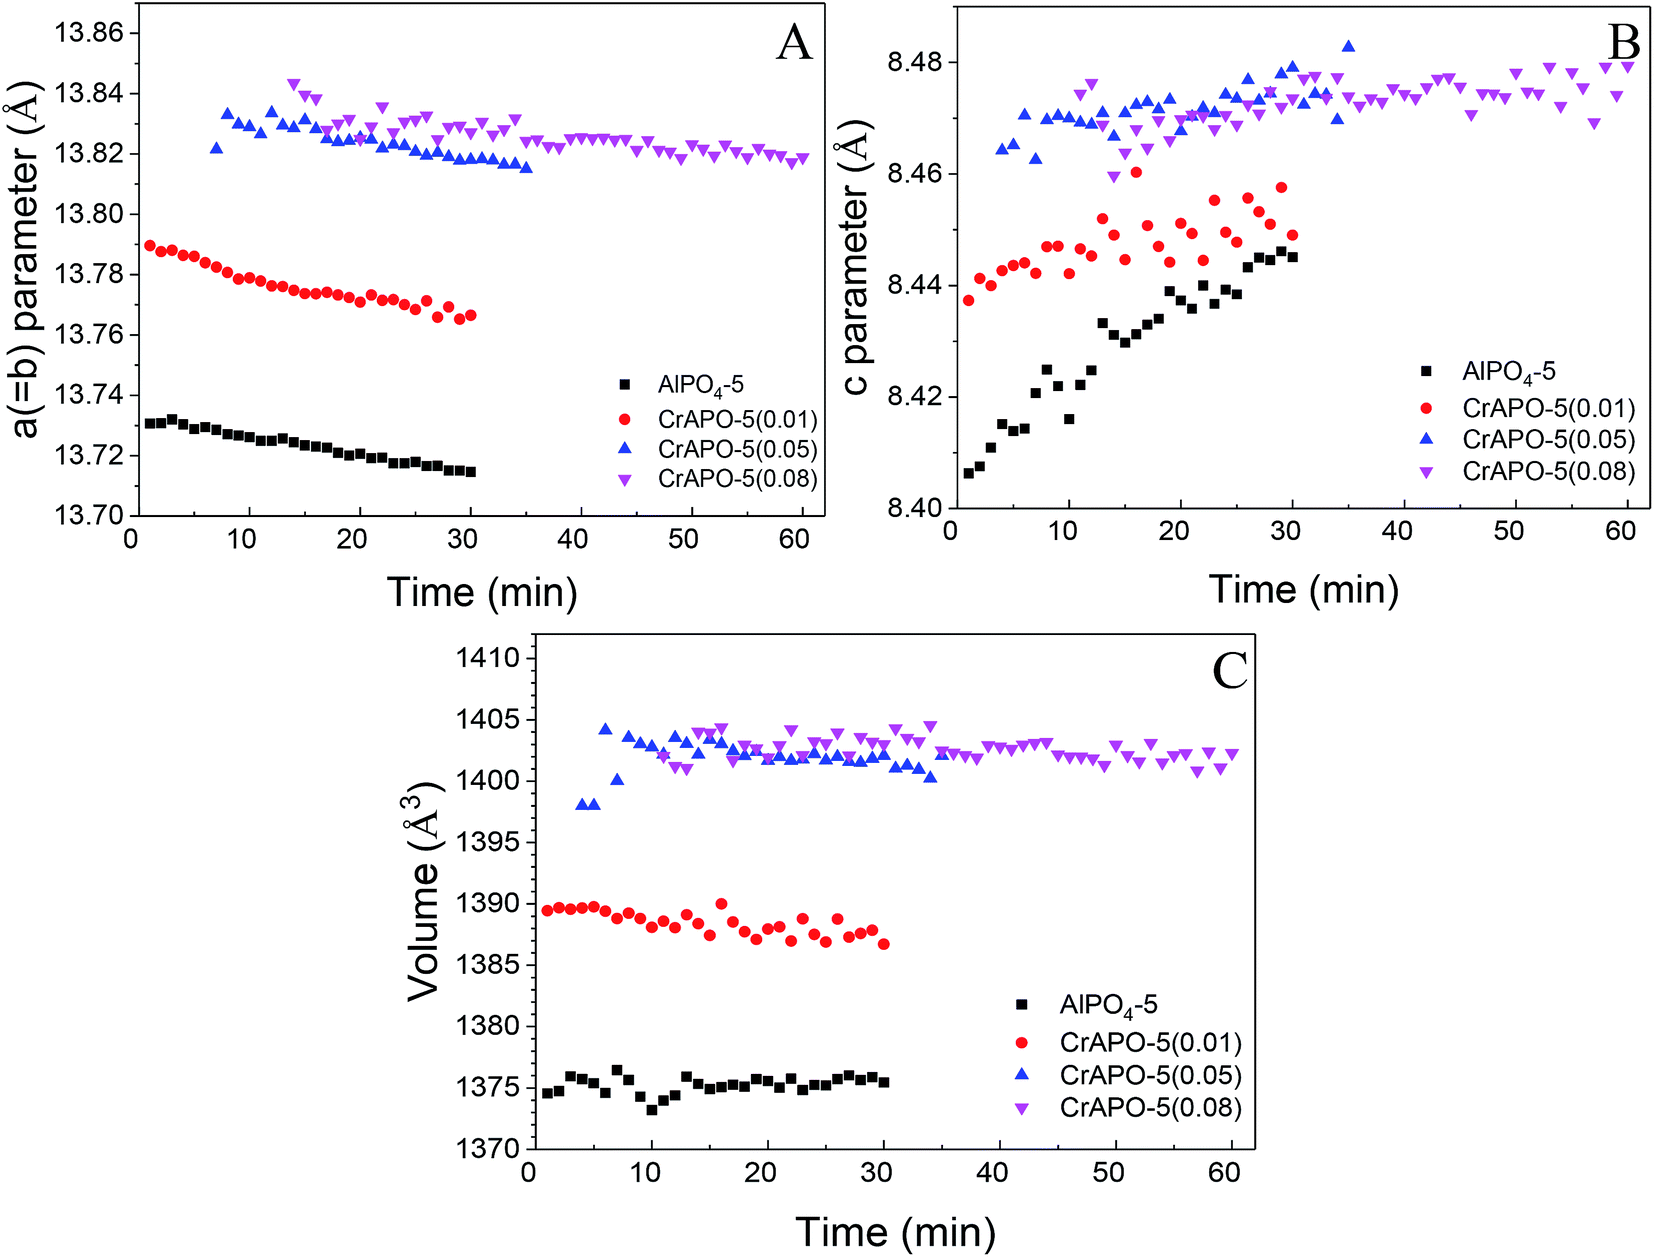 | ||
| Fig. 8 Variation in the lattice parameters obtained from HRXRD data recorded at the 4B9A (BSRF) beamline, as a function of time during the crystallization process; (A) shows a (=b) parameter change, (B) is the c parameter variation and (C) is the change in the cell volume over crystallization time. The analysis was performed only on data when the peak reflections were observed obviously. | ||
The change trend of c parameter is in contrast to that of a (=b) parameter. The c parameter was found to increase over crystallization time, more predominantly for un-substituted AlPO4-5 (by approximately 0.04 Å) compared to CrAPO-5 (increase of 0.01 Å). The increase in c parameter during the crystallization process could be ascribed to the uptake of water molecular and the template orientation, as explained by Sankar.41 The increase in the c parameter, over the crystallization time, was due to the uptake of water molecules which may coordinate to Al3+ ions accessible in the channel direction, increasing the Al–O bond distance from 1.74 Å for tetrahedral Al3+ up to 1.9 Å for an octahedral environment; the more hydrophilic pure AlPO4-5 (the electronegativity of Al3+, Cr3+, Co2+, and Zn2+ are 26.72, 14.41, 9.10 and 10.38, respectively.59) should therefore show a larger increase in the c parameter compared to MeAPO-5. On the other hand the template orientation within the structure could also play a role in this change in c parameter and cell volume. From these findings we can conclude that partial of Cr3+ ions in the gel was trapped into the AlPO4-5 framework in such a way as to cause an expansion in the a (=b) direction, which is perpendicular to the channel direction. A change in the c parameter and cell volume illustrates the flexibility of the AFI framework.
4. Conclusions
In this study, we have in situ investigated the kinetics and the structural parameters of AFI type CrAPO-5, particularly the variation in lattice constants, with time-resolved HRXRPD during the classical hydrothermal synthesis. Information extracted from the in situ HPXRPD experiment illustrates that the introduction of Cr3+ into pure AlPO4-5 influenced much on the crystallization process not only on the crystallization velocity, but also on the structural parameters. The crystallization was retarded severely by introducing Cr ions into the AlPO4-5 gels. The more the Cr3+ ions was in the gels, the stronger the inhibitory effect was. There was an interesting discovery that linear relationship was existed between the apparent activation energy and the Cr3+ content in the gels. The calculated Avrami exponent n was in the range of 1 to 1.3, which implied the similar 1D growth mechanism as that of AlPO4-5. The extracted structural parameters showed obviously crystal expansion, which was might be caused by the interaction between the framework P and [Cr(H2O)6]3+ ions, which need to be further studied.Conflict of interest
The authors declare no competing financial interest.Acknowledgements
This work was supported by the National Basic Research Program of China (Grant 21227002), and the Beijing Synchrotron Radiation Facility (BSRF). We are grateful to Prof. Jing Zhang and Prof. Zhonghua Wu (Institute of High-Energy Physics, Chinese Academy of Science) for their helpful discussion on the XAS and XRD data.References
- N. Sheng, Y. Chu, S. Xin, Q. Wang, X. Yi, Z. Feng, X. Meng, X. Liu, F. Deng and F.-S. Xiao, J. Am. Chem. Soc., 2016, 138, 6171–6176 CrossRef CAS PubMed.
- J. Xu, L. Chen, D. Zeng, J. Yang, M. Zhang, C. Ye and F. Deng, J. Phys. Chem. B, 2007, 111, 7105–7113 Search PubMed.
- J. Šponer, J. Čejka, J. Dědeček and B. Wichterlová, Microporous Mesoporous Mater., 2000, 37, 117–127 CrossRef.
- C. Zenonos, G. Sankar, F. Cora, D. W. Lewis, Q. A. Pankhurst, C. R. A. Catlow and J. M. Thomas, Phys. Chem. Chem. Phys., 2002, 4, 5421–5429 RSC.
- D. Grandjean, A. M. Beale, A. V. Petukhov and B. M. Weckhuysen, J. Am. Chem. Soc., 2005, 127, 14454–14465 CrossRef CAS PubMed.
- M. Dong, G. Wang, Z. Qin, J. Wang, T. Liu, Y. Xie and T. Hu, Presented in part at the From Zeolites to Porous MOF Materials – the 40th of International Zeolite Conference, 2007 Search PubMed.
- M. Dong, G. Wang, Z. Qin, J. Wang, T. Liu, S. Yuan and H. Jiao, J. Phys. Chem. A, 2007, 111, 1515–1522 CrossRef CAS PubMed.
- H. K. D. Nguyen, T. N. Don, G. Sankar and R. A. Catlow, Catal. Commun., 2012, 25, 125–129 CrossRef CAS.
- J. D. Chen, M. J. Haanepen, J. H. C. V. Hooff and R. A. Sheldon, in Stud. Surf. Sci. Catal., Elsevier, 1994, vol. 84, pp. 973–980 Search PubMed.
- R. A. Sheldon, J. D. Chen, J. Dakka and E. Neeleman, in Stud. Surf. Sci. Catal., ed. H. G. K. H. P. J. Weitkamp and W. Hölderich, Elsevier, 1994, vol. 83, pp. 407–416 Search PubMed.
- J. D. Chen, H. E. B. Lempers and R. A. Sheldon, Colloids Surf., A, 1995, 101, 137–146 CrossRef CAS.
- J. D. Chen and R. A. Sheldon, J. Catal., 1995, 153, 1–8 CrossRef CAS.
- H. E. B. Lempers and R. A. Sheldon, Appl. Catal., A, 1996, 143, 137–143 CrossRef CAS.
- A. M. Beale, D. Grandjean, J. Kornatowski, P. Glatzel, F. M. F. D. Groot and B. M. Weckhuysen, J. Phys. Chem. B, 2006, 110, 716–722 CrossRef CAS PubMed.
- B. M. Weckhuysen and R. A. Schoonheydt, Zeolites, 1994, 14, 360–366 CrossRef CAS.
- B. M. Weckhuysen, I. E. Wachs and R. A. Schoonheydt, Chem. Rev., 1996, 96, 3327–3349 CrossRef CAS PubMed.
- D. Demuth, K. K. Unger, F. Schueth, V. I. Srdanov and G. D. Stucky, J. Phys. Chem., 1995, 99, 479–482 CrossRef CAS.
- J. P. Lange, A. Gutsze and H. G. Karge, J. Catal., 1988, 114, 136–143 CrossRef CAS.
- B. Padlyak, J. Kornatowski, G. Zadrozna, K. Fabisiak and A. Gutsze, Mater. Sci., 2005, 23, 1035–1046 CAS.
- D. E. O'Reilly and D. S. MacIver, J. Phys. Chem., 1962, 66, 276–281 CrossRef.
- B. M. Weckhuysen, R. A. Schoonheydt, F. E. Mabbs and D. Collison, J. Chem. Soc., Faraday Trans., 1996, 92, 2431–2436 RSC.
- Z. Zhu, T. Wasowicz and L. Kevan, J. Phys. Chem. B, 1997, 101, 10763–10768 CrossRef CAS.
- Z. Zhu and L. Kevan, Phys. Chem. Chem. Phys., 1999, 1, 199–206 RSC.
- B. V. Padlyak, J. Kornatowski, G. Zadrozna, M. Rozwadowski and A. Gutsze, J. Phys. Chem. A, 2000, 104, 11837–11843 CrossRef CAS.
- A. Grave, Masteroppgave Master's thesis, Norwegian University of Science and Technology, Faculty of Natural Sciences and Technology, 2009.
- E. Groppo, C. Prestipino, F. Cesano, S. Bonino, C. Lamberti, P. C. Thüne, J. W. Niemantsverdriet and A. Zecchina, J. Catal., 2005, 230, 98–108 CrossRef CAS.
- D. Park, Y.-S. Yun and J. M. Park, J. Colloid Interface Sci., 2008, 317, 54–61 CrossRef CAS PubMed.
- J. Kornatowski, B. Wichterlová, M. Rozwadowski and W. H. Baur, in Stud. Surf. Sci. Catal., ed. H. G. K. H. P. J. Weitkamp and W. Hölderich, Elsevier, 1994, vol. 84, pp. 117–124 Search PubMed.
- P. Norby, Curr. Opin. Colloid Interface Sci., 2006, 11, 118–125 CrossRef CAS.
- R. J. Francis, S. O'Brien, A. M. Fogg, P. S. Halasyamani, D. O'Hare, T. Loiseau and G. Férey, J. Am. Chem. Soc., 1999, 121, 1002–1015 CrossRef CAS.
- A. N. Christensen, P. Norby and J. C. Hanson, Acta Chem. Scand., 1997, 51, 249–258 CrossRef CAS.
- A. N. Christensen, T. R. Jensen, P. Norby and J. C. Hanson, Chem. Mater., 1998, 10, 1688–1693 CrossRef CAS.
- P. Norby, A. Nørlund Christensen and J. C. Hanson, Stud. Surf. Sci. Catal., 1994, 84, 179–186 CrossRef CAS.
- P. Norby and J. C. Hanson, Catal. Today, 1998, 39, 301–309 CrossRef CAS.
- A. T. Davies, G. Sankar, C. R. A. Catlow and S. M. Clark, J. Phys. Chem. B, 1997, 101, 10115–10120 CrossRef CAS.
- K. Simmance, G. Sankar, R. G. Bell, C. Prestipino and W. V. Beek, Phys. Chem. Chem. Phys., 2010, 12, 559–562 RSC.
- G. Sankar, J. M. Thornas, F. Reya and G. N. Greavesb, J. Chem. Soc., Chem. Commun., 1995, 2549–2550 RSC.
- A. N. Christensen, P. Norby and J. C. Hanson, Microporous Mesoporous Mater., 1998, 20, 349–354 CrossRef CAS.
- P. Norby, A. N. Christensen and J. Hanson, Inorg. Chem., 1999, 38, 1216–1221 CrossRef CAS PubMed.
- M. G. O'Brien, M. Sanchez-Sanchez, A. M. Beale, D. W. Lewis, G. Sankar and C. R. A. Catlow, J. Phys. Chem. C, 2007, 111, 16951–16961 Search PubMed.
- K. Simmance, W. V. Beek and G. Sankar, Faraday Discuss., 2015, 177, 237–247 RSC.
- M. M. J. Treacy and J. B. Higgins, Collection of Simulated XRD Powder Patterns for Zeolites, 2001 Search PubMed.
- P. Sheng, Doctor's thesis, Chinese Academy of Sciences, Institute of Coal Chemistry, 2017.
- A. Bergamaschi, A. Cervellino, R. Dinapoli, F. Gozzo, B. Henrich, I. Johnson, P. Kraft, A. Mozzanica, B. Schmitt and X. Shi, J. Synchrotron Radiat., 2010, 17, 653–668 CrossRef CAS PubMed.
- R. Du, Q. Cai, Z. Chen, G. Yu, H. Liu and Z. Wu, Instrum. Sci. Technol., 2015, 1–11, DOI:10.1080/10739149.2015.1060608.
- R. Du, Z. Chen, Q. Cai, J. Fu, Y. Gong and Z. Wu, Chin. Phys. C, 2015, 7, 677011 Search PubMed.
- M. Avrami, J. Chem. Phys., 1939, 7, 1103–1112 CrossRef CAS.
- M. Avrami, J. Chem. Phys., 1940, 8, 212–224 CrossRef CAS.
- M. Avrami, J. Chem. Phys., 1941, 9, 177–184 CrossRef CAS.
- A. M. Fogg, S. J. Price, R. J. Francis, S. O'Brien and D. O'Hare, J. Mater. Chem., 2000, 10, 2355–2357 RSC.
- A. M. Beale, G. Sankar, C. R. A. Catlow, P. A. Anderson and T. L. Green, Phys. Chem. Chem. Phys., 2005, 7, 1856 RSC.
- J. D. Hancock and J. H. Sharp, J. Am. Ceram. Soc., 1972, 55, 74–77 CrossRef CAS.
- M. Milanesio, G. Artioli, A. F. Gualtieri, L. Palin and C. Lamberti, J. Am. Chem. Soc., 2003, 125, 14549–14558 CrossRef CAS PubMed.
- B. D. Cullity, Elements of X-Ray Diffraction, Addison-Wesley Company, U. S. A., 1956 Search PubMed.
- R. John and S. S. Florence, Chalcogenide Lett., 2010, 7, 269–273 Search PubMed.
- R. John and S. S. Florence, Chalcogenide Lett., 2009, 6, 535–539 CAS.
- R. D. Shannon and C. T. Prewitt, Acta Crystallogr., Sect. B: Struct. Crystallogr. Cryst. Chem., 1969, 25, 925–946 CrossRef CAS.
- R. D. Shannon, Acta Crystallogr., Sect. A: Cryst. Phys., Diffr., Theor. Gen. Crystallogr., 1976, 32, 751–767 CrossRef.
- Y. Feng, B. Zhang, L. Xuan and Y. Zhu, J. Dalian Inst. Light Ind., 1998, 17, 70–76 Search PubMed.
| This journal is © The Royal Society of Chemistry 2017 |