
 Open Access Article
 This Open Access Article is licensed under a
 Creative Commons Attribution 3.0 Unported Licence
Synthesis of short-chain passivated carbon quantum dots as the light emitting layer towards electroluminescence
Yuanfei Dingab,
Feng Zhangab,
Jiacong Xuab,
Yanqin Miaoab,
Yongzhen Yang*ab,
Xuguang Liu *ac and
Bingshe Xuab
*ac and
Bingshe Xuab
aMOE Key Laboratory of Interface Science and Engineering in Advanced Materials, Taiyuan University of Technology, Taiyuan 030024, China. E-mail: yyztyut@126.com; liuxuguang@tyut.edu.cn
bResearch Center of Advanced Materials Science and Technology, Taiyuan University of Technology, Taiyuan 030024, China
cCollege of Chemistry and Chemical Engineering, Taiyuan University of Technology, Taiyuan 030024, China
First published on 31st May 2017
Abstract
Short-chain passivated fluorescent carbon quantum dots (S-CQDs) with graphitic structure were synthesized via a one-step hydrothermal approach using phthalic acid with a benzene ring conjugated structure as the carbon source and ethylenediamine as a nitrogenous additive. The synthesized S-CQDs have an average diameter of 5.53 nm and exhibit excitation-dependent photoluminescence emission. The S-CQD aqueous solution emits bright blue light under ultraviolet excitation with a quantum yield of 29.3%. The optical band gap of the S-CQDs was calculated to be 4.26 eV, the highest occupied molecular orbital and the lowest unoccupied molecular orbital energy levels of −8.35 and −4.09 eV were obtained for the S-CQDs by cyclic voltammetry. In addition, the S-CQDs have a good film-forming ability, as confirmed by atomic force microscopy analysis. By virtue of the structure characteristics, optical properties and the film-forming ability of S-CQDs, quantum dot-based electroluminescent light emitting diodes (QD-LEDs) were fabricated by a solution processing method with S-CQDs as the emitting layer, which emits blue light at 6–9 V driving voltage, showing that the S-CQDs have promising prospects for application in QD-LEDs.
Introduction
Quantum dot-based electroluminescent light emitting diodes (QD-LEDs), which are the devices based on quantum dots (QDs) as a light emitting layer, have turned out to be promising for application in illumination and full-color displays owing to their easy and simple fabrication techniques, low power consumption, high color saturation and tunable emitting color by the size of QDs.1,2Serving as an emitting layer, QDs are a class of quasi-zero dimensional nanomaterials smaller than the Bohr exciton radius, with energy levels quantized.3 Following the development of high quality semiconductor quantum dots, QD-LEDs are generally fabricated by semiconductor QDs as the emitting layer and organic materials as the electron–hole transport layer.4–8 Such emitters exhibit tunable and highly saturated color with a narrow-band emission.9–14 However, the use of these semiconductor QDs with toxic cadmium or other heavy metals generally leads to environmentally unfriendly issues, which greatly limits their practical application.15–17
Carbon quantum dots (CQDs)18 are one new class of fluorescent QDs. Serving as optical materials, CQDs possess not only optical properties of semiconductor QDs (e.g., tunable luminescence emission and high photostability) but also particular merits including low toxicity, low cost, chemical stability and environmental friendliness.19,20 Now, regarding the application of optoelectronic devices, CQDs mainly exert their photoluminescence (PL) properties as light conversion phosphors for white light emitting diodes (LEDs).21,22 Meanwhile, researchers have gradually been exploring the electroluminescent (EL) properties of CQDs as emitting layer to develop carbon quantum dot-based electroluminescent light emitting diodes (CQD-LEDs). The electroluminescent properties of CQDs allow electrons and holes to form excitons in CQDs, and the excitons decay to stimulate the emission of CQDs.15,23–25 However, the investigations about the new members as emitting layer of the electroluminescent devices are only in the initial stage. Zhang et al. prepared a blue emitting CQD-LEDs with a turn-on voltage of 5 V and a maximum brightness of 24 cd m−2 using CQDs with fluorescence quantum yield (QY) of ≈40% as emitting layer that were synthesized by thermally carbonizing citric acid in hot octadecene with 1-hexadecylamine as the passivation agent;25 Similarly, Veca et al. fabricated a bluish white emitting CQD-LEDs with a maximum brightness of 0.14 cd m−2 taking graphitic structure CQDs as emitting layer that were prepared by oxidizing carbon nano-powder sample in aqueous nitric acid solution and then amidating the sample with PEG1500N in SOCl2 medium.23 Wherein, the graphitic structure of the CQDs is conducive to electron transfer. Moreover, the two kinds of CQDs used by Zhang et al.25 and Veca et al.23 have the long-chain passivation layer. The presence of surface passivating agent can improve the optical properties of CQDs.18 However, the long-chain passivating endows the surface of CQDs with the organic ligand insulating layer in a thickness of larger than 0.5 nm, which induces a minimal tunnelling barrier to hinder the injection of electrons and holes. Compared with the long-chain passivated CQDs, the short-chain passivated CQDs have no insulating layer of larger than 0.5 nm thickness on their surfaces. The absence of the minimal tunneling barrier reduces the obstacle of carrier injection, thus improving the carrier injection ability.6 In other words, with respect to the long chains, the short-chain cap on the CQDs shortens the distances of carriers from CQDs, which probably facilitates the injection of carriers into CQDs more easily.26,27 Hence, it is necessary to find a simple and effective method for synthesizing CQDs with good carrier injection mobility and superior QY, and then, as light-emitting layers to achieve CQD-LEDs with high performance.
In this paper, ethylenediamine (EDA) was used as nitrogenous short-chain additive to improve the carrier injection ability of CQDs and to obtain superior QY. Meanwhile, phthalic acid (PA) with benzene ring conjugated structure was used as carbon source for preparing the short-chain passivated fluorescent carbon quantum dots (S-CQDs) with high electrical conductivity and graphitic structure. A one-step hydrothermal method was chosen to simply and effectively prepare S-CQDs. Then, the S-CQDs were dispersed in toluene solvent as emitting layer for the fabrication of CQD-LEDs. A 40 nm-thick poly(ethylenedioxythiophene)polystyrene sulfonate (PEDOT:PSS) film as hole injection layer (HIL) and a 40 nm-thick 1,3,5-tris(N-phenylbenzimidazol-2-yl)benzene (TPBI) film as electron transport layer (ETL) were inserted into the two sides of the emitting layer to improve the injection efficiency of holes from ITO cathode and electrons from LiF/Al anode, which follows the work by Wang et al.15 This method was used to fabricate CQD-LEDs with improved performance. Schematic illustration of synthesizing S-CQDs for CQD-LEDs is shown in Scheme 1.
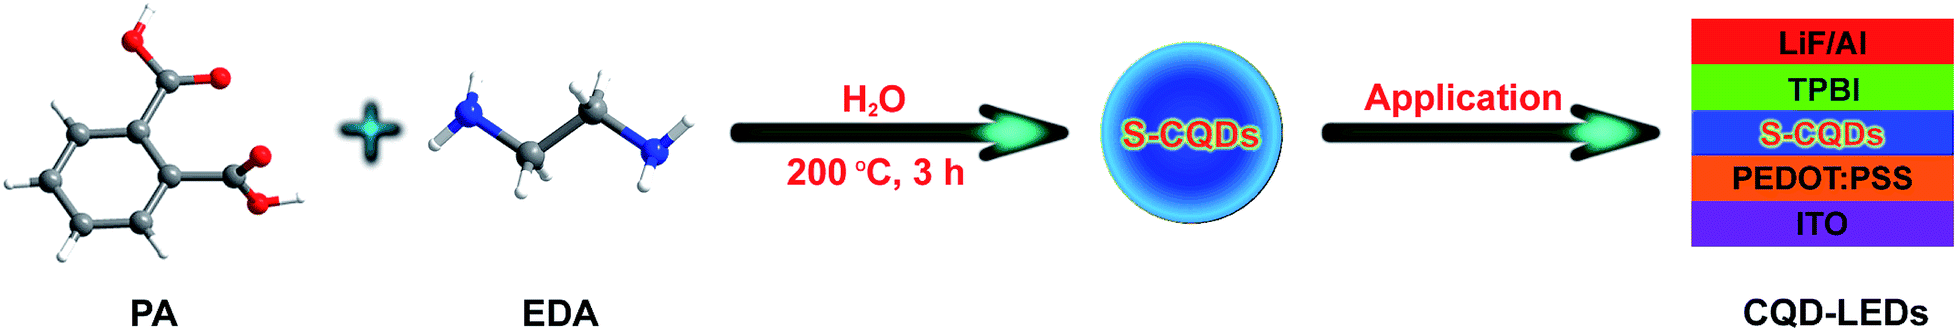 | ||
| Scheme 1 Schematic illustration of synthesizing S-CQDs for CQD-LEDs. | ||
Experimental
Materials
PA was obtained from Guangfu Technology Development Co., Ltd (Tianjin, China). EDA was purchased from Fuchen Chemical Reagent Factory (Tianjin, China). All chemicals were commercially available and were used without further purification.Synthesis of CQDs
S-CQDs were prepared by one-step hydrothermal treatment using PA (1.66 g, 0.01 mol) as carbon source, EDA (0.67 mL, 0.01 mol) as additive and deionized water (40 mL) as solvent. Typically, PA, EDA and deionized water were shifted into a 100 mL Teflon-lined stainless-steel autoclave and heated at 200 °C for 3 h. After cooling to room temperature, the crude solution was filtered with a 0.22 μm polyethersulfone membrane to remove larger nanoparticles. Then the resulting S-CQDs solution was further purified in a dialysis bag (cutoff molecular weight: 1000 Da) for 12 h to remove impurities and the water was changed every 3 h. After these steps, the S-CQDs aqueous solution was collected for characterization such as ultraviolet-visible absorption, emission behavior, and QY measurements. Then the powder S-CQDs were acquired by freeze drying and kept for characterization of morphology, chemical composition, electrochemical property or redispersed in toluene to prepare S-CQDs toluene solution (1 mg mL−1) by ultrasonic dispersion for further use. Long-chain passivated fluorescent carbon quantum dots (L-CQDs) were prepared by one-step solvothermal treatment using PA (0.83 g, 0.005 mol) as carbon source, 1-hexadecylamine (1.21 g, 0.005 mol) as long-chain passivator and octadecene (15 mL) as solvent. Typically, PA, 1-hexadecylamine and octadecene were transferred into a 100 mL Teflon-lined stainless-steel autoclave and heated at 200 °C for 3 h. After cooling to room temperature, the final products were purified by precipitating with acetone three times and further purified by column chromatography. The obtained powder L-CQDs were redispersed in toluene to prepare L-CQDs toluene solution (1 mg mL−1) for further use.Fabrication of CQD-LEDs
ITO-coated substrate was cleaned ultrasonically in deionized water, acetone in twice and isopropanol for 20 min each. After cleaning, it was treated by UV-ozone for 10 min. During these treatments the ITO surfaces are exposed to reactive oxygen species. The oxygen-enriched surfaces were achieved, particularly with the formation of peroxides. A downward shift of the Fermi level is obtained by reducing the charge distribution density at or near the surface via oxygen implantation. The shift of the Fermi level contributes to the increase in the ITO work function. The formed surface peroxide species lead to an increased ionization potential (surface dipole), which also contributes to the increase in the work function.28 PEDOT:PSS was then spin-coated on the UV-ozone treated ITO surface to give a 40 nm-thick film at 3000 rpm for 60 s with 180 μL of PEDOT:PSS solution, followed by annealing in an oven at 120 °C for 20 min in air. Subsequently, the emissive layer of S-CQDs was spin-coated from the toluene solution on the surface of PEDOT:PSS at 1000 rpm for 30 s with 360 μL of CQD toluene solution and annealed at 120 °C for 20 min. Then, 40 nm-thick TPBI, 1 nm-thick LiF, and 100 nm-thick aluminum were sequentially deposited in thermal evaporator under high vacuum (5 × 10⁻⁴ Pa). For hole- and electron-only devices, the parameters of L-CQDs spin-coating and annealing are the same as those for S-CQDs. For hole-only devices, 40 nm-thick N,N′-bis-(1-naphthalenyl)-N,N′-bis-phenyl-(1,1′-biphenyl)-4,4′-diamine (NPB) was deposited in thermal evaporator under high vacuum (5 × 10⁻⁴ Pa).Characterization
Ultraviolet-visible (UV-vis) absorption and emission spectra were recorded on a Hitachi U3900 UV-vis spectrophotometer and a Horiba Fluoromax-4 luminescence spectrometer. The fluorescence lifetime of the S-CQDs was measured with Transient Fluorescence & Phosphorescence (FLS980). The QY of S-CQDs was obtained by a comparative method. Quinine sulfate (QY = 54%) in 0.10 M H2SO4 was chosen as the reference to determine the QY of S-CQDs in aqueous solution at different concentration. All the absorbance values of the solutions were measured at 360 nm. Absorbance values were kept under 0.1 at the excitation wavelength for minimizing re-absorption effects. The integrated emission intensity is the area under the emission curve from 380 to 700 nm. The linear fitting lines of the integrated emission intensity against the absorbance were plotted. Finally, QY was calculated as follows (1):| Q = Qst(K/Kst)(η/ηst)2 | (1) |
Results and discussion
Morphology and structure of the S-CQDs
The morphology and microstructure of the S-CQDs were characterized by TEM. As is shown in Fig. 1(a), S-CQDs are quasi-spherical and well dispersed without obvious aggregation, the majority of the particles fall in the range of 4 to 7 nm in diameter. According to the size distribution histogram (inset in Fig. 1(a)), the average particle size of these CQDs is calculated to be 5.53 nm. The HRTEM image shows that S-CQDs have well-resolved lattice fringes (inset in Fig. 1(b)). The lattice spacing of 0.22 nm agrees well with the (100) diffraction facets of graphite.29,30 The results illustrate that the S-CQDs are structured like crystalline graphite carbon. As shown in Fig. 1(c), PXRD pattern was acquired to further analyze the crystallinity of S-CQDs. A broad diffraction peak at 2θ = 21.4° is consistent with the (002) facet of graphite structure. The interlayer spacing of (002) diffraction facet is enlarged by the presence of surface functional groups, which is calculated to be 0.42 nm, larger than that of graphite (0.33 nm).29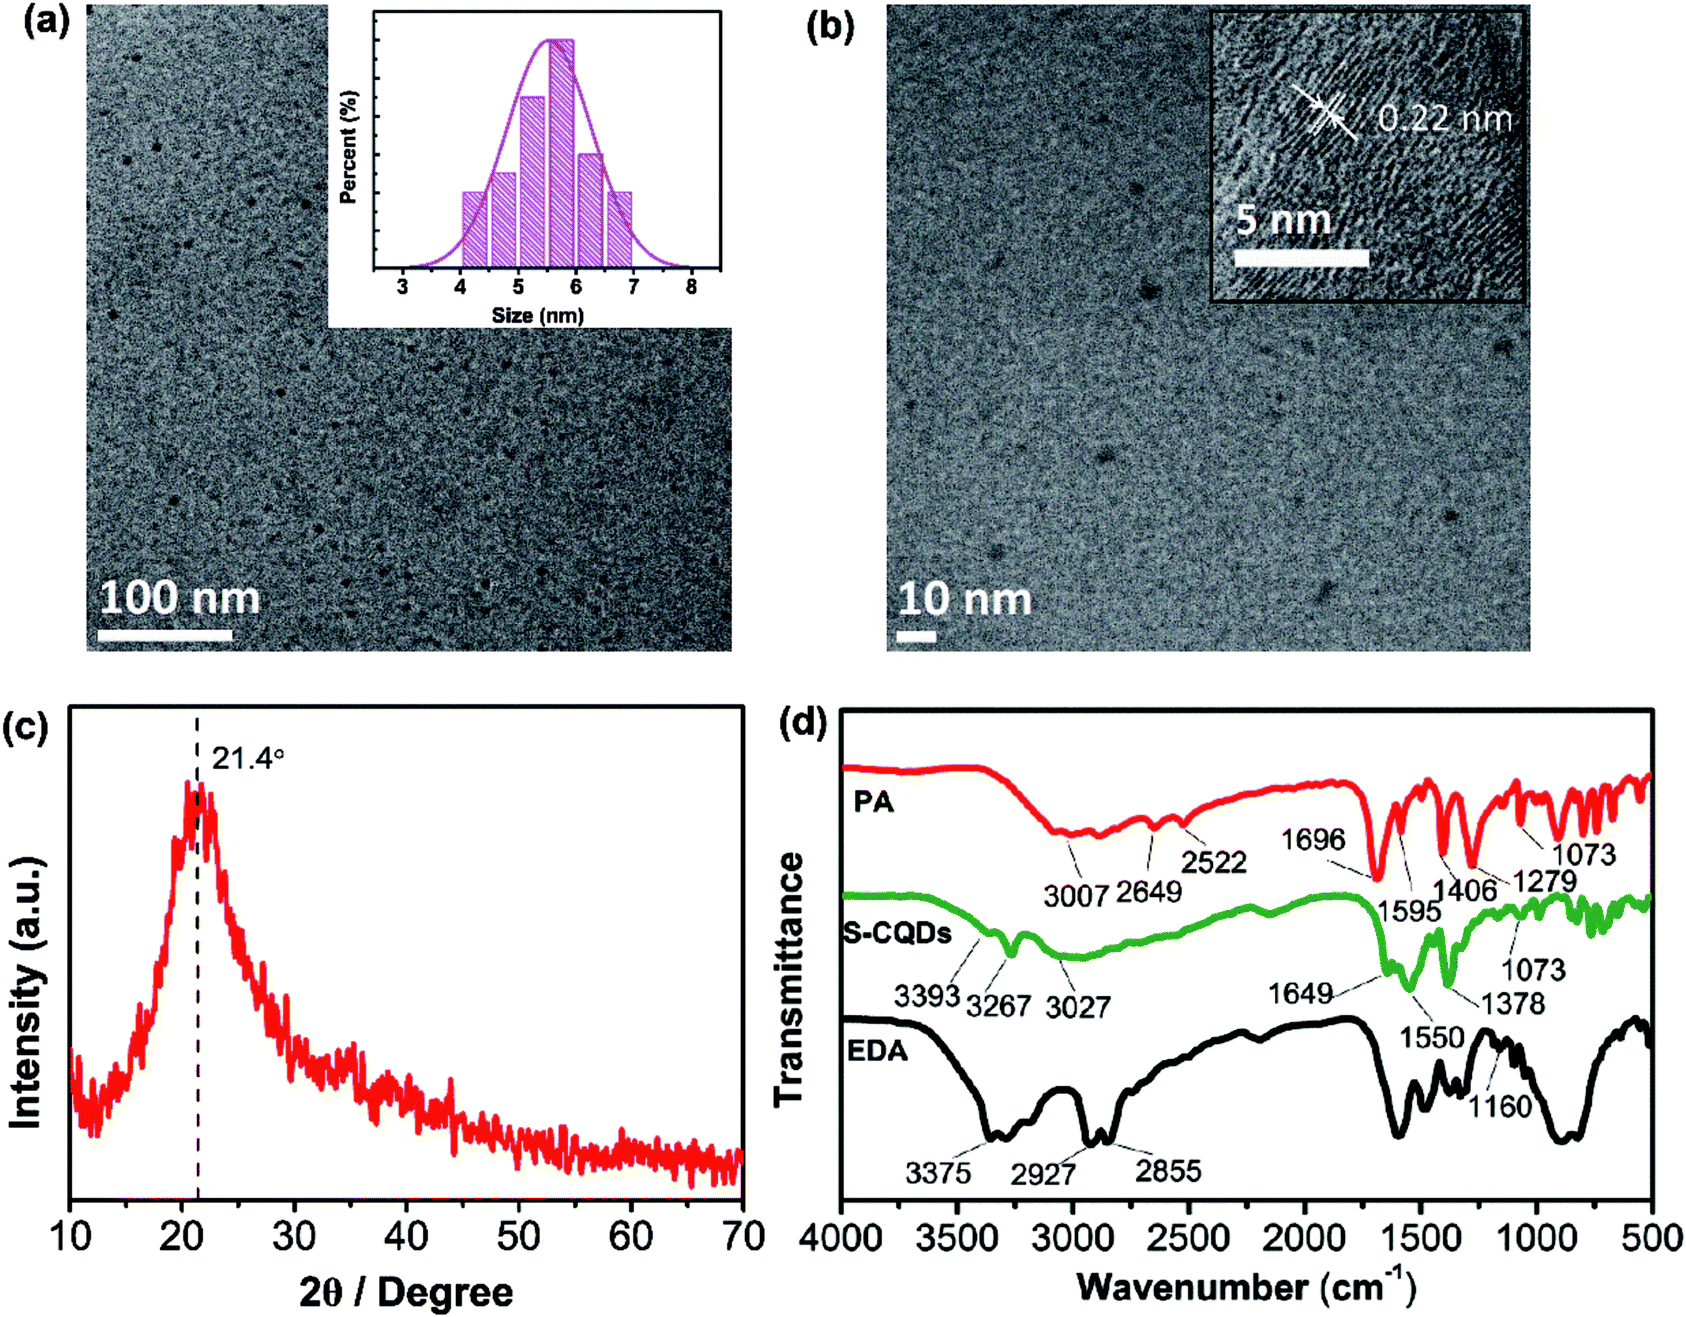 | ||
| Fig. 1 (a) TEM image of S-CQDs (inset is their size distribution) and (b) the HRTEM image of S-CQDs. (c) PXRD pattern of S-CQDs and (d) FTIR spectra of PA, S-CQDs and EDA. | ||
The polymer-like intermediates are obtained by dehydration polymerization of EDA and PA, and finally carbonized through intramolecular dehydration of the intermediates to form S-CQDs with EDA as short chain ligand. To analyze the surface chemical structure of S-CQDs, FTIR spectra of PA, EDA and S-CQDs were obtained (Fig. 1(d)). For PA, the stretching of O–H at 2649 and 2522 cm−1 originates from –COOH. The stretching of C![[double bond, length as m-dash]](https://www.rsc.org/images/entities/char_e001.gif) O and C–OH at 1696 and 1279 cm−1 also stems from –COOH groups. For EDA, the bands at 2855 and 2927 cm−1 represent the stretching of –CH and –CH2, respectively. The bands at 1160 and 3375 cm−1 originate from the stretching of C–N and –NH2, respectively. In the FTIR spectra of PA and S-CQDs, the broad bands at 3007 and 3027 cm−1 are attributed to the stretching vibration of C–H in aromatic hydrocarbon, the bands at 1406 and 1378 cm−1 represent the stretching of C–H. For S-CQDs, the characteristic absorption bands at 3267, 1649 and 1550 cm−1 represent the stretching of N–H and CO in –CONH and CC in aromatic ring, respectively. The band at 3393 cm−1 originates from the –NH2 groups of S-CQD surfaces. For S-CQDs, the characteristic absorption bands at 3267, 1649 and 1550 cm−1 represent the stretching of N–H and CO in amide bond and CC in aromatic ring, respectively. The band at 3393 cm−1 originates from the surface –NH2 groups of S-CQDs. The results indicate that –CONH is introduced to S-CQDs by dehydration between –NH2 and –COOH groups, finally short-chain ligand is grafted on the surface of S-CQDs by dehydration of one of –NH2 groups in EDA.31
O and C–OH at 1696 and 1279 cm−1 also stems from –COOH groups. For EDA, the bands at 2855 and 2927 cm−1 represent the stretching of –CH and –CH2, respectively. The bands at 1160 and 3375 cm−1 originate from the stretching of C–N and –NH2, respectively. In the FTIR spectra of PA and S-CQDs, the broad bands at 3007 and 3027 cm−1 are attributed to the stretching vibration of C–H in aromatic hydrocarbon, the bands at 1406 and 1378 cm−1 represent the stretching of C–H. For S-CQDs, the characteristic absorption bands at 3267, 1649 and 1550 cm−1 represent the stretching of N–H and CO in –CONH and CC in aromatic ring, respectively. The band at 3393 cm−1 originates from the –NH2 groups of S-CQD surfaces. For S-CQDs, the characteristic absorption bands at 3267, 1649 and 1550 cm−1 represent the stretching of N–H and CO in amide bond and CC in aromatic ring, respectively. The band at 3393 cm−1 originates from the surface –NH2 groups of S-CQDs. The results indicate that –CONH is introduced to S-CQDs by dehydration between –NH2 and –COOH groups, finally short-chain ligand is grafted on the surface of S-CQDs by dehydration of one of –NH2 groups in EDA.31
XPS spectra were also measured to explore the surface structure of S-CQDs (Fig. 2). The full scan XPS spectra of the S-CQDs show three peaks at 285 (C1s), 400 (N1s) and 531 eV (O1s) (Fig. 2(a)). The C1s spectra (Fig. 2(b)) have four peaks at 284.7 (CC/C–C), 285.5 (C–N), 286.4 (C–O) and 288.0 (CO) eV. The N1s spectra (Fig. 2(c)) exhibit three peaks at 399.7, 400.6 and 401.4 eV, which correspond to aromatic C–N, N–CO and N–H, respectively. The aromatic C–N and N–CO signal peaks also show that EDA is involved in the formation of S-CQDs by dehydration between –NH2 and –COOH groups.32 The O1s (Fig. 2(d)) spectra present two peaks at 530.6 (C–O) and 531.3 (CO) eV, which reveal the presence of carboxylic group. The atom ratio of C![[thin space (1/6-em)]](https://www.rsc.org/images/entities/char_2009.gif) :O:N is also calculated as 58.3:30.2:11.5 by XPS spectra.33
:O:N is also calculated as 58.3:30.2:11.5 by XPS spectra.33
 | ||
| Fig. 2 (a) XPS spectra and corresponding expansion for (b) C1s, (c) N1s and (d) O1s peaks of S-CQDs. | ||
Optical properties of S-CQDs
To explore the optical properties of S-CQDs, UV-vis absorption and PL spectra were measured. As shown in Fig. 3(a), UV-vis absorption spectra exhibit two obvious absorption peaks at 274 and 308 nm. The strong absorption peak at 274 nm is attributed to π–π* transition of aromatic CC bond34–37 and the relatively weak absorption peak at 308 nm corresponds to n–π* transition of CO bond.33,38 The two absorption peaks indicate the existence of conjugated structures and oxygen-containing functional groups in S-CQDs. The PL spectra of S-CQD aqueous solution in Fig. 3(a) show a strong peak at 439 nm upon excitation at 360 nm. The S-CQD aqueous solution emits colourless under daylight (inset left in Fig. 3(a)) but blue light under 365 nm UV lamp (inset right in Fig. 3(a)).
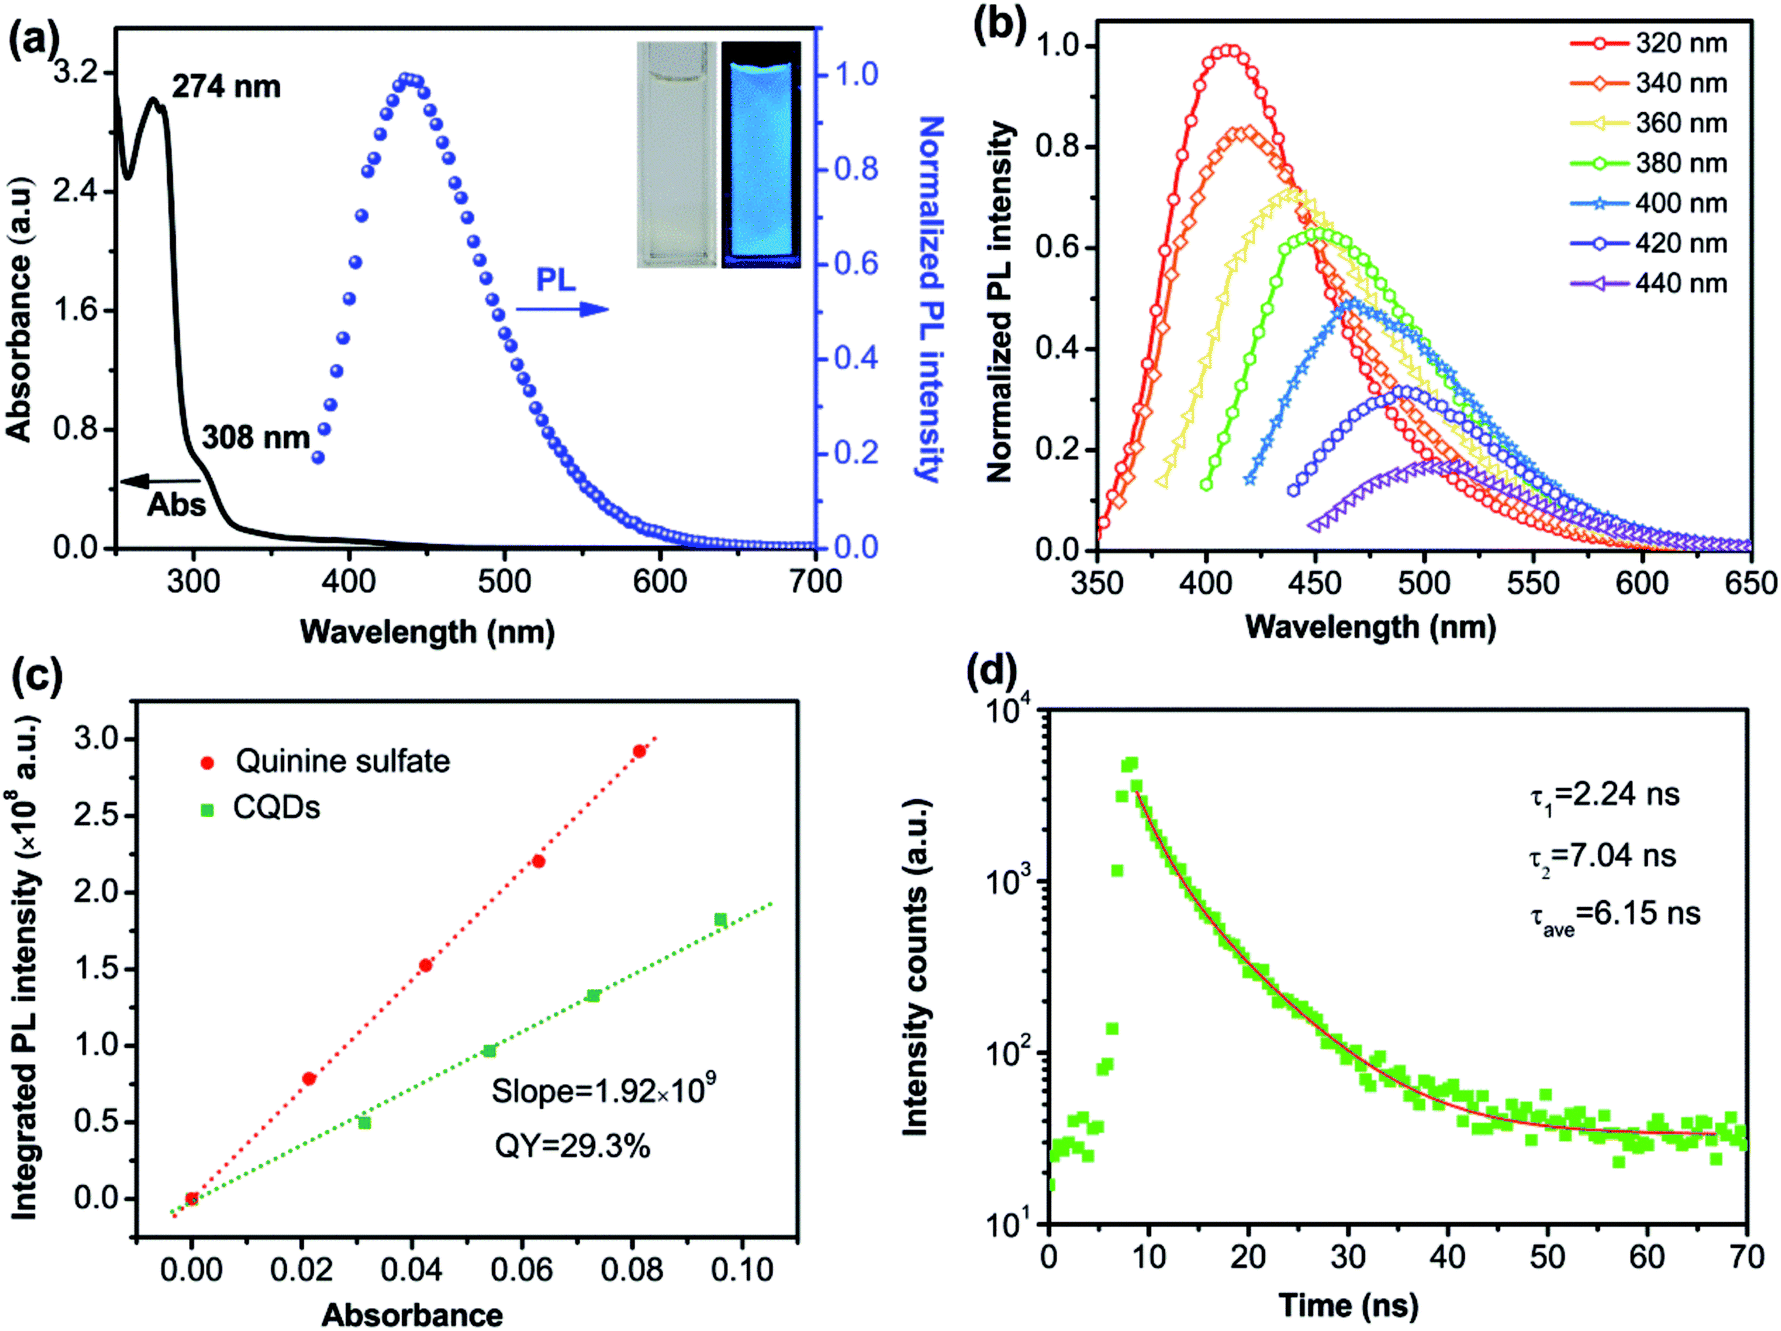 | ||
| Fig. 3 (a) UV-vis absorption spectra of CQD aqueous solution and PL spectra of CQD aqueous solution at excitation wavelength of 365 nm. Inset: the photograph of S-CQDs aqueous solution under daylight (left) and UV light (right). (b) PL spectra of S-CQDs under different excitation wavelengths. (c) QY diagram and (d) fluorescence-decay and fitted curves of S-CQDs. | ||
The S-CQDs exhibit excitation-dependent PL emission (Fig. 3(b)), which is possibly resulted from the nonuniform size and diversified surface sates of S-CQDs.39 The PL intensity of S-CQD aqueous solutions decreases as the excitation wavelength increases from 320 to 440 nm. The emission centers denote the surface states of CQDs.40 CQDs have many emission centers because of different surface chemical groups on CQDs. The distribution of emission centers on CQDs can be reflected by their PL spectra. At certain excitation wavelength, the corresponding emission center could be excited to exhibit fluorescence, resulting in the excitation-dependent behaviors of PL spectra.41,42 The dominant emission center, corresponding to the emission peak, indicates the emission center as a leading role under certain excitation wavelength. Only a small portion of the deeper surface states can be excited by long wavelength because the excitation energy is smaller than the band gap of the dominant emission center.43 Eventually, the fluorescence decreases greatly. In addition, the emission wavelength exhibits a red-shift with the increase of excitation wavelength. Different functional groups may act as different emission centers to emit light. The dominant emission center may transfer to the emission center of smaller band gap with the increase of excitation wavelength.43 The energy of longer wavelength is mainly used for exciting the longer wavelength emission with smaller band gap, being not enough to excite shorter wavelength emission with bigger band gap.25 Consequently, the emission peak is at the long wavelength when the excitation energy is low; while it is at the short wavelength when the excitation energy is high.
The QY was tested with quinine sulfate as a standard (QY = 54%). As shown in Fig. 3(c), the QY of the S-CQDs is calculated as 29.3%. Over many experiments, the COOH and NH2 groups in reactants were found to be very important for the QY of CQDs. The QY depends on the competition between the emissive sites and non-radiative traps.22 The COOH groups serve as non-radiative recombination centers of electron–hole pairs,40 the nitrogen-doping introduces a kind of surface state (such as amino or amido bond). Electrons trapped by the nitrogen doped surface states are able to depress the effect of non-radiative recombination and accelerate that of radiative recombination.39,44 The active COOH groups can combine more NH2 groups to increase the QY of S-CQDs.45 Ultimately, S-CQDs with high QY are likely to favor the optical performance of CQD-LEDs.24 Furthermore, the QY is expected to be further improved by optimizing synthesis parameters22,46 and co-doping with nitrogen and sulfur.39,47
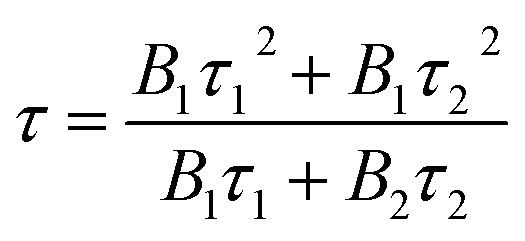
The fluorescence decay lifetime of S-CQDs was estimated under the excitation of 375 nm and the emission of 455 nm by using multidimensional time-correlated single photon counting (TCSPC) method. As depicted in Fig. 3(d), the decay trace of S-CQDs was fitted using bi-exponential function in eqn (2):
|
R(t) = B1exp(−t/τ1) + B2exp(−t/τ2)
| (2) |
 | (3) |
The test results show that decay curve has two lifetime components of 2.24 (τ1) and 7.04 ns (τ2), and the corresponding pre-exponential factors are 0.05 (B1) and 0.07 (B2), respectively. The average lifetime of S-CQDs is calculated to be 6.15 ns. The slow decay is due to the effective relaxation of carriers from carbogenic core onto the surface states and the fast decay is attributed to the recombination of carriers on the surface states.43
HOMO and LUMO energy levels of S-CQDs
Apart from the optical property, S-CQDs can also serve as a good electron donor and acceptor.24,25 To acquire the highest occupied molecular orbital (HOMO) and the lowest unoccupied molecular orbital (LUMO) energy levels, cyclic voltammetry measurements were implemented. The CV curves of 0.1 mol L−1 TBAP-DMF solution and 0.1 mol L−1 TBAP-DMF with S-CQDs solution are shown in Fig. 4(a), in which the S-CQDs exhibit apparently a reversible reduction process. By extrapolating the CV curve of TBAP-DMF solution with S-CQDs, the onset reduction potential (Eonsetred) was determined to be −0.65 V vs. SCE. By extrapolating the (ahν)2–hν (where a: absorbance, h: Plank's constant, and ν: frequency) curve (Fig. 4(b)), the band gap (Eg) of the S-CQDs was estimated to be 4.26 eV (Fig. 4(b)).48 The LUMO and HOMO energy levels (ELUMO and EHOMO) were then calculated to be −4.09 and −8.35 eV, respectively, by eqn (4):15| ELUMO = −e(Eonsetred + 4.74), EHOMO = ELUMO − Eg | (4) |
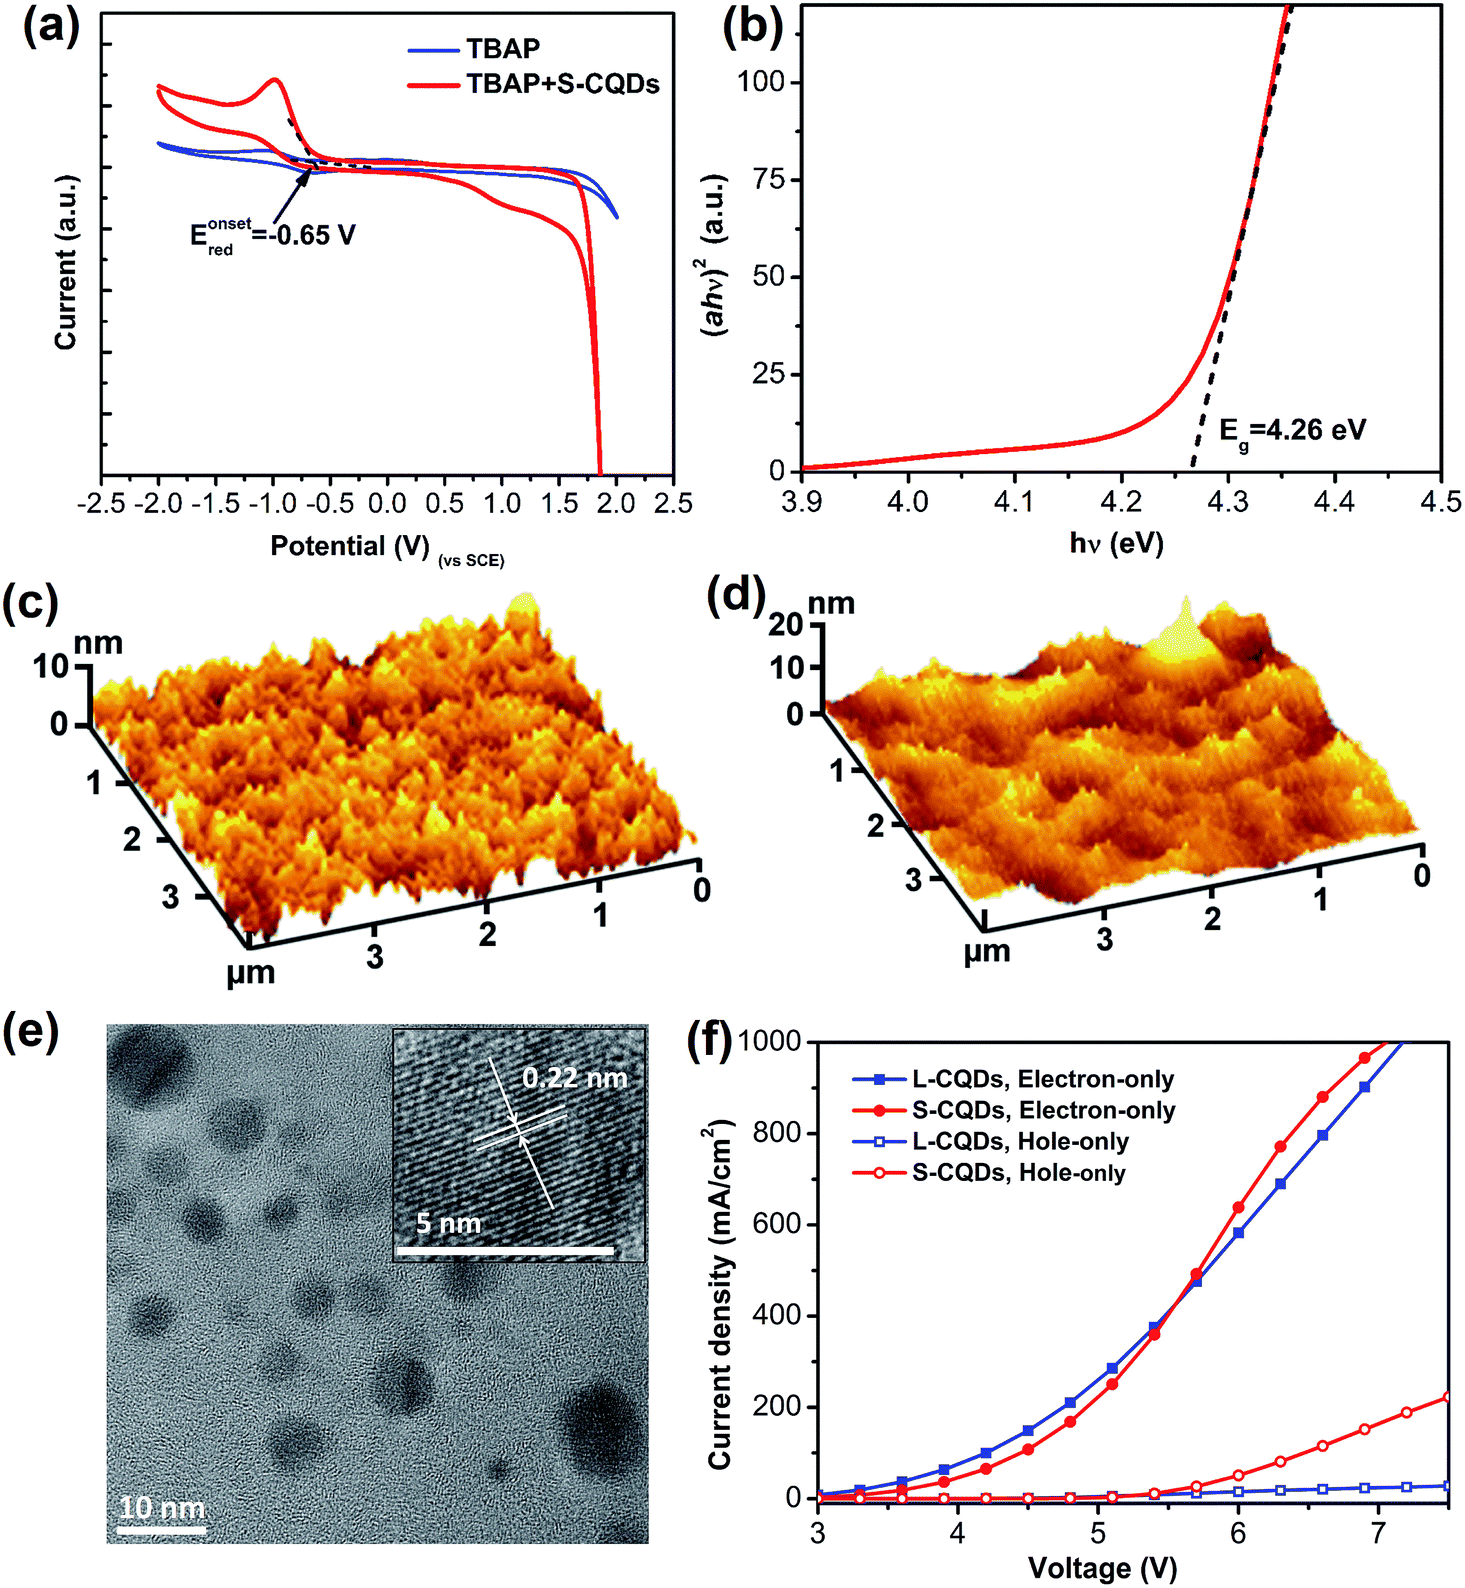 | ||
| Fig. 4 (a) Cyclic voltammogram of the 0.1 mol L−1 TBAP-DMF solution and the S-CQDs in 0.1 mol L−1 TBAP-DMF solution at a scan rate of 0.1 V s−1. (b) The dependence of (ahν)2 on hν for the S-CQDs, from which a band gap of 4.26 eV is deduced. AFM images of (c) 40 nm-thick PEDOT:PSS surface and (d) S-CQDs surface atop of 40 nm-thick PEDOT:PSS. (e) TEM image (inset is HRTEM image) of L-CQDs. (f) Current-density–voltage characteristics of electron- and hole-only devices based on L-CQDs and S-CQDs. | ||
CQD-LEDs demonstration
To investigate the film-forming ability of S-CQDs, the AFM images of 40 nm-thick PEDOT:PSS and S-CQDs atop of 40 nm-thick PEDOT:PSS are shown in Fig. 4(c) and (d), respectively. Nearly uniform and flat films are presented without massive aggregation. The average surface roughness (Ra) of PEDOT:PSS films (Fig. 4(c)) and S-CQDs films (Fig. 4(d)) was calculated to be 1.313 and 2.235 nm, respectively. The root mean square roughness (RMS) of PEDOT:PSS films (Fig. 4(c)) and S-CQD films (Fig. 4(d)) was calculated to be 1.647 and 2.997 nm, respectively. The results prove that S-CQDs in toluene solution are beneficial to the dispersion of S-CQD particles to form high-quality film. The aggregate morphology between S-CQD particles has an effect on the transmission and radiation of carriers. This can be explained by the luminous quenching and the poor charge transportation arising from intensive distribution and sparse distribution of S-CQD particles, respectively. Therefore, an appropriate dispersion density of S-CQD particles is required.In order to compare the carrier injection ability of S-CQDs with that of L-CQDs, L-CQDs were prepared by one-step solvothermal treatment using PA as carbon source, 1-hexadecylamine as long-chain passivator and octadecene as solvent. Fig. 4(e) shows that L-CQDs also have similar graphitic structure with S-CQDs. Single carrier devices with only electrons or holes moving through CQDs are fabricated and characterized to compare the carrier injection ability of S-CQDs and L-CQDs. The electron-only devices have a multilayer structure of ITO/CQDs/TPBI (40 nm)/LiF (1 nm)/Al (100 nm). The hole-only devices have a structure of ITO/PEDOT:PSS (40 nm)/CQDs/NPB (40 nm)/Al (100 nm), where PEDOT:PSS and NPB is hole injection layer. In the hole-only devices, the current represents the hole transport behavior for the device.49 From the current density–voltage (J–V) characteristics of the electron-only and hole-only devices shown in Fig. 4(f), we see that both the electron and hole currents of S-CQDs are higher than those of L-CQDs at voltage range of 5.5–7 V, especially for the hole current. The results indicate that S-CQDs can improve the injection ability of electrons and holes. The surface of L-CQDs may form an organic insulating layer larger than 0.5 nm in thickness, which would forms a minimal tunneling barrier to hinder the injection of electrons and holes.6 Compared with the L-CQDs, the S-CQDs have no insulating layer of larger than 0.5 nm thickness on their surfaces. The absence of the tunneling barrier reduces the obstacle of carrier injection, thus improving the carrier injection ability.
To further explore the electroluminescent properties of S-CQDs, S-CQDs were used as the emitting layer to fabricate CQD-LEDs consisting of a patterned ITO anode, a 40 nm-thick PEDOT:PSS hole injection layer, a 40 nm-thick TPBI electron transport layer, a 1 nm-thick LiF and 100 nm-thick Al cathode. Electrons are injected from the cathode into the ETL, holes are injected from ITO anode into the HIL and then the carriers travel towards the layer of S-CQDs. Finally, the carriers recombine in S-CQDs to emit photons.6 The energy level diagram of S-CQDs is shown in Fig. 5(a).
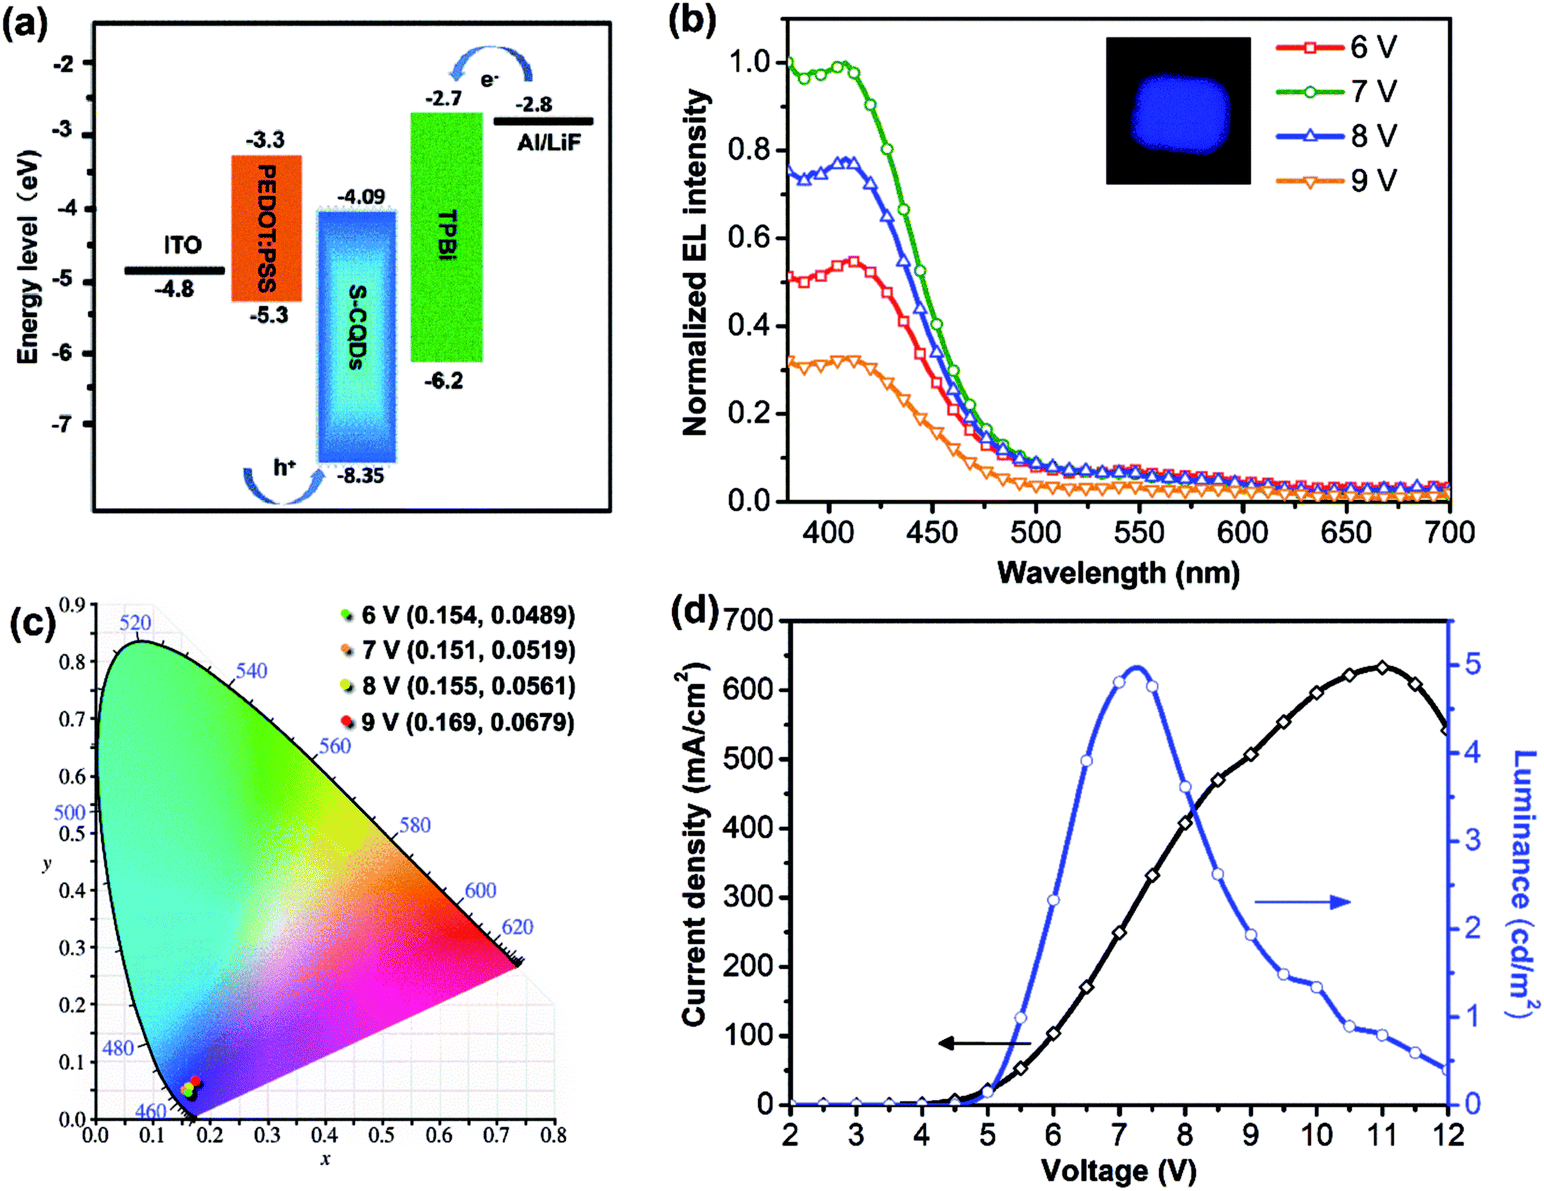 | ||
| Fig. 5 (a) The schematic energy level diagram of the CQD-LEDs. (b) Emission spectra of CQD-LEDs under different working voltage (inset is the photograph of CQD-LEDs under the working voltage of 7 V). (c) The CIE 1931 chromaticity coordinates of CQD-LEDs under different working voltage. (d) The current density curve and brightness–voltage characteristics of CQD-LEDs. | ||
The electroluminescence spectra of the device driven at forward voltage (6–9 V) are shown in Fig. 5(b). The EL peak is positioned without apparent variation and remains at around 410 nm. The CQD-LEDs emit bright blue light at 6–9 V. The EL peak intensity of these devices first increases, reaches maximum at voltage of 7 V over 6–9 V, and then decreases. More charges are injected into the S-CQDs with the increase of current density. The generation probability of photon is increased by more excitons generated from electrons and holes. Consequently, the EL intensity increases. Charge imbalance caused by excessive current may result in the decrease of EL intensity. In addition, as the injection current density is low at the driving voltage of 6–9 V, the carriers preferentially relax via the energy level associated with blue light emitting.25
Therefore, EL peak of the CQD-LEDs remains at the same blue light wavelength when the driving voltage is in the range of 6–9 V. As shown in Fig. 5(c), the corresponding CIE coordinates exhibit no obvious variation with the voltage changing from 6 to 9 V, which shows a relatively good optical stability at the applied voltages.
The current density dramatically increases with the change of driven voltage from 5.5–11 V and reaches the maximum value (630 mA cm−2) at 11 V (Fig. 5(d)). The turn-on voltage is about 5.5 V. The brightness increases greatly with the change of driven voltage from 5.5–7.26 V and the maximum luminance reaches 4.97 cd m−2. The performance of the CQD-LEDs such as the maximum luminance is still lower than that of QD-LEDs fabricated by semiconductor QDs.49 The maximum luminance of the device is also lower than that of blue emitting CQD-LEDs (maximum brightness is 24 cd m−2) based on long-chain passivated CQDs synthesized by thermally carbonizing citric acid in hot octadecene with 1-hexadecylamine as the passivation agent.25 The QY of long-chain passivated CQDs was determined to be ≈40% by using a spectrometer with an integrating sphere. There are two reasons that can be used to explain the phenomenon. First, the carrier transfer ability of S-CQDs is improved by the short-chain modification of ethylenediamine and the graphitic structure. But the lower QY of S-CQDs compared with that of long-chain passivated CQDs25 may weaken the optical performance of CQD-LEDs.24 Second, high-quality film can be formed by the S-CQDs from toluene solution. However, electrons are injected smoothly from the cathode and holes encounter barriers during the injection process because of the large energy barrier (3.05 eV) between the luminescent layer and HIL, which results in an unbalanced charge injection.7 Charge balance is an important factor for realizing high-performance CQD-LEDs.7 Hence, to improve the performance of CQD-LEDs, the QY of S-CQDs should be improved by further optimizing synthesis parameters and co-doping with nitrogen and sulfur, suitable device structure also should be chosen to reduce the potential barrier.
Conclusions
In conclusion, S-CQDs with graphitic structure were synthesized through a facile hydrothermal method using PA and EDA as the precursor and modifier, respectively. The obtained S-CQDs have an average diameter of 5.53 nm, exhibit excitation-dependent PL emission and possess QY of 29.3% in aqueous solutions. The structural analyses of the S-CQDs by FTIR and XPS demonstrate both PA and EDA have engaged in the establishment of S-CQDs. The S-CQDs have electron-accepting ability, as proved by electrochemical analysis. The CQD films were nearly uniform and flat when CQD-LEDs were fabricated by using S-CQDs as emitting layer. The device exhibits good optical stability under the voltage of 6–9 V, a turn-on voltage at about 5.5 V and a maximum luminance of 4.97 cd m−2. The reasons for the low brightness are speculated to be the relatively low QY of S-CQDs and the large energy barrier (3.05 eV) between the emitting layer and the HIL. The performance of the CQD-LEDs is anticipated to be further improved by choosing the S-CQDs with high QY and suitable device structure with low energy barrier.Acknowledgements
This work was supported by the Shanxi Provincial Key Innovative Research Team in Science and Technology (201605D131045-10) and Shanxi Provincial Key Research and Development Program (201603D111010), National Natural Science Foundation of China (U1610255, U1607120).Notes and references
- Q. Sun, Y. A. Wang, L. S. Li, D. Wang, T. Zhu, J. Xu, C. Yang and Y. Li, Nat. Photonics, 2007, 1, 717–722 CrossRef CAS.
- J. S. Steckel, P. Snee, S. Coe-Sullivan, J. P. Zimmer, J. E. Halpert, P. Anikeeva, L.-A. Kim, V. Bulovic and M. G. Bawendi, Angew. Chem., Int. Ed., 2006, 45, 5796–5799 CrossRef CAS PubMed.
- X. Michalet, F. F. Pinaud, L. A. Bentolila, J. M. Tsay, S. Doose, J. J. Li, G. Sundaresan, A. M. Wu, S. S. Gambhir and S. Weiss, Science, 2005, 307, 538–544 CrossRef CAS PubMed.
- M. A. Schreuder, K. Xiao, I. N. Ivanov, S. M. Weiss and S. J. Rosenthal, Nano Lett., 2010, 10, 573–576 CrossRef CAS PubMed.
- A. Rizzo, M. Mazzeo, M. Biasiucci, R. Cingolani and G. Gigli, Small, 2008, 4, 2143–2147 CrossRef CAS PubMed.
- P. O. Anikeeva, J. E. Halpert, M. G. Bawendi and V. Bulovic, Nano Lett., 2009, 9, 2532–2536 CrossRef CAS PubMed.
- T. Ding, X. Yang, L. Ke, Y. Liu, W.-Y. Tan, N. Wang, X.-H. Zhu and X. W. Sun, Org. Electron., 2016, 32, 89–93 CrossRef CAS.
- S. Coe, W.-K. Woo, M. Bawendi and V. Bulović, Nature, 2002, 420, 800–803 CrossRef CAS PubMed.
- Y. Shirasaki, G. J. Supran, M. G. Bawendi and V. Bulović, Nat. Photonics, 2013, 7, 13–23 CrossRef CAS.
- Q. Sun, Y. A. Wang, L. S. Li, D. Wang, T. Zhu, J. Xu, C. Yang and Y. Li, Nat. Photonics, 2007, 1, 717–722 CrossRef CAS.
- H. V. Demir, S. Nizamoglu, T. Erdem, E. Mutlugun, N. Gaponik and A. Eychmüller, Nano Today, 2011, 6, 632–647 CrossRef CAS.
- W.-S. Song, J.-H. Kim, J.-H. Lee, H.-S. Lee, Y. R. Do and H. Yang, J. Mater. Chem., 2012, 22, 21901–21908 RSC.
- W.-S. Song and H. Yang, Chem. Mater., 2012, 24, 1961–1967 CrossRef CAS.
- H.-M. Kim, J.-H. Youn, G.-J. Seo and J. Jang, J. Mater. Chem. C, 2013, 1, 1567–1573 RSC.
- F. Wang, Y.-H. Chen, C.-Y. Liu and D.-G. Ma, Chem. Commun., 2011, 47, 3502–3504 RSC.
- W. Chung, H. Jung, C. H. Lee, S. H. Park, J. Kim and S. H. Kim, J. Electrochem. Soc., 2011, 158, H1218–H1220 CrossRef CAS.
- W. Chung, H. Jung, C. H. Lee and S. H. Kim, Opt. Express, 2012, 20, 25071–25076 CrossRef CAS PubMed.
- Y.-P. Sun, B. Zhou, Y. Lin, W. Wang, K. S. Fernando, P. Pathak, M. J. Meziani, B. A. Harruff, X. Wang and H. Wang, J. Am. Chem. Soc., 2006, 128, 7756–7757 CrossRef CAS PubMed.
- S. Y. Lim, W. Shen and Z. Gao, Chem. Soc. Rev., 2015, 44, 362–381 RSC.
- Y.-H. Chan, J. Chen, Q. Liu, S. E. Wark, D. H. Son and J. D. Batteas, Anal. Chem., 2010, 82, 3671–3678 CrossRef CAS PubMed.
- X. Feng, F. Zhang, Y. Wang, Y. Zhang, Y. Yang and X. Liu, Appl. Phys. Lett., 2015, 107, 213102 CrossRef.
- F. Zhang, X. Feng, Y. Zhang, L. Yan, Y. Yang and X. Liu, Nanoscale, 2016, 8, 8618–8632 RSC.
- L. M. Veca, A. Diac, I. Mihalache, P. Wang, G. E. LeCroy, E. M. Pavelescu, R. Gavrila, E. Vasile, A. Terec and Y.-P. Sun, Chem. Phys. Lett., 2014, 613, 40–44 CrossRef CAS.
- S. Do, W. Kwon, Y. H. Kim, S. R. Kang, T. Lee, T. W. Lee and S. W. Rhee, Adv. Opt. Mater., 2016, 4, 276–284 CrossRef CAS.
- X. Zhang, Y. Zhang, Y. Wang, S. Kalytchuk, S. V. Kershaw, Y. Wang, P. Wang, T. Zhang, Y. Zhao and H. Zhang, ACS Nano, 2013, 7, 11234–11241 CrossRef CAS PubMed.
- L. Bakueva, S. Musikhin, M. Hines, T.-W. Chang, M. Tzolov, G. Scholes and E. Sargent, Appl. Phys. Lett., 2003, 82, 2895–2897 CrossRef CAS.
- S. Chaudhary, M. Ozkan and W. C. Chan, Appl. Phys. Lett., 2004, 84, 2925–2927 CrossRef CAS.
- S. Harvey, T. Mason, Y. Gassenbauer, R. Schafranek and A. Klein, J. Phys. D: Appl. Phys., 2006, 39, 3959 CrossRef CAS.
- W. F. Zhang, L. M. Jin, S. F. Yu, H. Zhu, S. S. Pan, Y. H. Zhao and H. Y. Yang, J. Mater. Chem. C, 2014, 2, 1525 RSC.
- Y. Wang, S. Kalytchuk, L. Wang, O. Zhovtiuk, K. Cepe, R. Zboril and A. L. Rogach, Chem. Commun., 2015, 51, 2950–2953 RSC.
- W. Lu, X. Gong, Z. Yang, Y. Zhang, Q. Hu, S. Shuang, C. Dong and M. M. F. Choi, RSC Adv., 2015, 5, 16972–16979 RSC.
- S. Hu, A. Trinchi, P. Atkin and I. Cole, Angew. Chem., Int. Ed., 2015, 54, 2970–2974 CrossRef CAS PubMed.
- Y. Zhang, Y. H. He, P. P. Cui, X. T. Feng, L. Chen, Y. Z. Yang and X. G. Liu, RSC Adv., 2015, 5, 40393–40401 RSC.
- S. Qu, X. Wang, Q. Lu, X. Liu and L. Wang, Angew. Chem., Int. Ed., 2012, 51, 12215–12218 CrossRef CAS PubMed.
- H. Li, X. He, Y. Liu, H. Huang, S. Lian, S.-T. Lee and Z. Kang, Carbon, 2011, 49, 605–609 CrossRef CAS.
- J. Shang, L. Ma, J. Li, W. Ai, T. Yu and G. G. Gurzadyan, Sci. Rep., 2012, 2, 792 Search PubMed.
- L. Tang, R. Ji, X. Cao, J. Lin, H. Jiang, X. Li, K. S. Teng, C. M. Luk, S. Zeng and J. Hao, ACS Nano, 2012, 6, 5102–5110 CrossRef CAS PubMed.
- Y. L. Wang, Y. Q. Zhao, Y. Zhang, F. Zhang, X. T. Feng, L. Chen, Y. Z. Yang and X. G. Liu, RSC Adv., 2016, 6, 38761–38768 RSC.
- Y. Dong, H. Pang, H. B. Yang, C. Guo, J. Shao, Y. Chi, C. M. Li and T. Yu, Angew. Chem., Int. Ed., 2013, 52, 7800–7804 CrossRef CAS PubMed.
- S. Zhu, Y. Song, X. Zhao, J. Shao, J. Zhang and B. Yang, Nano Res., 2015, 8, 355–381 CrossRef CAS.
- L. Bao, Z. L. Zhang, Z. Q. Tian, L. Zhang, C. Liu, Y. Lin, B. Qi and D. W. Pang, Adv. Mater., 2011, 23, 5801–5806 CrossRef CAS PubMed.
- X. Li, Y. Liu, X. Song, H. Wang, H. Gu and H. Zeng, Angew. Chem., Int. Ed., 2015, 54, 1759–1764 CrossRef CAS PubMed.
- V. Nguyen, J. Si, L. Yan and X. Hou, Carbon, 2015, 95, 659–663 CrossRef CAS.
- D. Qu, M. Zheng, L. Zhang, H. Zhao, Z. Xie, X. Jing, R. E. Haddad, H. Fan and Z. Sun, Sci. Rep., 2014, 4, 5294 CrossRef CAS PubMed.
- S. Zhu, Q. Meng, L. Wang, J. Zhang, Y. Song, H. Jin, K. Zhang, H. Sun, H. Wang and B. Yang, Angew. Chem., Int. Ed., 2013, 52, 3953–3957 CrossRef CAS PubMed.
- Y. Zhang, Y. Wang, X. Feng, F. Zhang, Y. Yang and X. Liu, Appl. Surf. Sci., 2016, 387, 1236–1246 CrossRef CAS.
- M. Xue, L. Zhang, M. Zou, C. Lan, Z. Zhan and S. Zhao, Sens. Actuators, B, 2015, 219, 50–56 CrossRef CAS.
- L. Yan, Y. Yang, C.-Q. Ma, X. Liu, H. Wang and B. Xu, Carbon, 2016, 109, 598–607 CrossRef CAS.
- H. Shen, W. Cao, N. T. Shewmon, C. Yang, L. S. Li and J. Xue, Nano Lett., 2015, 15, 1211–1216 CrossRef CAS PubMed.
| This journal is © The Royal Society of Chemistry 2017 |