 Open Access Article
Creative Commons Attribution 3.0 Unported Licence
Enhanced fluorescence properties of terbium complex/poly-L-lactic acid superfine fibers sensitized by the LSPR effect of silver nanoparticles†
Shipeng Wen a,
Guiming Zhanga,
Rong Zhanga,
Liqun Zhanga and
Li Liu*ab
aBeijing Engineering Research Centre of Advanced Elastomers, Beijing University of Chemical Technology, Beijing 100029, China. E-mail: liul@mail.buct.edu.cn
bState Key Laboratory of Chemical Resource Engineering, Beijing University of Chemical Technology, Beijing 100029, China
First published on 4th April 2017
Abstract
In this research, Ag-NPs/Tb-complex/PLLA composite fibers with diameters of around 250 nm were successfully obtained by the electrospinning and characterized by scanning electron microscope (SEM), transmission electron microscopy (TEM), X-ray photoelectron spectroscopy (XPS) and fluorescence spectra. The influence of localized surface plasmon resonance (LSPR) of silver nanoparticles (Ag-NPs) on the fluorescence of Tb(acac)3phen/poly-L-lactic acid (Tb-complex, acac = acetylacetone; phen = phenanthroline, PLLA = poly-L-lactic acid) fibers was mainly investigated. It is found that Tb-complex dispersed in the fibers in the form of nanoclusters. The local field surrounding of Tb3+ ions was affected by the neighboring Ag-NPs. As a result of the LSPR effect of Ag-NPs, the fluorescence intensity, quantum efficiency of Tb-complex in the composite fibers with the Ag/Tb ratio of 4![[thin space (1/6-em)]](https://www.rsc.org/images/entities/char_2009.gif) :
:![[thin space (1/6-em)]](https://www.rsc.org/images/entities/char_2009.gif) 1, were simultaneously improved compared with the composite fibers without Ag-NPs.
1, were simultaneously improved compared with the composite fibers without Ag-NPs.
Introduction
Fluorescence nanofibers have attracted growing interest because of the potential applications in biological fields such as skeletal muscle tissue engineering,1 bio-imaging,2 drug carriers,3 and fluorescent probes.4 Traditional fabrication methods of fluorescence fibers mainly include solution spinning and melting spinning. Nevertheless, both of them can barely obtain the fibers with diameters below 500 nm. In recent decades, electrospinning as a universal and effective method for fabricating uniform ultrafine fibers has exhibited many advantages, such as small diameters ranging from tens to hundreds of nanometers,5 high porosity, large specific surface area,6 large length to diameter ratios, and good uniformity.7 Also, electrospinning is a direct method of generating composite nanofibers containing luminescent agents with uniform dispersion.8 At present, many researchers have prepared fluorescence nanofibers via electrospinning. For instance, Zhang et al.9 prepared efficient luminescent Eu(TTA)3phen/polystyrene (TTA = 2-thenoyltrifluoroacetone, phen = 1,10-phenanthroline) nanofibers with diameters ranging from 350 to 700 nm by electrospinning. Huang et al.10 prepared Eu(DBM)3phen/polystyrene (DBM = dibenzoylmethane) fluorescence composite fibers with diameters of around 300 nm through electrospinning. The energy transfers from phen and DBM to Eu3+ ion were very efficient. The Eu3+ ions were located in a highly polarizable chemical environment, and this was beneficial to the fluorescence lifetime and internal quantum efficiency of the fibers. Gai et al.11 fabricated Fe3O4/PVP//Tb(BA)3phen/poly(vinyl pyrrolidone) (BA = benzoic acid) magnetic-photoluminescence bifunctional nanofibers by employing a parallel axial electrospinning setup. The average diameter of the individual fiber was around 200 nm. The nanofiber bundles exhibited strong green emissions under the excitation of 275 nm.It is known that the localized surface plasmon resonance (LSPR) effect is an optical phenomenon generated by collective oscillations of electron gas in metal nanostructures surrounded by a dielectric.12 As a typical material for plasmonic applications, silver displays sharp and intense LSPR bands.13 When the frequencies of incident light and the free electron collective oscillation are same, resonance can be produced.14 Adsorption of molecules on the metal surface lead to measurable spectral changes in both the wavelength and intensity of the LSPR.15,16
Surface plasmon resonance-enhanced fluorescence (SPREF) phenomenon of rare-earths/Ag hybrid can be generated when rare-earth particles are close to the Ag particles (Ag-NP) within a few nanometers.17–19 With the irradiation of visible light, the LSPR of Ag particles can be excited. The LSPR effect results in an enhanced electromagnetic radiation field and thus increases the emission intensity of rare-earth particles in the vicinity of the Ag particles.20,21 Previous research has confirmed that Ag-NP acts as an effective enhancement agent.22,23 Lin et al.24 prepared Pb/Cd-free oxyfluoride glasses, and then introduced molecular-like (ML) Ag clusters with 1–4 nm into the glasses. The results demonstrated that the energy transfer from ML-Ag clusters to Tb3+ and Yb3+ led to the enhancement of near infrared (NIR) emission intensity of Yb3+ ions. Hayakawa et al.25 prepared SiO2 glass containing Ag+ and Eu3+ ions by annealing the glass in a reducing atmosphere. The results showed that an induced surface plasma oscillation by incidence and an interaction between Eu3+ and Ag particles occurs simultaneously. The fluorescence of Eu3+ was enhanced in the presence of silver particles with the size of 4.3 nm. Zhang et al.26 prepared an Ag co-doped SiO2 (SiO2:Tb3+–Ag) nanostructured luminescent composite using a modified Stöber method. The results showed that Ag nanoparticles greatly enhanced the light absorption at 226 nm and the light emission at 543 nm of the composite, and the fluorescence lifetime reduced with the increase of Ag concentration in SiO2:Tb3+–Ag composite.
In this research, the main objective is to prepare superfine fibers with strong fluorescence properties in the presence of Ag nanoparticles. Hence, terbium complex Tb(acac)3phen (Tb-complex) emitting a strong green light, and Ag-NPs were introduced into poly-L-lactic acid (PLLA) matrix. Finally, the PLLA superfine fibers containing Ag-NPs and Tb-complex were prepared by electrospinning. The diameter of the composite fibers was around 250 nm. Tb-complex had a fine dispersion in the PLLA fibers. The fluorescence intensity of fibers at 539 nm was greatly enhanced by Ag-NPs when the mole ratio of Ag and Tb-complex was 4![[thin space (1/6-em)]](https://www.rsc.org/images/entities/char_2009.gif) :
:![[thin space (1/6-em)]](https://www.rsc.org/images/entities/char_2009.gif) 1. The composite fibers displayed higher quantum efficiency and longer fluorescence lifetime than the composite fibers without Ag-NPs.
1. The composite fibers displayed higher quantum efficiency and longer fluorescence lifetime than the composite fibers without Ag-NPs.
Experimental
Materials
Terbium oxide (Tb4O7, purity 99.9%) was purchased from Grirem Advanced Materials Co., Ltd (Beijing, China). Silver nanoparticles (Ag-NPs) and polyvinylpyrrolidone (PVP, Mw = 1300![[thin space (1/6-em)]](https://www.rsc.org/images/entities/char_2009.gif) 000) were purchased from Sigma-Aldrich Trading Co., Ltd (Shanghai, China). Poly-L-lactic acid (PLLA, Mw = 70
000) were purchased from Sigma-Aldrich Trading Co., Ltd (Shanghai, China). Poly-L-lactic acid (PLLA, Mw = 70![[thin space (1/6-em)]](https://www.rsc.org/images/entities/char_2009.gif) 000) was obtained from Guanghua Weiye industrial Co., Ltd (Shenzhen, China). Acetylacetone (acac), phenanthroline (phen), dichloromethane (DCM), N,N-dimethyl formamide (DMF), nitric acid (HNO3), and anhydrous ethanol (C2H5OH) are all commercial reagents.
000) was obtained from Guanghua Weiye industrial Co., Ltd (Shenzhen, China). Acetylacetone (acac), phenanthroline (phen), dichloromethane (DCM), N,N-dimethyl formamide (DMF), nitric acid (HNO3), and anhydrous ethanol (C2H5OH) are all commercial reagents.
Synthesis of Tb(acac)3phen (Tb-complex)
Tb(NO)3 was obtained through the reaction of Tb4O7 and HNO3. 0.1 mol of Tb(NO)3 was dissolved in C2H5OH. The Tb(NO)3 solution was magnetically stirred until the Tb(NO)3 was dissolved completely. Then, 0.3 mol of acac was first dissolved in C2H5OH and this mixture was then added into the Tb(NO)3 solution. After 1 hour, 0.1 mol of phen was dissolved in C2H5OH. The phen solution was then added to the Tb(NO)3 solution. 3 hours later, white precipitates gradually appeared. Finally, the precipitate was dried at 60 °C. The production efficiency was 53%. The IR spectra of acac, phen and Tb-complex are shown in ESI (Fig. S1†). The characteristic peaks of C![[double bond, length as m-dash]](https://www.rsc.org/images/entities/char_e001.gif) O and C–N shift to the new position after the reaction, indicating that Tb3+ ions have coordination reactions with the C
O and C–N shift to the new position after the reaction, indicating that Tb3+ ions have coordination reactions with the C![[double bond, length as m-dash]](https://www.rsc.org/images/entities/char_e001.gif) O of acac and two nitrogen atoms of phen.
O of acac and two nitrogen atoms of phen.
Preparation of Ag-NPs/Tb-complex/PLLA fibers
PLLA was dissolved in DCM, and the resulting solution was magnetically stirred for 12 hours to form solution (I). Tb-complex was dissolved in DMF, and the resulting solution was magnetically stirred for 15 minutes to form solution (II). A certain amount of Ag-NPs and PVP were added to DMF to form solution (III) that was treated under ultrasonic waves for 1 hour. Finally, the solutions of (I), (II) and (III) were mixed together and magnetically stirred for 1 hour. In the mixture solution, the PLLA content was 8 wt% and the Tb-complex content was 5 wt%. The mixture solution was then transferred into an injection syringe and ready to be electrospun into fibers. The parameters of the electrospinning process are listed as follows: the feeding rate was 1.0 ml h−1; the distance from needle to collector was 15 cm; the voltage was 15 kV; the speed of collecting drum was 300–400 rpm. The electrospinning was carried out for 2.5 hours in order to achieve a fiber membrane. Finally, a series of fibers with Ag-NPs/Tb-complex mole ratios of 0, 1, 2, 3, 4, 5, 8 and 10, were prepared separately.Characterizations
The morphology of fibers was observed by a scanning electron microscope (SEM, S-4800); prior to observation, gold processing for the samples was received and the voltage was set at 1 kV. A transmission electron microscope (TEM, Tecnai G2 F30 S-TWIN) and an energy dispersive X-ray spectroscope (EDS) were used to observe dispersion of Tb-complex and Ag particles in the fibers. An X-ray photoelectron spectrometer (XPS, Escalab 250) was used to detect the contents of Ag and Tb in different areas of the fibers. Excitation and emission spectra of the fibers were obtained from a fluorescence spectrophotometer (F-4500, Hitachi). The scanning speed, sweep voltage and slit width were set at 1200 nm min−1, 400 V and 2.5 nm, respectively. Fluorescence quantum efficiency was obtained from a fluorescence spectrophotometer (F-4700, Hitachi). An integrating sphere method was used to gain the latter's absolute rate. Wavelengths of excitation and emission of Tb-complex and fibers were set at 294 nm and 539 nm, respectively. Neutral Al2O3 powders and empty fiber were used as the reference samples for the Tb-complex and fibers, respectively. Fluorescence lifetime was obtained by use of a steady-state and time-resolved fluorescence spectrometer (FLS920, Edinburgh Instruments). The excitation wavelength was set at 294 nm.Results and discussion
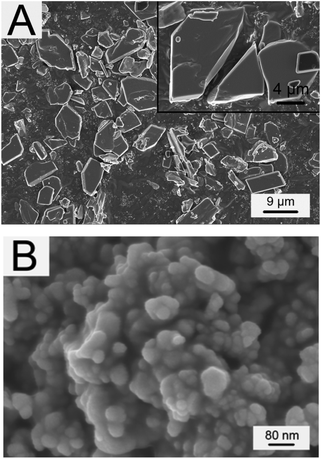
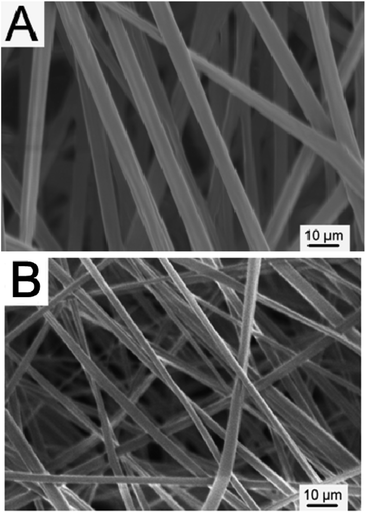
Original morphologies of Tb-complex particles are shown in Fig. 1A. From the inset, it can be seen that Tb-complex particles have a sheet shape. The size of most Tb-complex particles is in the range of 4–6 μm. Fig. 1B shows that Ag-NPs have a spherical shape with diameters of around 30 nm, and are easily aggregated into a particle of larger dimension (Fig. 1B). Hence, PVP as dispersion agent was added into the Ag electrospun solution before electrospinning to ensure Ag-NPs were well dispersed in the solution.Fig. 2 shows the morphologies of Tb-complex/PLLA and Ag-NPs/Tb-complex/PLLA fibers. Tb-complex/PLLA fibers have the diameters of about 400 nm and smooth surfaces (Fig. 2A). After Ag-NPs were added into the Tb-complex/PLLA fibers, the diameter of the fibers further decreased to about 250 nm (Fig. 2B). The reason for this decrease in fiber diameter is attributed to the higher charge density on the surface of ejected jet after the addition of Ag-NPs. The increased charge density further results in high elongation forces imposed to the jet under the electrical field. It is known that the overall tension in the electrospun fibers depends on the self-repulsion of the excess charges on the jet. Therefore, the increased charge density of fibers after the addition of Ag-NPs leads to thinner diameter of the fibers.27–29
TEM and EDS were further employed to observe the dispersion of Ag-NPs and Tb-complex particles in the fibers. Fig. 3A shows a TEM image of Tb-complex/PLLA fibers. Only some very tiny black dots of Tb-complex particles with the size under 5 nm can be observed in the interior of the fiber. EDS was used to detect Tb contents in different areas. The results show that the contents of Tb in area 1 and 2 are 4.23 and 4.76 wt%, respectively. Compared with the large sheet shape of original Tb-complex particles illustrated in Fig. 1A, the decrease in the size of Tb-complex particles in the fibers can be attributed to particular features of electrospinning process. Before the electrospinning process, Tb-complex was first dissolved in the electrospun solutions and existed in the form of single molecule. During the electrospinning process, solvents in the electrospun solution evaporated quickly and the Tb-complex molecules did not have enough time to aggregate into big particles. As a result, most Tb-complex molecules may gather into some nanoclusters in the fibers. Fig. 3B shows the dispersion of Ag-NPs and Tb-complex in the fibers. Ag-NPs of different diameters are incorporated in the fibers such as in the range of 50–80 nm instead of original 30 nm. That is because Ag-NPs are incompatible with PVP molecules, resulting in a certain degree of phase separation between them. Although ultrasonic treatment of Ag solution was employed before electrospinning, Ag-NPs still tended to form aggregates in the composite fibers. EDS detection was further used in a rich Ag-NP area and a blank area. The results show that the contents of Tb3+ ions in area 3 and 4 are 3.02 and 2.58 wt%, respectively. This indicates that the addition of Ag-NPs do not affect the dispersion of Tb-complex in the fibers.
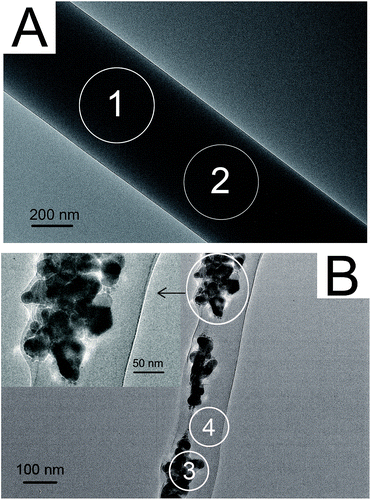 | ||
Fig. 3 TEM images of (A) Tb-complex/PLLA fibers containing 5 wt% Tb-complex and (B) Ag-NPs/Tb-complex/PLLA fibers (Ag![[thin space (1/6-em)]](https://www.rsc.org/images/entities/char_2009.gif) : :![[thin space (1/6-em)]](https://www.rsc.org/images/entities/char_2009.gif) Tb = 4 Tb = 4![[thin space (1/6-em)]](https://www.rsc.org/images/entities/char_2009.gif) : :![[thin space (1/6-em)]](https://www.rsc.org/images/entities/char_2009.gif) 1). 1). | ||
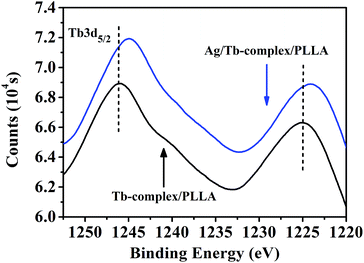
XPS was used to investigate the influence of Ag-NPs on the local field surrounding of Tb3+ ions in the fibers. The element scans of XPS show that the contents of Tb3+ ions in the PLLA and Ag-NPs/Tb-complex/PLLA (Ag/Tb = 4![[thin space (1/6-em)]](https://www.rsc.org/images/entities/char_2009.gif) :
:![[thin space (1/6-em)]](https://www.rsc.org/images/entities/char_2009.gif) 1) fibers are 3.20 and 3.32 wt%, respectively. These results are consistent with those from TEM-EDS tests. In the XPS spectra (Fig. 4.) for Tb-complex/PLLA fibers, both peaks appear at 1245.9 and 1225.1 eV attributed to 3d5/2 of Tb3+ ions. However, the two peaks in the XPS spectra for Ag-NPs/Tb-complex/PLLA fibers shift to a lower binding energy. This change indicates that Ag-NPs have changed the local field surrounding of Tb3+ ions in the fibers.
1) fibers are 3.20 and 3.32 wt%, respectively. These results are consistent with those from TEM-EDS tests. In the XPS spectra (Fig. 4.) for Tb-complex/PLLA fibers, both peaks appear at 1245.9 and 1225.1 eV attributed to 3d5/2 of Tb3+ ions. However, the two peaks in the XPS spectra for Ag-NPs/Tb-complex/PLLA fibers shift to a lower binding energy. This change indicates that Ag-NPs have changed the local field surrounding of Tb3+ ions in the fibers.
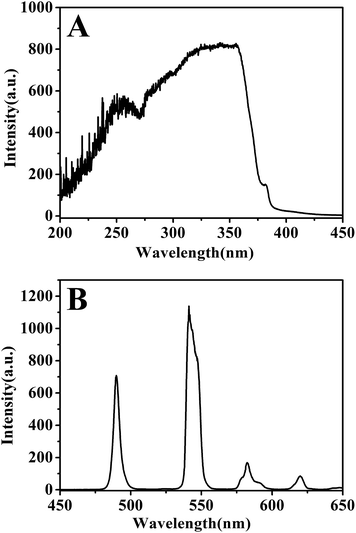
Fig. 5 shows the excitation and emission spectra of Tb-complex. The excitation spectrum (Fig. 5A) exhibits a platform, revealing that the Tb-complex can be excited by a wide-range light ranging from 325–360 nm. The broad platform is mainly attributed to the wide absorption of organic ligands acac and phen. In the emission spectrum (Fig. 5B), there are four characteristic peaks corresponding to the 5D4–7F6 (490 nm), 5D4–7F5 (541 nm), 5D4–7F4 (582 nm), 5D4–7F3 (620 nm).30 Among these peaks, the peak attributed to maximum emission intensity appears at 541 nm. Good fluorescence performance is attributed to the high efficient energy transfer from the ligands acac and phen to Tb3+ ions.
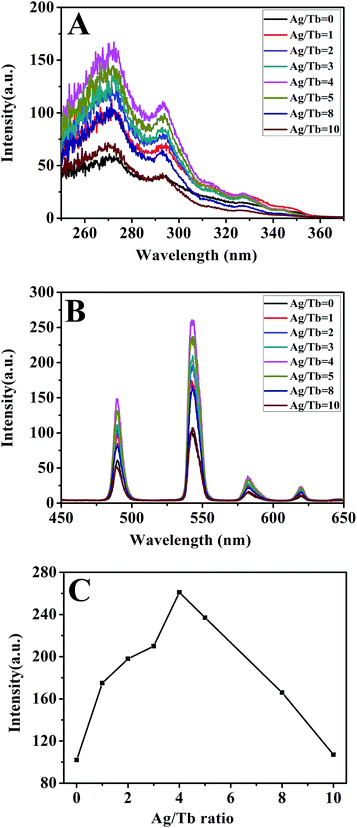
Fig. 6 shows the excitation and emission spectra of Ag-NPs/Tb-complex/PLLA fibers. It is noted that the broad peaks of Tb-complex in Fig. 5A have blue-shifted, and have been split into two peaks in composite fibers (Fig. 6A). This phenomenon indicates the local field surrounding around Tb3+ ions has changed in the fibers compared with that in Tb-complex powders. In the emission spectra (Fig. 6B), all samples show the same fluorescence peaks with Tb-complex illustrated in Fig. 5B. The strongest peak still appears around 541 nm. The fluorescence intensity of fibers is much lower than that of Tb-complex powders. The main reasons for the decreased fluorescence intensity are the low concentration of Tb3+ in the fibers and the poor absorption and transfer efficiency of the PLLA matrix. It should be noted that the fluorescence intensity of Ag-NPs/Tb-complex/PLLA fibers is stronger than that of Tb-complex/PLLA fibers. As the content of Ag-NPs in the fibers increases (Fig. 6C), the fluorescence intensity of the composite fibers also increases and reaches the highest value when the mole ratio of Ag and Tb is 4![[thin space (1/6-em)]](https://www.rsc.org/images/entities/char_2009.gif) :
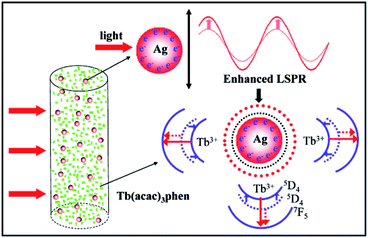
:![[thin space (1/6-em)]](https://www.rsc.org/images/entities/char_2009.gif) 1. After reaching peak intensity, the fluorescence intensity begins to decrease. This result confirms that Ag-NPs can enhance the fluorescence intensities of the Tb-complex/PLLA fibers. This positive effect is mainly attributed to LSPR of Ag-NPs. The LSPR effect on fluorescence property of fibers is illustrated in Fig. 7.
1. After reaching peak intensity, the fluorescence intensity begins to decrease. This result confirms that Ag-NPs can enhance the fluorescence intensities of the Tb-complex/PLLA fibers. This positive effect is mainly attributed to LSPR of Ag-NPs. The LSPR effect on fluorescence property of fibers is illustrated in Fig. 7.
The intensity of LSPR can affect the fluorescence intensities of nearby rare earth ions.23 A high degree of the space locality of the LSPR of Ag-NPs leads to more significant enhancement on the surrounding local electromagnetic field close to Ag-NPs.31,32 The enhanced local electromagnetic field further leads to plasmonic interaction and also strongly affects the kinetic characteristics of nearby Tb-complex.33 Furthermore, the radiative decay rates of the Tb3+ are also enhanced.34 Meanwhile, the local field surrounding of Tb3+ ions is influenced. This has earlier been confirmed by the XPS analysis in Fig. 4. The change of local field surrounding further affects energy transfer between the ligands and Tb3+ ions and the resulting fluorescence intensity. As a result, the fluorescence intensity of fibers is greatly enhanced by Ag-NPs when the mole ratio of Ag/Tb is 4![[thin space (1/6-em)]](https://www.rsc.org/images/entities/char_2009.gif) :
:![[thin space (1/6-em)]](https://www.rsc.org/images/entities/char_2009.gif) 1. However, when the Ag/Tb mole ratio further increases to 8
1. However, when the Ag/Tb mole ratio further increases to 8![[thin space (1/6-em)]](https://www.rsc.org/images/entities/char_2009.gif) :
:![[thin space (1/6-em)]](https://www.rsc.org/images/entities/char_2009.gif) 1, the intensity of the fibers decreases. The decrease in fluorescence intensity at a high concentration of Ag-NPs is attributed to the close distance between Ag-NPs and Tb-complex, and the resulting fluorescence quenching of Tb3+ ions.22
1, the intensity of the fibers decreases. The decrease in fluorescence intensity at a high concentration of Ag-NPs is attributed to the close distance between Ag-NPs and Tb-complex, and the resulting fluorescence quenching of Tb3+ ions.22
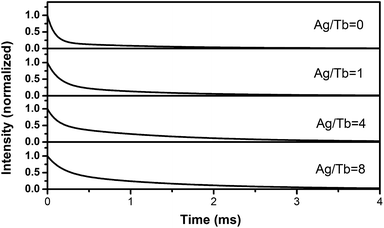
Fluorescence quantum efficiency represents the ability of fluorescence materials transforming the absorbing light energy into fluorescence. Table 1 illustrates that Ag-NPs/Tb-complex/PLLA fibers have higher quantum efficiency than the fibers without Ag-NPs when the Ag/Tb ratio is below 4. This increase in quantum efficiency is also caused by the LSPR effect of Ag-NPs. When the Ag/Tb ratio increases to 8, the quantum efficiency of Ag-NPs/Tb-complex/PLLA fibers is lower than the fibers without Ag-NPs, and this is attributed to the fluorescence quenching by the excess Ag-NPs.
| Samples | 1# Ag/Tb = 0 | 2# Ag/Tb = 1 | 3# Ag/Tb = 4 | 4# Ag/Tb = 8 |
|---|---|---|---|---|
| η (%) | 12.1 | 15.3 | 21.5 | 9.6 |
| τ (μs) | 1744 | 4063 | 9098 | 8252 |
Fig. 8 shows the curve of the fluorescence decay for Ag-NPs/Tb-complex/PLLA fibers. All of these curves could be well-fitted with the equation:
I = A + B![[thin space (1/6-em)]](https://www.rsc.org/images/entities/char_2009.gif) exp(−t/τ) exp(−t/τ) |
Conclusions
This work mainly prepared Ag-NPs/Tb-complex/PLLA fibers by electrospinning, and researched the enhanced fluorescence properties of the composite fibers. The results showed that the fibers had smooth surfaces and diameters of around 250 nm. The Tb-complex dispersed uniformly in the PLLA fibers. With the addition of Ag-NPs, the local field surrounding environment of Tb3+ in the fibers was altered. Also, the LSPR effect of Ag-NPs influenced the energy transfer of Tb-complex, leading to an increase in fluorescence intensity of Ag-NPs/Tb-complex/PLLA fibers. Meanwhile, the addition of Ag-NPs improved quantum efficiency and extended fluorescence lifetime of Tb3+ in the composite fibers at the same time when the ratio of Ag/Tb was below 4.Acknowledgements
The research was supported by the National Basic Research Program of China (2015CB654700 (2015CB674705)), the National Natural Science Foundation of China (51573007), the Fundamental Research Funds for the Central Universities in China (JD1513 and ZD1503).Notes and references
- M. C. Chen, Y. C. Sun and Y. H. Chen, Acta Biomater., 2013, 9, 5562–5572 CrossRef CAS PubMed.
- W. Liu, J. Wei, Y. Chen, P. Huo and Y. Wei, ACS Appl. Mater. Interfaces, 2013, 5, 680–685 CAS.
- Z. Hou, G. Li, H. Lian and J. Lin, J. Mater. Chem., 2012, 22, 5254 RSC.
- S. N. Raja, A. C. Olson, K. Thorkelsson, A. J. Luong, L. Hsueh, G. Chang, B. Gludovatz, L. Lin, T. Xu, R. O. Ritchie and A. P. Alivisatos, Nano Lett., 2013, 13, 3915–3922 CrossRef CAS PubMed.
- X. P. Zhang, S. P. Wen, S. Hu, Q. Chen, H. Fong, L. Q. Zhang and L. Liu, J. Phys. Chem. C, 2010, 114, 3898–3903 CAS.
- Y. Lv, J. Wu, L. Wan and Z. Xu, J. Phys. Chem. C, 2008, 112, 10609–10615 CAS.
- B. Sun, Y. Z. Long, Z. J. Chen, S. L. Liu, H. D. Zhang, J. C. Zhang and W. P. Han, J. Mater. Chem. C, 2014, 2, 1209–1219 RSC.
- S. Wen, X. Zhang, L. Yao, M. Xi, L. Zhang, H. Fong and L. Liu, J. Phys. Chem. C, 2013, 1, 1613 CAS.
- X. Zhang, S. Wen, S. Hu, L. Zhang and L. Liu, J. Rare Earths, 2010, 28, 333–339 CrossRef CAS.
- L. Huang, L. Cheng, H. Yu, J. Zhang, L. Zhou, J. Sun, H. Zhong, X. Li, Y. Tian, Y. Zheng, T. Yu, C. Li, H. Zhong, W. Liu, L. Zhang, J. Wang and B. Chen, Opt. Commun., 2012, 285, 1476–1480 CrossRef CAS.
- G. Gai, L. Wang, X. Dong and S. Xu, J. Mater. Sci., 2013, 48, 5140–5147 CrossRef CAS.
- C. F. Bohren and D. R. Huffman, Absorption and Scattering of Light by Small Particles, Wiley Interscience, 1983, vol. 98, pp. 290–291 Search PubMed.
- B. Sepúlveda, P. C. Angelomé, L. M. Lechuga and L. M. Liz-Marzán, Nano Today, 2009, 4, 244–251 CrossRef.
- X. Liao, Y. Chen, M. Qin, Y. Chen, L. Yang, H. Zhang and Y. Tian, Talanta, 2013, 117, 203–208 CrossRef CAS PubMed.
- J. N. Anker, W. P. Hall, O. Lyandres, N. C. Shah, J. Zhao and R. P. V. Duyne, Nat. Mater., 2008, 7, 442–453 CrossRef CAS PubMed.
- R. Abargues, P. J. Rodriguez-Canto, S. Albert, I. Suarez and J. P. Martínez-Pastor, J. Mater. Chem. C, 2014, 2, 908–915 RSC.
- O. L. Malta and M. A. Couto dos Santos, Chem. Phys. Lett., 1990, 174, 13–18 CrossRef CAS.
- R. Reisfeld, T. Saraidarov, G. Panzer, V. Levchenko and M. Gaft, Opt. Mater., 2011, 34, 351–354 CrossRef CAS.
- M. Eichelbaum and K. Rademann, Adv. Funct. Mater., 2009, 19, 2045–2052 CrossRef CAS.
- G. P. Acuna, F. M. Moller, P. Holzmeister, S. Beater, B. Lalkens and P. Tinnefeld, Science, 2012, 338, 506–510 CrossRef CAS PubMed.
- H. S. Wang, F. N. Xiao, Z. Q. Li, J. Ouyang, Z. Q. Wu, X. H. Xia and G. J. Zhou, Lab Chip, 2014, 14, 1123–1128 RSC.
- H. S. Wang, C. Wang, Y. K. He, F. N. Xiao, W. J. Bao, X. H. Xia and G. J. Zhou, Anal. Chem., 2014, 86, 3013–3019 CrossRef CAS PubMed.
- H. Li, M. Wang, W. Qiang, H. Hu, W. Li and D. Xu, Analyst, 2014, 139, 1653–1660 RSC.
- H. Lin, D. Chen, Y. Yu, R. Zhang and Y. Wang, Appl. Phys. Lett., 2013, 103, 091902 CrossRef.
- T. Hayakawa, S. T. Selvan and M. Nogami, J. Non-Cryst. Solids, 1999, 259, 16–22 CrossRef CAS.
- D. Zhang, X. Hu, R. Ji, S. Zhan, J. Gao, Z. Yan, E. Liu, J. Fan and X. Hou, J. Non-Cryst. Solids, 2012, 358, 2788–2792 CrossRef CAS.
- X. Zong, K. Kim, D. Fang, S. Ran, H. S. Benjamin and C. Benjamin, Polymer, 2002, 43, 4403–4412 CrossRef CAS.
- W. K. Son, J. H. Youk, T. S. Lee and W. H. Park, Polymer, 2004, 45, 2959–2966 CrossRef CAS.
- J. Bai, Y. Li, S. Yang, J. Du, S. Wang, J. Zheng, Y. Wang, Q. Yang, X. Chen and X. Jing, Solid State Commun., 2007, 141, 292–295 CrossRef CAS.
- Y. S. Kawashima, C. F. Gugliotti, M. Yee, S. H. Tatumi and J. C. R. Mittani, Radiat. Phys. Chem., 2014, 95, 91–93 CrossRef CAS.
- N. Calander and M. Willander, J. Appl. Phys., 2002, 92, 4878–4884 CrossRef CAS.
- P. Muhlschlegel, H. J. Eisler, O. J. Martin, B. Hecht and D. W. Pohl, Science, 2005, 308, 1607–1609 CrossRef CAS PubMed.
- C. Mihalcea, D. Büchel, N. Atoda and J. Tominaga, J. Am. Chem. Soc., 2001, 123, 7172–7173 CrossRef CAS PubMed.
- W. Ji, P. Jing and J. Zhao, J. Mater. Chem. C, 2013, 1, 470–476 RSC.
- A. K. Bansal, A. Ruseckas, P. E. Shaw and I. D. W. Samuel, J. Phys. Chem. C, 2010, 114, 17864–17867 CAS.
Footnote |
| † Electronic supplementary information (ESI) available. See DOI: 10.1039/c7ra02401k |
| This journal is © The Royal Society of Chemistry 2017 |

