
 Open Access Article
 This Open Access Article is licensed under a
 Creative Commons Attribution 3.0 Unported Licence
Effects of the surface chemistry and structure of carbon nanotubes on the coating of glucose oxidase and electrochemical biosensors performance†
Carolina González-Gaitán ,
Ramiro Ruiz-Rosas,
Emilia Morallón* and
Diego Cazorla-Amorós
,
Ramiro Ruiz-Rosas,
Emilia Morallón* and
Diego Cazorla-Amorós
Materials Institute of Alicante (IUMA), University of Alicante, Ap. 99, 03080, Alicante, Spain. E-mail: morallon@ua.es
First published on 19th May 2017
Abstract
Glucose oxidase (GOx) has been immobilized on multiwall and herringbone carbon nanotubes (NTs) for glucose biosensing. Emphasis has been pointed in the effect of the structure and surface chemistry in the biosensor performance. Functionalization with carboxylic moieties renders a better performance than amino groups, and it also improves the performance with respect to that of bare NTs. No relationship was found between sensitivity to glucose and the amount of charge coming from the direct electron transfer between NTs and the flavin adenine dinucleotide (FAD) group of GOx. Based on these results, oxidized herringbones and multiwall NTs were used to prepare electrochemical sensors with different GOx loadings that were tested at positive and negative potentials. At positive potentials, the sensing mechanism is based on the oxidation of H2O2, and differences in sensitivity are related to the amount of active enzyme loaded on the carbon nanotubes surface. This amount seems to be enhanced by the presence of carboxylic moieties on oxidized NTs, as well as by the homogeneous surface structure and higher surface area of multiwall NTs. In this sense, the homogeneous structure of multiwall NTs seems to be more important than their larger surface area. At negative potentials, the detection mechanism is driven by oxygen consumption during the glucose oxidation. Thanks to the aforementioned reasons, multiwall NTs provide a similar sensibility and working range as herringbone NTs while using half the amount of GOx. These results point out the huge impact of NTs structure and surface chemistry upon the activity of GOx for electrochemical sensors.
1. Introduction
Research on glucose detection has been in the spotlight for many years because of its implications in diseases such as diabetes and hypoglycemia.1 They are caused by metabolic disorders in which the body does not produce the necessary amount of insulin for glucose processing, leading to glucose levels out of the normal concentration range in blood (4.0 to 5.9 mM).1,2 In this sense, the concept of enzyme electrodes proposed by Clark and Lyons in 19621,3 constituted a major breakthrough for glucose sensors. As a result, biosensors based on glucose oxidase enzyme (GOx) are the most used technology to achieve accurate, non-invasive and even continuous monitoring of sugar levels.4 The use of this specific enzyme leads to an increase in the selectivity and the sensitivity of the sensor, minimizing the possible interferences with other analytes present in biological fluids.5Glucose oxidase is a flavin protein that catalyzes the oxidation of β-D-glucose at its hydroxyl group which, through the participation of O2 as an electron acceptor, produces D-glucono-δ-lactone and hydrogen peroxide:6
 | (1) |
The cofactor flavin adenine dinucleotide (FAD) is the active site where the oxidation reaction of glucose takes place. The FAD contains amine groups involved in the glucose oxidation catalysis.6,7
Different generations of glucose biosensors that are characterized by different detection mechanisms have been developed.1,2 First-generation biosensors are based in the detection of the H2O2 produced during the reaction; however, interference problems arise from using positive working potentials, where the competitive oxidation on the electrode of other analytes is frequently found in biological samples. One, if not the most, limiting factor in the glucose biosensors is the electron transfer between the FAD and the electrode surface. This problem is due to the size of the GOx molecule and the thick protein layers covering the FAD redox center, preventing the direct electron transfer (DET).5,8,9 For that reason, the introduction of a mediator (second generation biosensors) has emerged as a good solution that eases achieving an increased response in this type of biosensors, which can work using lower working potential, thus minimizing the interference problems.10 Finally, in the case of the third generation biosensors, efforts are focused on the elimination of the mediator and the development of a biosensor that can work at low potentials, close to that of the redox potential of the enzyme.2 In this type of sensors a DET between the glucose and the electrode through the FAD group is proposed for improving their sensitivity.8,9,11–13 Sensors of this generation are still under development and novel protocols and materials are currently being studied, where nanostructured carbon materials are playing a leading role.2,14
Nanostructured carbon materials have been extensively studied in the last years for sensing application.1,15–18 Thus, carbon nanotubes (NTs) show outstanding properties such as high electrical conductivity, high surface area, high mechanical resistance and a modifiable surface chemistry using well-known chemical and electrochemical methods.19–23 They promote the electron transfer reactions between the biomolecule and the analyte, which results in an increase of the selective recognition, and in an enhancement of the detection limit.17,24 In order to achieve a successful enzyme immobilization, not only the amount, but also the activity of the immobilized biomolecule must be ensured.25 In the case of glucose sensors, a large number of procedures have been reported to enhance the immobilization of GOx onto carbon nanotube electrodes,15 and can be grouped in two main approaches, namely, (i) covalent binding in functionalized NTs, where GOx is directly attached to functional groups previously introduced in NTs.5,26 Metal nanoparticles that participates in the sensing mechanism can be also added for this purpose.15,27 These methods are considered to be the most effective for enzyme immobilization; (ii) immobilization of GOx within a composite matrix, usually composed by polymers. Immobilization can take place by cross-linking of GOx using glutaraldehyde (GA) or other compounds with functional groups that can be bound on the amino functions of the enzyme, attaching them together and also acting as spacers.28 It can be also achieved using membranes of polymers permeable to glucose, such as Nafion®,29,30 chitosan31 and Teflon.32 This approach has been reported to avoid enzyme denaturalization in a larger degree than covalent binding.33
Surface chemistry of NTs plays a mandatory role in enzyme immobilization. For instance, oxygen and nitrogen functionalities can be introduced in carbon materials. The acidic oxygen groups can interact with the amine groups of the protein chains from the enzyme, allowing a strong interaction by the formation of amide bridges.5,34–36 They also reduce the degree of entanglement of the NTs thanks to the improved dispersability in water, bringing more surface area available for attaching enzymes.26 The inclusion of nitrogen has also been proposed for this use.9,37 The structure of NTs is also known to affect the stability and the conformation of the enzyme.35,38,39 When the size and geometry of NTs is in consonance with that of GOx, it can unfold to some extent, producing conformational changes that leads the protein to match the geometry of the NTs.39 Moreover, it is proposed that different structural changes are induced in GOx by the distinctive structure on tips and sidewall surfaces of NTs.38 However, to our knowledge, there is a lack of information regarding the effect of the structure of NTs, which can be strikingly different depending on the method employed in their synthesis.
This work presents the preparation of electrochemical biosensors using nanostructured carbon materials with different structure and surface chemistry, and their performance as glucose biosensors in different electrochemical conditions. For this purpose, GOx has been immobilized on NTs with different structure – multiwall and herringbone structures. Oxygen functionalization of these NTs has been achieved using a chemical oxidation method, while the introduction of 4-aminobenzoic acid (4-ABA) derived functionalities on herringbone carbon nanotubes has been performed by electrochemical treatment. It is demonstrated that the electrochemical response and the sensor performance is greatly affected by the structure and the surface chemistry of the carbon support. Attention has been paid to the relationship between the electrochemical activity of GOx (that is, the charge manifested from the DET between NTs and the FAD/FADH2 redox pair) and the performance of the biosensor for glucose detection, which has been assessed at positive and negative potentials, corresponding to those used in first and third sensors generation.
2. Materials and methods
2.1. Materials
Two different carbon nanotubes, multiwall carbon nanotubes (t-NT) and herringbone carbon nanotubes (h-NT) have been used as substrates/transducers along this work. Multiwall carbon nanotubes with a 95% of purity were used without further purification. Herringbone carbon nanotubes were thoroughly washed in 3 M HCl, 6 M NaOH and water to remove impurities, achieving a purity of 93%. 4-Aminobenzoic acid (4-ABA) was purchased from Merck and used as received. Perchloric acid (HClO4 60%) and nitric acid (HNO3 65%) were purchased from VWR Chemicals. Potassium dihydrogen phosphate (KH2PO4), dipotassium hydrogen phosphate (K2HPO4), glucose oxidase from Aspergillus niger (50KU), bovine serum albumin (BSA), glutaraldehyde (GA 50%), and D-(+)-glucose (>99.5%), were purchased from Sigma-Aldrich. All the solutions were prepared using ultrapure water (18 MOhms cm) obtained from an Elga Lab Water. The gases N2, and O2, (5.0 grade, 99.999% purity, Linde) were used without any further purification or treatment.2.2. Physicochemical characterization
The samples were characterized by Transmission Electron Microscopy (TEM) coupled to energy dispersive X-ray analysis (EDX) with a JEOL JEM-2010 microscope operating at 200 kV with a spatial resolution of 0.24 nm. Field Emission Scanning Electron Microscope (FE-SEM) (ZEISS, Merlin VP Compact model) coupled to EDX (BRUKER Quantax 400 model) equipment was used to analyze the distribution of the GOx on the NTs surface.The textural properties of the materials was assessed by physical adsorption of N2 at −196 °C, using an automatic adsorption system (Autosorb-6, Quantachrome). Prior to measurements, the samples were degassed at 250 °C for 4 h. Apparent surface areas have been determined by Brunauer–Emmett–Teller (BET) method (SBET) and total micropore volume (pores of size < 2 nm) has been assessed by applying Dubinin-Radushkevich (DR) equation to the N2 adsorption isotherms.40
The surface composition and oxidation states of the elements of the prepared materials were studied using X-ray Photoelectron Spectroscopy (XPS) in a VG-Microtech Multilab 3000 spectrometer with an Al Kα radiation source (1253.6 eV). Temperature programmed desorption (TPD) experiments were carried out in a DSC-TGA equipment (TA Instruments, SDT Q600) coupled to a mass spectrometer (Thermostar, Balzers, GSD 300 T3). The thermobalance was purged for 2 h under a helium flow rate of 100 ml min−1 and then heated up to 950 °C (heating rate 20 °C min−1).
2.3. Functionalization of NTs
The surface chemistry of the NTs was modified aiming to improve the enzyme immobilization. Two functionalization processes were done: (i) chemical oxidation with HNO3 and (ii) electrochemical functionalization with 4-ABA.![[thin space (1/6-em)]](https://www.rsc.org/images/entities/char_2009.gif) :40. The mixture was kept under magnetic stirring at room temperature for 3 h and 6 h for h-NT and t-NT, respectively. After the oxidation, several washes with distilled water were done until the pH became neutral. The samples were ready for use after a complete drying at 120 °C overnight, resulting in h-NTOX and t-NTOX samples.:5 wt%, respectively. A square-molded portion of the dried paste containing 25 mg and 1.5 cm2 of this mixture was manually pressed and spread onto each side of a graphite sheet collector to achieve an electrode with a uniform and thin coating of carbon nanotubes.
:40. The mixture was kept under magnetic stirring at room temperature for 3 h and 6 h for h-NT and t-NT, respectively. After the oxidation, several washes with distilled water were done until the pH became neutral. The samples were ready for use after a complete drying at 120 °C overnight, resulting in h-NTOX and t-NTOX samples.:5 wt%, respectively. A square-molded portion of the dried paste containing 25 mg and 1.5 cm2 of this mixture was manually pressed and spread onto each side of a graphite sheet collector to achieve an electrode with a uniform and thin coating of carbon nanotubes.The functionalization of the h-NT was performed in a three-electrode cell, using the working electrode prepared as mentioned above, a platinum wire as counter electrode and Ag/AgCl electrode as reference electrode. Potentiodynamic functionalization was achieved by submitting the sample to cyclic voltammetry in a 0.1 M HClO4 solution containing 1 mM of 4-ABA, where the potential was scanned between 0.5 and 1.4 V (vs. Ag/AgCl) at 10 mV s−1 during 10 cycles. The functionalized material was removed from the graphite sheet, washed with distilled water several times and dried at 100 °C overnight. This sample is denoted as h-NT_4ABA.
2.4. Electrodes preparation and enzyme immobilization
The electrodes were prepared using dispersions of the carbon nanotubes in water. The concentration was different for each material in order to ensure the homogeneity of the dispersions, 0.5, 0.25, 0.5 and 0.125 mg ml−1 for h-NT, h-NTOX, h-NT_4ABA and t-NTOX, respectively. In the case of the t-NT, it was not possible to achieve a good dispersion even at very low concentrations, therefore they have been discarded for this study. 10 μg of each carbon material were drop casted from their suspensions (in each suspension, the drop-casted volume was selected in order to attain such amount of material) on a polished glassy carbon surface (3 mm Ø) and dried using an infrared heating lamp.The modified glassy carbon electrode was loaded with different amounts of GOx. The proper amount of GOx solution (10 mg GOx, 40 mg BSA, and 1 ml of 0.1 M phosphate buffer solution – PBS) was casted onto the electrode surface in order to obtain a GOx loading of 6.3 μmolGOx gNT−1 (1:1 weight ratio). In the case of the oxidized NTs, GOx loading between 0.3 and 125 μmolGOx gNT−1 were tested for the optimization of sensitivity at positive potentials. Then, a 1:1 mass ratio of GA solution (2.5%) to GOx was dropped onto the surface and dried at room temperature for 30 min. GA is known to promote the crosslinking of the enzyme and the support, which enhances the enzyme stability.41 Thereafter, the electrodes were drop casted with 2 μl of 2.5% Nafion® solution in order to further immobilize as much amount of GOx as possible on the electrode, and dried at room temperature. Finally, the electrodes were immersed in 10 ml of 0.1 M PBS solution under stirring for 20 min in order to remove all the unreacted GA and the GOx that was not successfully immobilized. UV-Vis measurements conducted on the washing solution did not show any measurable absorbance due to GOx, which allows us to assume that most of GOx is retained within the electrode. All enzyme-modified electrodes were stored at 4 °C in a refrigerator when not in use. The electrodes are denoted as h-X-GY and t-X-GY for the herringbone and multiwall nanotubes, respectively, being X the name of the functionalized material and Y the GOx loading in the electrode in μmolGOx gNT−1.
2.5. Electrochemical measurements
The electrochemical characterization of the electrodes was performed in a Biologic VSP 300 potentiostat using the same standard three-electrode cell configuration already described in Section 2.3.2. The electrochemical behavior was studied by cyclic voltammetry (CV) in 0.1 M PBS (pH 7) electrolyte in N2 and O2-saturated atmosphere at room temperature. The successful immobilization of the GOx has been checked measuring the redox process of FAD/FADH2 with the scan rate. This study indicates that it corresponds to a surface process. In order to analyze the sensitivity towards the presence of glucose, chronoamperometric experiments were performed in the same system described above in an O2-saturated 0.1 M PBS solution at 0.45 V. Successive additions of glucose aliquots (0.1 to 20 mM) were injected into the PBS solution, and the changes in the current associated to the activity of GOx towards glucose oxidation were registered and employed for the determination of the sensitivity of the different sensors. Chronoamperometric experiments at −0.30, −0.40 and −0.45 V were performed using a rotating disk electrode (RDE, EDI101, Radiometer analytical) as working electrode for improving the oxygen mass transfer to the electrodes. The measurements were performed at a rotating speed of 1000 rpm, and successive additions of glucose aliquots from 0.002 to 13.5 mM were injected into the O2-saturated PBS solution. The same experiment was replicated in an O2-free PBS solution. For this purpose, nitrogen was constantly bubbled in the solution for at least 4 hours until a negligible reduction current at −0.40 V was registered on the working electrode before the addition of the first aliquot. Nitrogen bubbling was kept in order to ensure the absence of oxygen during the measurements.3. Results and discussion
3.1. Physicochemical characterization
The morphology of the carbon nanotubes was characterized by transmission electron microscopy (TEM). Fig. 1 shows the TEM images of the pristine carbon nanotubes. From the TEM images it was possible to determine the diameter of the nanotubes, being 20–30 nm and 6–10 nm for the h-NT and t-NT, respectively. The t-NTs have a multiwall structure, formed by several concentric tubes with 3–5 layers. The h-NTs display a stacked herringbone-type conical graphite sheets with a cone angle of ∼25° to the tube axis. It is possible to observe that t-NTs possess a much more homogeneous surface and a lower amount of surface defects than h-NTs, a feature that can play an important role in GOx immobilization, as will be later discussed.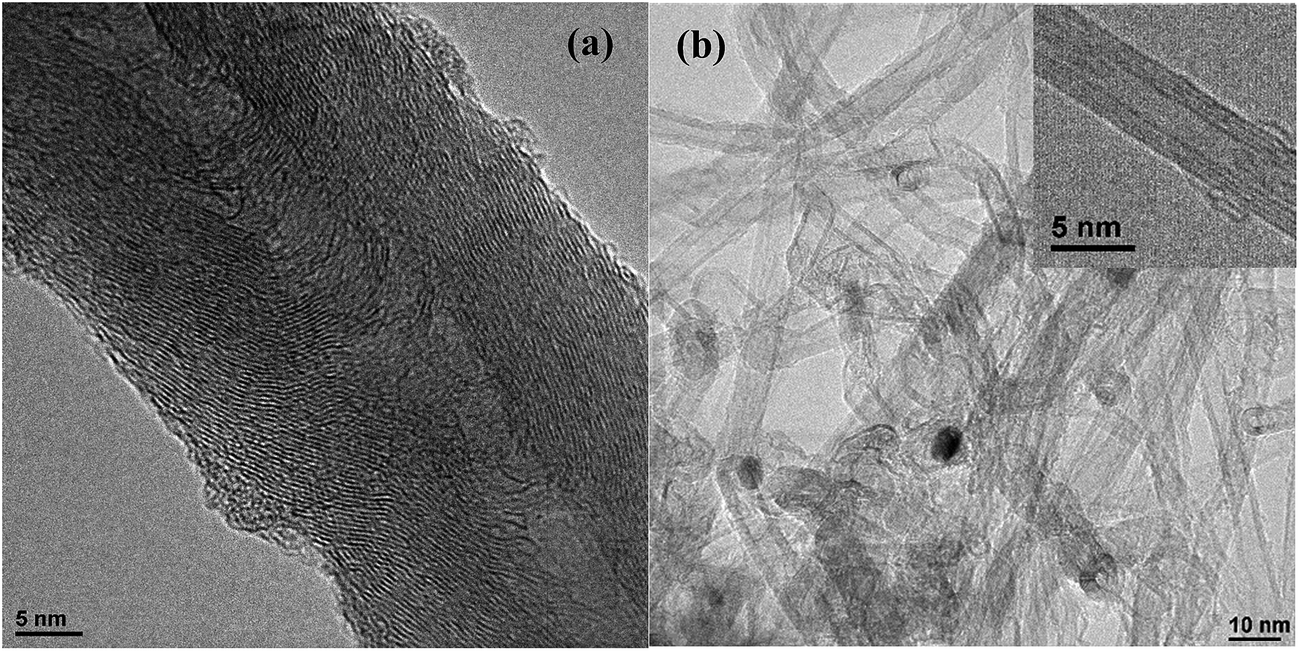 | ||
| Fig. 1 TEM images of (a) h-NT and (b) t-NT. | ||
The BET surface areas were calculated for these samples from the N2 adsorption isotherms of h-NT (with and without oxidation treatment) and t-NTOX (Fig. S1†). In the case of h-NT and h-NTOX, BET surface area values of 150 and 145 m2 g−1, respectively, were found; for the t-NT and t-NTOX, the surface areas were higher, 407 and 255 m2 g−1, respectively. These results are in agreement with the materials structure and the smaller diameter of the t-NTOX. Both NTs have a low contribution of micropores (0.06 cm3 g−1 for h-NT and h-NTOX and 0.15 and 0.1 cm3 g−1 for t-NT and t-NTOX).
The surface composition and oxidation states of the elements of the materials were analyzed by XPS. Functionalized samples present an increase in the amount of oxygen and nitrogen contents according to the functionalization procedure (Table S1†). The oxidation treatment leads to an increase in the amount of oxygen. The carbon nanotubes with herringbone structure show a higher oxidation degree than the multiwall ones, evidenced in a higher oxygen content of the h-NTOX. Functionalization with 4-ABA displays an increase in the oxygen and nitrogen content. A 2.3 at% of nitrogen is found in this sample, related to the 4-ABA functionalities, and the N1s spectrum reveals that the anchorage of the molecule was through the amino group of the 4-ABA molecule.
The formation of different surface oxygen groups after the functionalization treatment was studied by TPD. Fig. S2† shows the CO and CO2 evolution profiles for all samples. The amounts of evolved CO, CO2 and total oxygen are shown in Table 1. The increase of oxygen amount after the functionalization treatments leaded to a better dispersibility of functionalized NTs in water. The higher amount of evolved CO2 has been achieved for the 4-ABA functionalized sample, followed very close by t-NTOX. It has been proposed that amide linkages can be formed between the amino free groups of the protein chains of the GOx and the carboxylic groups of NTs, that are known to desorb as CO2 during TPD at temperatures between 200 and 400 °C.5 Therefore, a correlation between the amount of evolved CO2 and the enzyme immobilization in each material would be expected.
| Sample | CO/μmol g−1 | CO2/μmol g−1 | Ototal/μmol g−1 |
|---|---|---|---|
| h-NTOX | 600 | 270 | 1140 |
| h-NT4ABA | 1220 | 360 | 1940 |
| t-NTOX | 660 | 340 | 1340 |
3.2. Immobilization of GOx
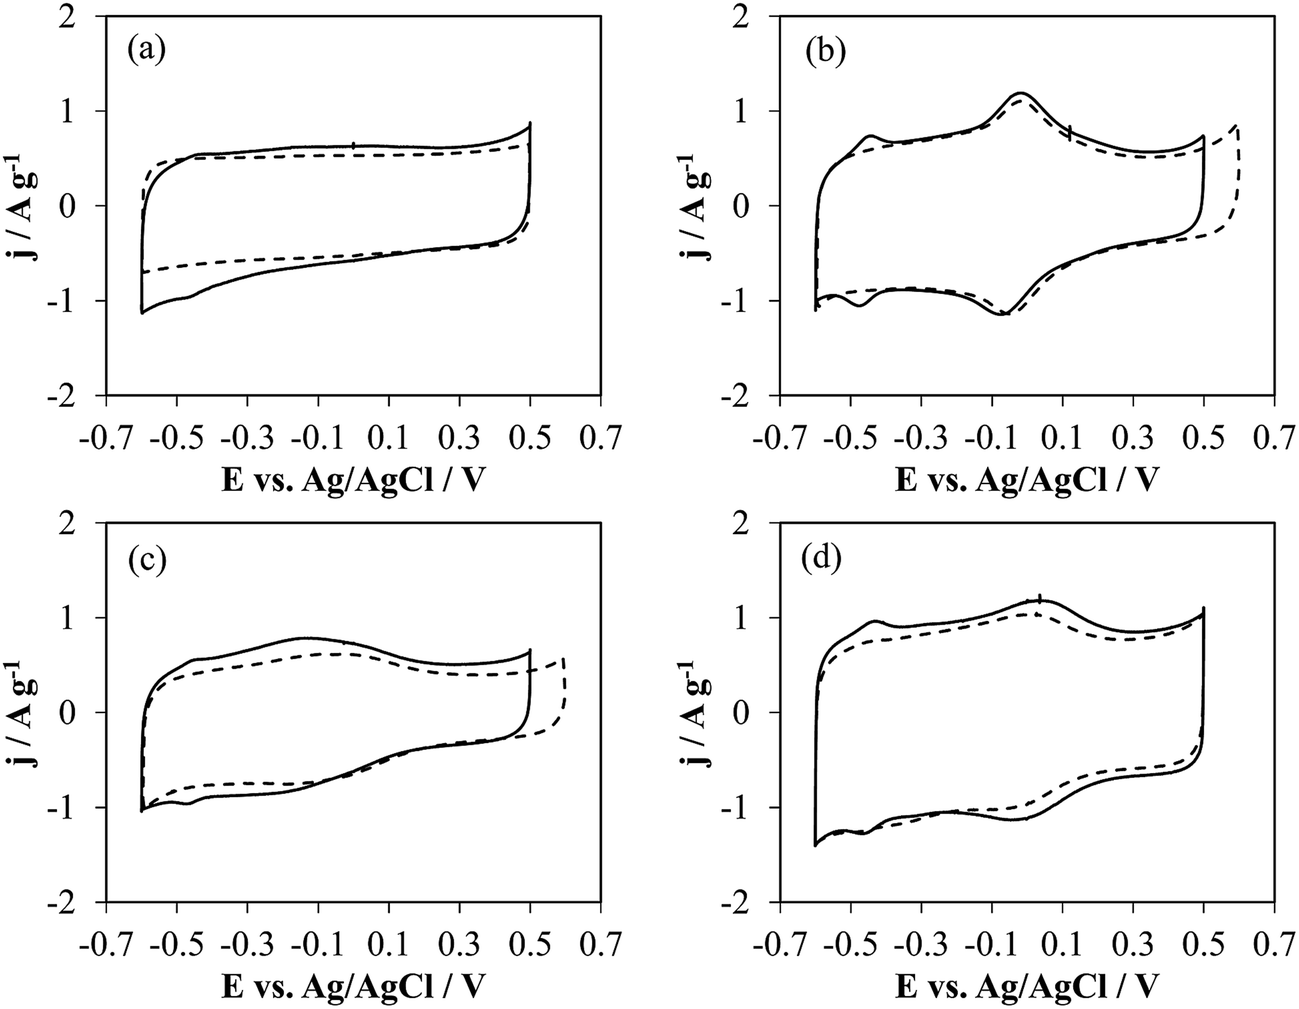 | ||
| Fig. 2 Cyclic voltammetry without (dashed line) and with GOx (solid line) of (a) h-NT-G6.3, (b) h-NTOX-G6.3, (c) h-NT_4ABA-G6.3 and (d) t-NTOX-G6.3 in 0.1 M PBS (pH 7) solution. v = 50 mV s−1. | ||
The bare (unloaded) NTs show distinct electrochemical behavior depending on the structure and surface chemistry. Thus, h-NT without any modification shows a rectangular shape, which is characteristic of carbon materials where the electrochemical response is dictated by the electrical double layer formation (purely capacitive behavior). In contrast, the other three samples, which were functionalized, show different oxidation–reduction processes. The oxidized NTs (Fig. 2b and d) show a redox peak at ca. 0 V (vs. Ag/AgCl), which is attributed to the quinone/hydroquinone couple, being an expectable outcome of the oxidation treatment, where functionalities that desorb during TPD as CO – regarded as electrochemically active42 – have been formed on the surface of the carbon nanotubes. On the other hand, the 4-ABA functionalized sample shows a broad redox process between −0.3 and −0.1 V, corresponding to the anchored species over the carbon surface that come from the oxidation of 4-ABA molecule.43
Fig. 2 (solid lines) also shows the voltammograms of the electrodes with GOx on their surface. In all samples, it is possible to distinguish a redox process at around −0.45 V which corresponds to the electroactive component of the GOx, FAD,44 but the current owing to FAD redox processes varies depending on the substrate. The presence of these peaks has been connected in the past with the DET between the enzyme and the surface of nanostructured carbon materials.44,45 The charge associated to the oxidation process has been determined from the area enclosed under the redox peak after correction of the double layer contribution, being 0.16, 0.29, 0.15 and 0.26 C g−1 for h-NT, h-NTOX, h-NT_4-ABA and t-NTOX, respectively. Considering a 2-electron transfer process for FAD redox activity, the presence of two FAD molecules bound for each GOx unit, and a molecular weight for the unit of 160 kDa, the specific amount of enzyme that is involved in DET processes is 0.83, 1.50, 0.78 and 1.35 μmolGOx gNT−1 for h-NT-G6.3, h-NTOX-G6.3, h-NT_4-ABA-G6.3 and t-NTOX-G6.3, respectively. Thus, the relative amount of enzyme loaded on these carbon materials that is available for DET ranges from 14–15% in the case of h-NT-G6.3 and h-NT_4-ABA-G6.3 to 27–32% for h-NTOX-G6.3 and t-NTOX-G6.3, which confirms that the surface chemistry of the employed materials is affecting the interaction with the enzyme, probably promoting a GOx orientation that enables DET.
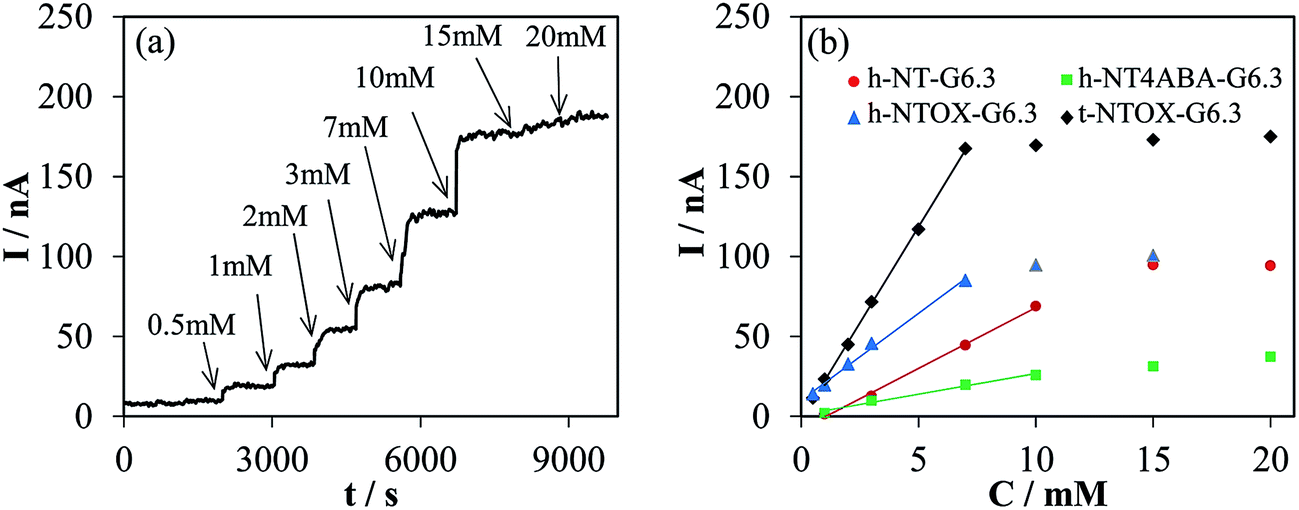 | ||
| Fig. 3 (a) Chronoamperometric response to successive additions of glucose into O2-saturated in 0.1 M PBS (pH 7) at 0.45 V of t-NTOX-G6.3 modified electrode (b) calibration curves for all the tested GOx–NTs electrodes. | ||
The reaction between glucose and GOx involves the reduction of the redox center of the FAD with glucose to give the reduced form FADH2, followed by its reoxidation by molecular oxygen to regenerate the oxidized form of the redox center:2
| GOx (FAD) + glucose → GOx (FADH2) + glucolactonate | (2) |
| GOx (FADH2) + O2 → GOx (FAD) + H2O2 | (3) |
A control experiment was conducted on a glassy carbon electrode with the amount of GOx that corresponds to a loading of 6.3 μmolGOx gNT−1, without the presence of NTs, showing no response upon addition of glucose on the electrolyte. Then, the sensing process under the selected conditions occurs by the electrochemical oxidation of H2O2 formed during the reoxidation of the FADH2 over the surface of the carbon nanotubes.
Chronoamperometric experiments were recorded under the same conditions shown in Fig. 3a for all the GOx–NTs electrodes. Fig. 3b shows the calibration curves obtained for all the electrodes. The sensitivity was determined from the linear region of the calibration curve. Table 2 summarizes the sensitivity and correlation coefficient. The highest sensitivity values were found for the t-NTOX-G6.3, being 2, 4 and 8 times higher than the h-NTOX-G6.3, h-NT-G6.3 and h-NT_4ABA-G6.3, respectively. The sensitivity was found to be especially poor when h-NT_4ABA-G6.3 was selected as substrate, and much larger noise in the current as well as longer stabilization times in each glucose addition were needed for this electrode and for h-NT-G6.3. It is important to note that, under the selected sensing conditions, there is not a clear relationship between an improved DET and the sensitivity of the sensor. This is expected when the sensing mechanism is considered, since it involves oxidation of the H2O2 generated by the enzyme, without the participation of DET. This oxidation will take place at the surface of the carbon nanotubes, allowing fast sensing of the generated H2O2.
| Sample | Sensitivity/nA mM−1 | Correlation coefficient R2 | Working range/ mM |
|---|---|---|---|
| h-NT-G6.3 | 7.60 | 0.997 | 1–10 |
| h-NTOX-G6.3 | 10.9 | 0.996 | 0.5–7 |
| h-NT_4ABA-G6.3 | 2.58 | 0.992 | 1–10 |
| t-NTOX-G6.3 | 24.1 | 0.999 | 0.5–7 |
The improved sensitivity found for h-NTOX and t-NTOX samples compared to the non-oxidized ones can be attributed either to the different activity towards H2O2 oxidation of each carbon material or to a higher amount of GOx active towards glucose oxidation (which does not necessarily involve a larger DET contribution) in the oxidized nanotubes thanks to the presence of certain oxygen functionalities that could promote a better enzyme orientation and glucose accessibility. In order to discriminate which effect plays a dominant role, CVs in presence of 3 mM H2O2 were recorded (Fig. S3†). Direct comparison with CVs recorded in absence of H2O2 revealed that in all cases the onset potential for H2O2 oxidation lies around 0.40 V, whereas the current registered at 0.45 V is low and comparable between all samples, pointing a similar catalytic activity for the oxidation of H2O2. Thus, it is expected that during the glucose sensing tests, the current registered at the electrode, and therefore the sensitivity, will be originated by the amount of active enzyme, which determines the hydrogen peroxide formation rate.
The stability of the electrodes towards glucose detection was tested at different times after their preparation. The electrodes show a good stability, their initial activity is maintained after 5 days (see Fig. S4 for more ESI†).
3.3. Effect of GOx loading
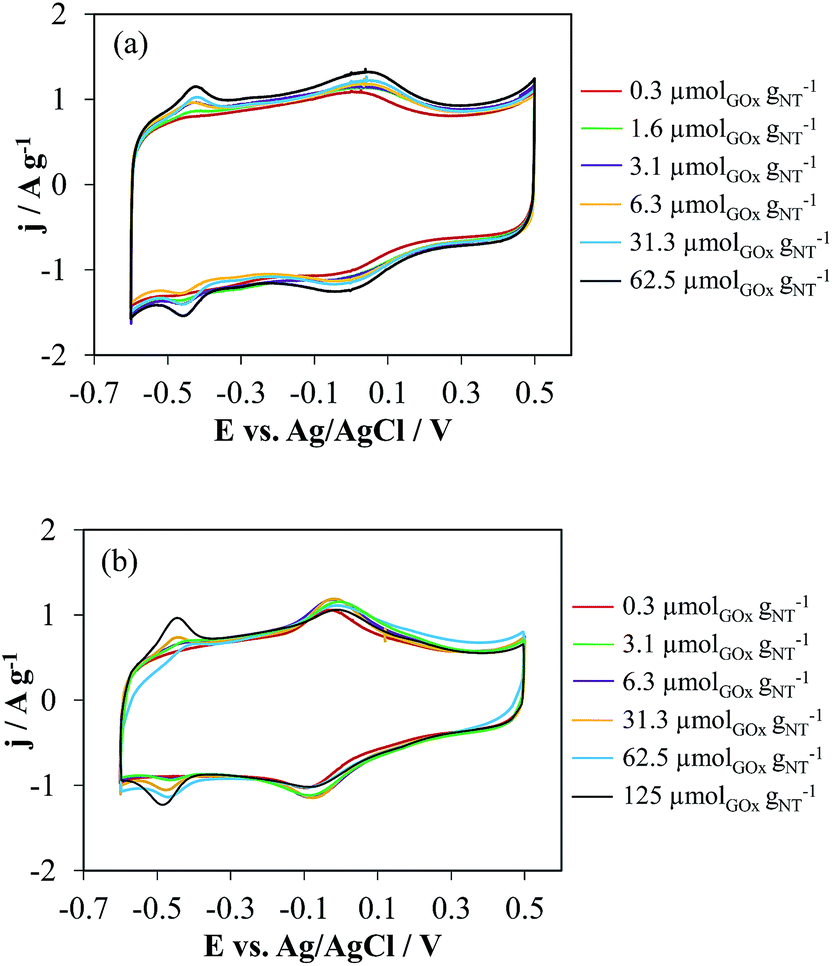 | ||
| Fig. 4 Cyclic voltammetry in 0.1 M PBS (pH 7) of (a) t-NTOX and (b) h-NTOX with different GOx loading. v = 50 mV s−1. | ||
| Sample | GOx loading/μmolGOx gNT−1 | Sensitivity/nA mM−1 | FAD/FADH2 charge/C g−1 | FAD/FADH2 charge/μmol g−1 | Correlation coefficient/R2 | Working range/mM |
|---|---|---|---|---|---|---|
| h-NTOX | 125 | 11.4 | 0.54 | 2.81 | 0.999 | 0.1–7 |
| 62.5 | 12.3 | 0.12 | 0.61 | 0.999 | 0.1–5 | |
| 31.3 | 11.0 | 0.17 | 0.90 | 0.999 | 0.1–7 | |
| 6.3 | 11.3 | 0.23 | 1.20 | 0.999 | 0.1–5 | |
| 3.1 | 9.60 | 0.08 | 0.43 | 0.996 | 0.1–3 | |
| 0.3 | 5.18 | <0.01 | <0.05 | 0.996 | 0.1–7 | |
| t-NTOX | 62.5 | 23.9 | 0.45 | 2.33 | 0.999 | 0.1–7 |
| 31.3 | 22.4 | 0.32 | 1.68 | 0.999 | 0.1–7 | |
| 6.3 | 23.7 | 0.26 | 1.37 | 0.999 | 0.1–7 | |
| 3.1 | 59.5 | 0.24 | 1.26 | 0.998 | 0.1–7 | |
| 1.6 | 20.5 | 0.15 | 0.78 | 0.998 | 0.1–7 | |
| 0.3 | 16.2 | 0.09 | 0.46 | 0.999 | 0.1–7 |
These differences among h-NTOX and t-NTOX can be attributed again to the different structure and surface area of both carbon materials. It seems that for h-NTOX, the amount of GOx that can be fixed with the adequate orientation is much lower than for t-NTOX due to both the heterogeneous structure and the lower surface area. Further evidences of the improved immobilization of GOx in t-NTOX can be seen in FE-SEM images (Fig. 5 and S5†). Fig. S5† includes the FE-SEM image for t-NTOX sample for comparison purposes. Unfortunately, the image for unsupported GOx could not be obtained due to the strong agglomeration that occurs when the GOx enzyme is dropped on the microscope support. At low GOx loadings (0.3 μmol g−1), the enzyme forms agglomerates on the surface of h-NTOX (Fig. 5a), while a smooth distribution of GOx is achieved when t-NTOX is used as substrate (Fig. 5b), what probably delivers a larger amount of active enzyme. It was also found that when GOx is loaded in amounts higher than 6.3 μmolGOx gNT−1, the surface of the electrodes is fully covered by GOx agglomerates (images not shown), and most of those additional enzymes are either unreachable for glucose or too far from the surface of NTs, so that the diffusion of H2O2 to the NTs is hindered, making those enzymes inactive in terms of the sensitivity of the electrode.
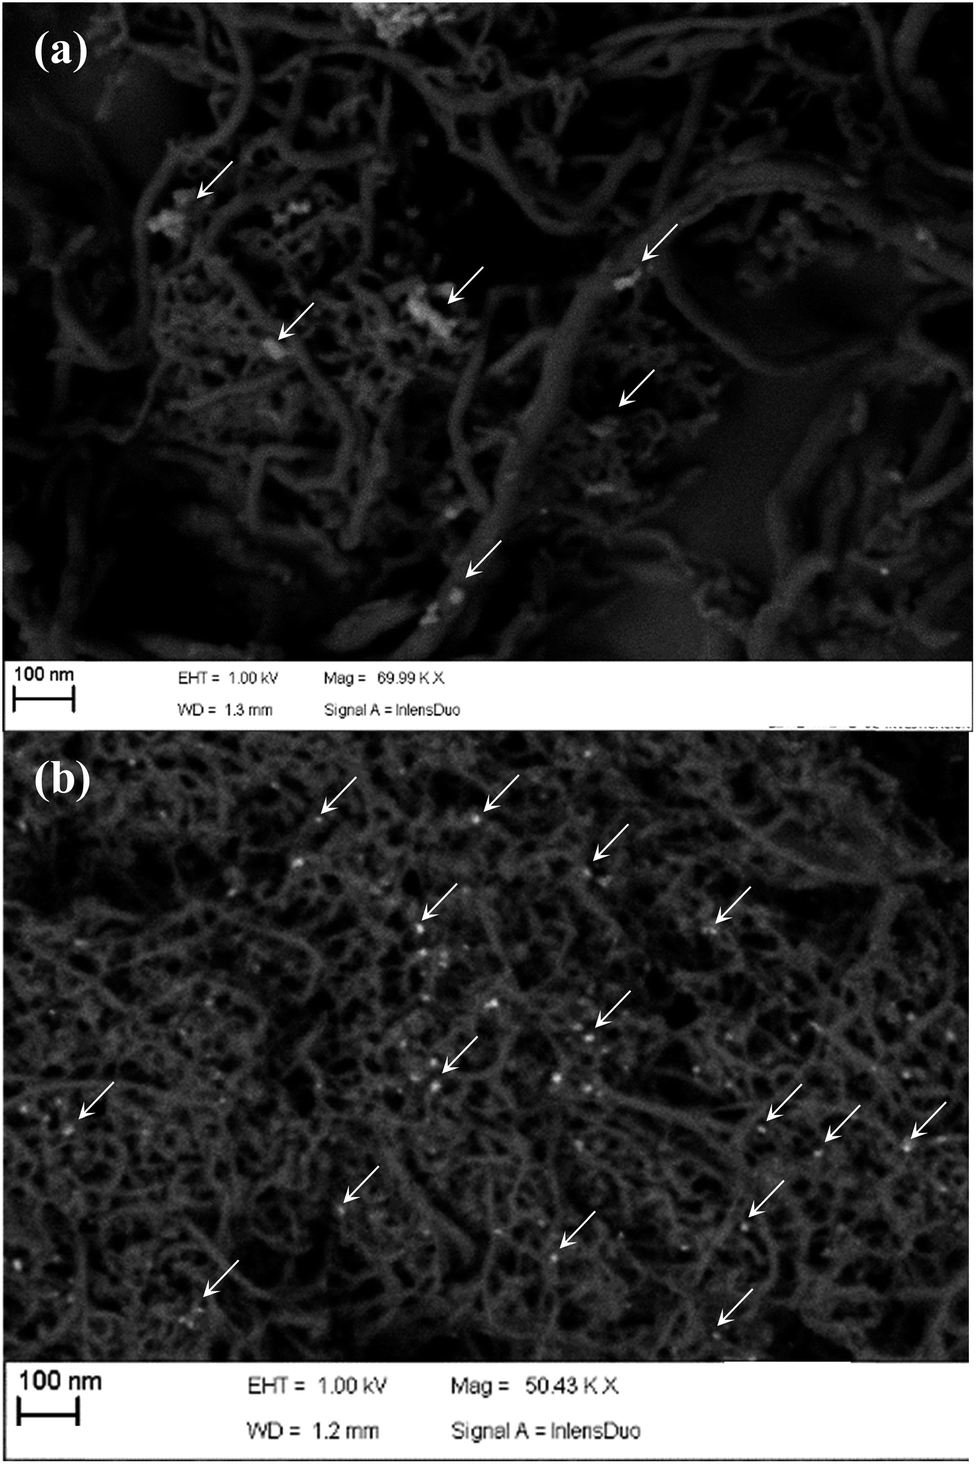 | ||
| Fig. 5 FE-SEM images for GOx loaded (a) h-NTOX-G0.3 and (b) t-NTOX-G0.3. | ||
These results lead to the conclusion that for both substrates the amount of immobilized and active GOx is maximized using GOx loading between 3 and 6 μmolGOx gNT−1. As previously mentioned, any further increase would deliver either no more active GOx or even the blockage of immobilized proteins that were previously active, thus rendering no improvement in the electrocatalytic activity towards glucose detection of the electrodes. This is especially remarkable for t-NTOX due to the much more homogeneous distribution achieved in this material.
Assuming that all the BET surface area of these nanotubes would be available for GOx adsorption and that the area covered by a GOx unit adsorbed on the surface of the carbon nanotube through the bridge connecting their two monomers would be around 50 nm2,39 the estimated GOx/NT ratio for achieving full coverage of the surface of carbon nanotubes is 8.5 μmolGOx gNT−1 for t-NTOX, whereas this value would be 5.1 μmolGOx gNT−1 for h-NTOX. These theoretical values are very close to those experimentally determined, 3–6 μmolGOx gNT−1. It must be noted that the sensitivity divided by the BET surface area, is always higher for t-NTOX (between 1.3 and 4 times higher), showing the relevance of the NT structure on GOx activity.
Interestingly, the sensitivity of electrodes prepared with different GOx amounts is not related to the charge associated to FAD redox processes (Table 3). These results are consistent with the hypothesis that GOx orientation on NTs affects the activity of the enzyme.8,46 Thus, GOx can be partially unfolded upon adsorption on the curved surface of carbon nanotubes, facilitating the electrical contact between the FAD and the surface.46 Unfortunately, the enzyme denaturalization and inadequate orientation would render the loss of GOx activity towards glucose oxidation,8,46 explaining the lack of relationship between DET and sensitivity.
The use of lower potential during the chronoamperometric experiments to avoid the interferences was tested using 0.15 and 0.25 V (not shown). As expected there was no measurable response for any glucose concentration. It confirms, as it was previously mentioned, that the glucose detection at 0.45 V is being achieved by the detection of the H2O2 formed during the reaction, instead of by DET between the enzyme and the glucose.
3.4. Glucose determination using negative potentials
In order to avoid the interferences, chronoamperometric tests at potential of −0.40 V were performed for the h-NTOX-G6.3 and t-NTOX-G3.1 electrodes since they have been found to be the ones with the optimum GOx loading in the previous section. The working potential was selected near the oxidation potential of FAD group as previously detected by CV measurements in Fig. 2.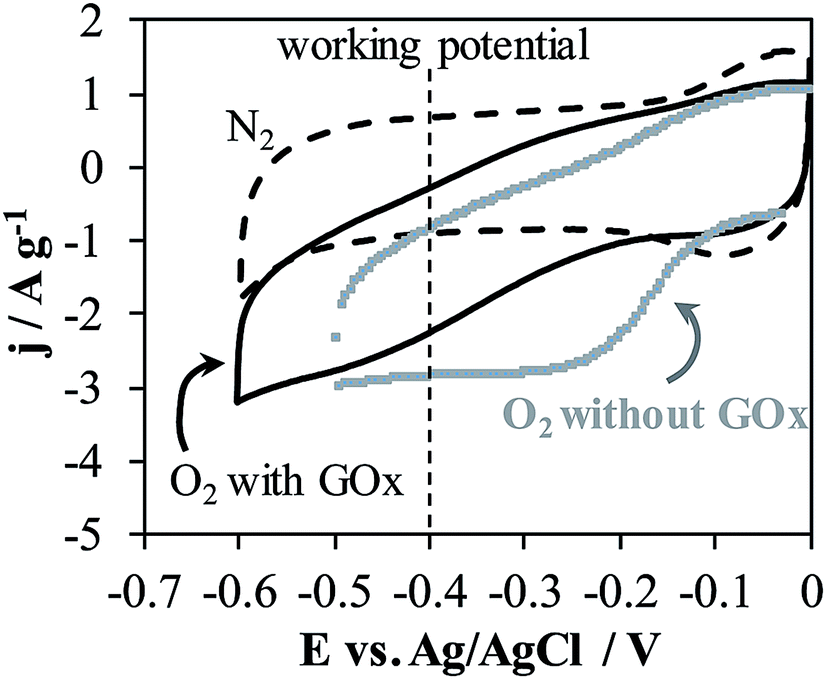 | ||
| Fig. 6 Cyclic voltammetry in N2 and O2 atmospheres of h-NTOX and h-NTOX-G6.3 modified electrodes. 0.1 M PBS (pH 7) solution. v = 50 mV s−1. | ||
When the electrolyte is saturated with O2 by constant bubbling, glucose detection at −0.40 V was easily achieved for both electrodes (h-NTOX-G6.3 and t-NTOX-G3.1) (Fig. 7). In the presence of O2, glucose is oxidized to D-glucono-1,5-lactone again by the action of GOx and the O2 is reduced to H2O2 by the action of the enzyme, which also leads to the oxidation of the FADH2 to FAD. A decrease in the reduction current of O2 is expectable due to the lower O2 concentration on the proximity of the electrode surface induced by the enzyme activity.8,12,44,50–52
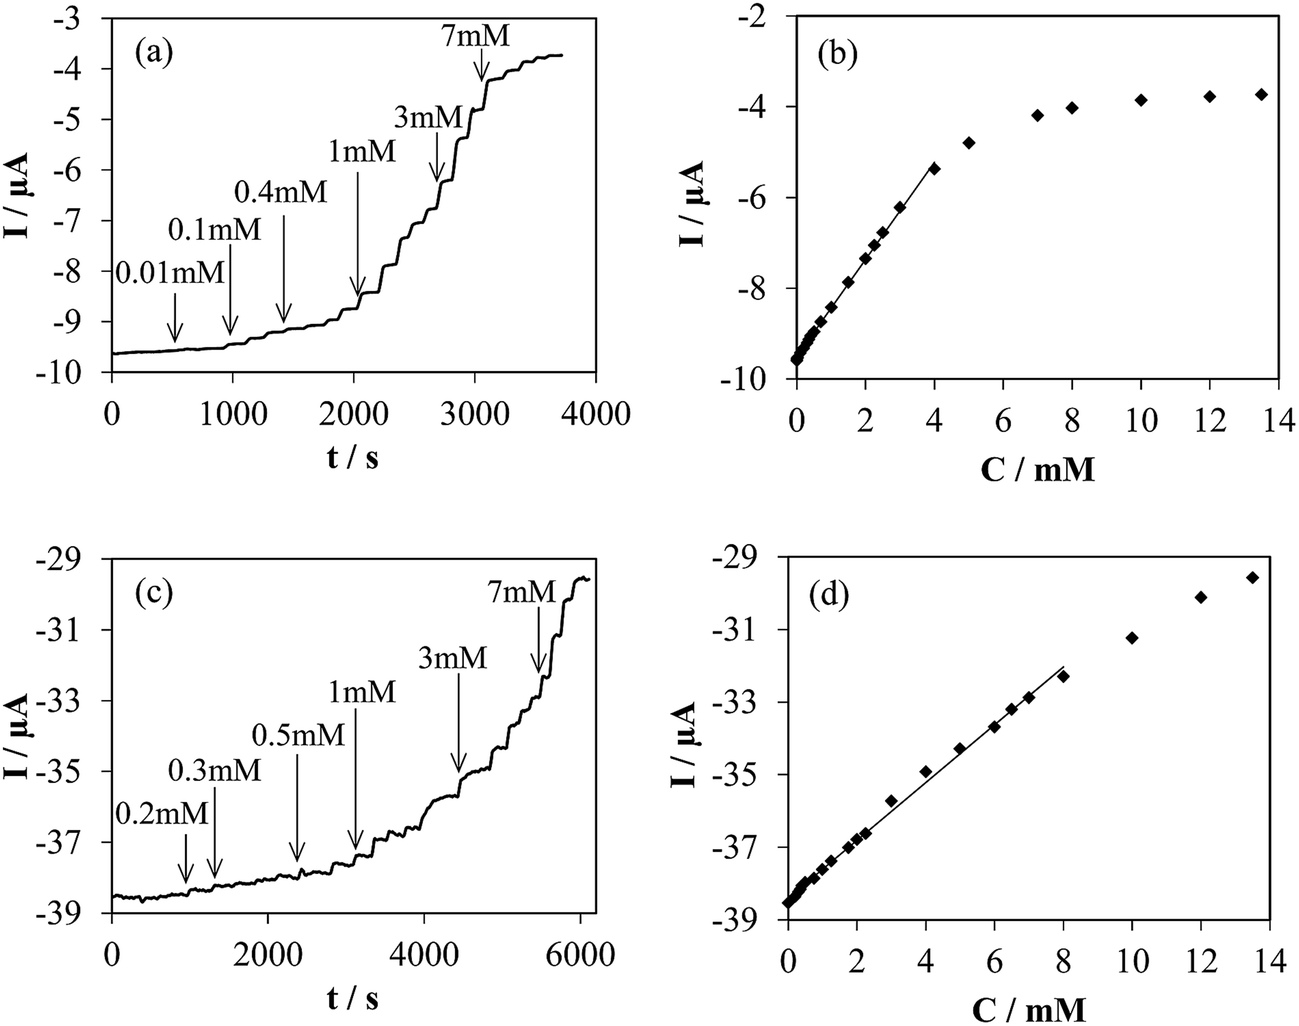 | ||
| Fig. 7 (a) and (c) Chronoamperometric response to successive additions of glucose into O2-saturated 0.1 M PBS (pH 7) solution at −0.40 V of h-NTOX-G6.3 and t-NTOX-G3.1 modified electrodes, respectively. (b) and (d) Calibration curves obtained from experiments (a) and (c). | ||
Fig. 7a and c shows the glucose detection in an O2 saturated atmosphere at −0.40 V. A quick response after the addition of several glucose aliquots is observed. The first added aliquot for both experiments was 2 μM, however the detection was achieved at higher concentration of glucose. The glucose biosensor prepared using h-NTOX-G6.3 shows a working range between 0.03 and 4 mM (correlation coefficient 0.999), with a sensitivity of 1.07 μA mM−1 and a detection limit of 0.01 mM (experimentally determined). The biosensor based in t-NTOX-G3.1 shows a working range between 0.3 and 7 mM (correlation coefficient 0.998), and a sensitivity of 0.804 μA mM−1 with a detection limit of 0.1 mM (experimentally determined). As it can be seen, the sensitivity of the h-NTOX-G6.3 based biosensor is slightly higher than the one for t-NTOX-G3.1, which could be related to the use of double the amount of GOx in these sensors. However, the working range is reduced. This fact is important depending on the use given to the biosensor, since the conventional blood glucose levels are between 4.0 to 5.9 mM.2 The t-NTOX biosensor covers this concentration range, while, the h-NTOX based biosensor could be used in fluids in which the concentration of glucose is low like perspiration and saliva.53–55
Differences in working range can be explained by the amount of active enzyme that is available in each electrode. At the selected working conditions (−0.40 V vs. Ag/AgCl, 1000 rpm), NTs are known to present a high catalytic activity towards oxygen reduction reaction, and rotary ring-disk electrode measurements show they work at diffusion-controlled potential region.43 Contrarily than in the case of glucose detection by H2O2 oxidation at the electrode, this high activity towards the electrochemical reaction involved in the sensing mechanism ensures that the registered current in presence of glucose is governed by the enzymatic kinetics. Considering that the determining step in the overall glucose oxidation reaction is the oxidation of FADH2 by oxygen,56 the oxygen consumption rate for FAD regeneration can be assumed to be equal to the glucose oxidation rate, following a Michaelis–Menten mechanism. In it, the reaction rate is proportional to the amount of active enzyme. Moreover, the maximum reaction rate in this mechanism, rmax, is defined as the product of the kinetic constant and the enzyme concentration, and is reached when glucose concentration is increased enough to saturate all the available enzymes. Therefore, the current densities registered in the absence of glucose, J0 and when the sensor is saturated by the presence of a high glucose concentration, JM, could be used for estimating the amount of GOx immobilized in these electrodes:
| JM − J0 = Fermax = Fekcat[enzyme]0 | (4) |
The evaluation of the effect of the presence of different interferents was also performed in these biosensors. The addition of uric acid (0.1 mM) and (0.1 mM) exhibited no modification of the glucose determination in both biosensors. Therefore, they are expected to be reliable for selective glucose detection in biological fluids using these conditions.
The differences between samples on the amount and the activity of immobilized enzyme could be used for drawing some conclusions about the different sensitivities achieved in each detection mechanism. In the detection approach by oxidation of H2O2 at positive potentials, the sensitivity is probably controlled by the amount of active GOx (which is unrelated to DET) within the electrode. On the other hand, at reduction potential of −0.40 V, the activity towards oxygen reduction reaction is very high for the NTs electrodes in the selected conditions (Fig. 6), and glucose detection is driven by changes in the oxygen reduction current (again being unconnected to DET). Sensitivity is therefore related to catalytic activity towards oxygen reduction, rather than to the amount of active GOx in the electrode. The no observation of DET in presence of glucose could be due to the aggregation of the enzyme, being active towards glucose those which are in direct contact with the NTs. However, the DET observed by cyclic voltammetry in absence of glucose corresponds to the enzyme in direct contact with the NTs surface. Nevertheless, the working range is controlled by the amount of active GOx, what can be easily explained in terms of enzymatic kinetics. Since the amount of active enzyme on t-NTOX is higher (due to the reasons assessed in the previous section), sensors obtained using these nanotubes show the highest sensitivity at positive potentials, and a wider working range at negative potentials.
4. Conclusions
Electrochemical glucose biosensors based on GOx enzyme and NTs with different structures were developed. Several functionalization processes were tested on these materials in order to study the effect of the surface chemistry upon the GOx immobilization and the electrochemical activity towards glucose detection. The successful GOx immobilization was verified by CVs, which demonstrated that DET between the enzyme and NTs is possible, as pointed out by the detection of the FAD electroactive group of the enzyme in all the tested materials.Different approaches were used to analyze the sensitivity of the biosensors. Chronoamperometric experiments at 0.45 V with several additions of glucose were performed as an initial screening test. The results show that the oxidized NTs are the best substrates for glucose oxidase immobilization for glucose biosensing. This can be attributed to the presence of the oxygen functionalities in the carbon surface, which can promote a suitable enzyme orientation. Functionalization with 4-ABA moieties did not bring an improved immobilization or sensitivity to the resulting GOx–NT_4ABA electrode. The t-NTOX shows a better sensitivity than the h-NTOX. It is important to note that, even though DET increases homogeneously in accordance with GOx loading, no clear relationship between DET and sensitivity has been observed in these electrodes. This could be due to different structure and surface chemistry of the materials, which seems to drive the orientation of the adsorbed enzyme molecules in the surface of the NTs. The homogeneous structure of the t-NTOX allows a better and similar orientation of the GOx compared to the h-NTOX, which have a heterogeneous structure with a large amount of edge sites inducing a different orientation, and more extensive agglomeration, of the GOx. In this sense, the optimum amount of GOx loading during the immobilization step for maximizing the electrode sensitivity towards glucose detection was estimated to be 6.3 μmolGOx gNT−1 and 3.1 μmolGOx gNT−1 for h-NTOX and t-NTOX, respectively. For all the tested GOx loadings, t-NTOX always shows larger sensitivity values than h-NTOX, even when these values are normalized by BET surface area. This result points out that the NT structure is the most important factor for achieving an adequate enzyme distribution and orientation.
The use of a lower potential, closer to the potential of the FAD/FADH2 redox processes (−0.40 V) was also tested. Experiments in O2-saturated solutions leaded to a good response to glucose detection with a high sensitivity, while removing all interference problems. A similar experiment under anaerobic conditions pointed out that oxygen plays a key role in the detection mechanism. In this approach, the detection is done by a net decrease in the current of the O2 reduction. h-NTOX based biosensor with a sensitivity of 1.07 μA mM−1 and a detection limit of 0.01 mM (0.03–4 mM) was obtained, while the t-NTOX based biosensor, which was constructed using half the amount of GOx, showed a sensitivity of 0.804 μA mM−1 and a detection limit of 0.1 mM (0.3–7 mM). The saturation current of the sensors has been employed for estimating the amount of immobilized GOx, confirming a noticeable higher activity of enzymes loaded in t-NTOX.
The results presented in this work show that the combination of a suitable surface chemistry and structure of the carbon nanotubes enhances the activity of the immobilized enzyme associated to the adequate orientation to the surface of carbon nanotube. This combination is directly related to the final performance of the biosensor, which should be considered in the development of electrochemical sensors using enzymes and carbon nanotubes.
Acknowledgements
The authors would like to thank MINECO and FEDER (MAT2016-76595-R), Generalitat Valenciana (PROMETEOII/2014/010) for the financial support. RRR thanks MINECO for a ‘Juan de la Cierva’ contract (JCI-2012-12664). CGG gratefully acknowledges Generalitat Valenciana for the financial support through a Santiago Grisolía grant (GRISOLIA/2013/005).References
- C. Chen, Q. Xie, D. Yang, H. Xiao, Y. Fu, Y. Tan and S. Yao, RSC Adv., 2013, 3, 4473 RSC.
- J. Wang, Chem. Rev., 2008, 108, 814–825 CrossRef CAS PubMed.
- L. C. Clark and C. Lyons, Ann. N. Y. Acad. Sci., 1962, 102, 29–45 CrossRef CAS PubMed.
- R. Thusu, Sensors, 2010, http://www.sensorsmag.com/components/sensors-facilitate-health-monitoring, accessed January 2017 Search PubMed.
- Y. Lin, F. Lu, Y. Tu and Z. Ren, Nano Lett., 2004, 4, 191–195 CrossRef CAS.
- S. Ferri, K. Kojima and K. Sode, J. Diabetes Sci. Technol., 2011, 5, 1068–1076 CrossRef PubMed.
- D. S. Goodsell, RCSB Protein Data Bank, 2006 Search PubMed.
- M. Wooten, S. Karra, M. Zhang and W. Gorski, Anal. Chem., 2014, 86, 752–757 CrossRef CAS PubMed.
- X. Zhang, D. Liu, L. Li and T. You, Sci. Rep., 2015, 5, 9885 CrossRef CAS PubMed.
- A. Chaubey and B. D. Malhotra, Biosens. Bioelectron., 2002, 17, 441–456 CrossRef CAS PubMed.
- C. Shan, H. Yang, J. Song, D. Han, A. Ivaska and L. Niu, Anal. Chem., 2009, 81, 2378–2382 CrossRef CAS PubMed.
- V. Mani, B. Devadas and S.-M. Chen, Biosens. Bioelectron., 2013, 41, 309–315 CrossRef CAS PubMed.
- C.-J. Cai, M.-W. Xu, S.-J. Bao, C. Lei and D.-Z. Jia, RSC Adv., 2012, 2, 8172 RSC.
- W. Zhang and G. Li, Anal. Sci., 2004, 20, 603–609 CrossRef CAS PubMed.
- C. B. Jacobs, M. J. Peairs and B. J. Venton, Anal. Chim. Acta, 2010, 662, 105–127 CrossRef CAS PubMed.
- J. Wang, Electroanalysis, 2005, 17, 7–14 CrossRef CAS.
- M. Feng, H. Han, J. Zhang and H. Tachikawa, in Electrochemical Sensors, Biosensors and their Biomedical Applications, Elsevier, 2008, pp. 459–501 Search PubMed.
- J. Wang, Analyst, 2005, 130, 421–426 RSC.
- H. Ago, T. Kugler, F. Cacialli, W. R. Salaneck, M. S. P. Shaffer, A. H. Windle and R. H. Friend, J. Phys. Chem. B, 1999, 103, 8116–8121 CrossRef CAS.
- Y. Otake and R. G. Jenkins, Carbon, 1993, 31, 109–121 CrossRef CAS.
- T. J. Bandosz and C. O. Ania, in Interface Science and Technology, Elsevier, 2006, vol. 7, pp. 159–229 Search PubMed.
- R. Berenguer, H. Nishihara, H. Itoi, T. Ishii, E. Morallón, D. Cazorla-Amorós and T. Kyotani, Carbon, 2013, 54, 94–104 CrossRef CAS.
- M. J. Bleda-Martínez, D. Lozano-Castelló, E. Morallón, D. Cazorla-Amorós and A. Linares-Solano, Carbon, 2006, 44, 2642–2651 CrossRef.
- X. Xu, S. Jiang, Z. Hu and S. Liu, ACS Nano, 2010, 4, 4292–4298 CrossRef CAS PubMed.
- Y. Lin, S. Taylor, H. Li, K. A. S. Fernando, L. Qu, W. Wang, L. Gu, B. Zhou and Y.-P. Sun, J. Mater. Chem., 2004, 14, 527–541 RSC.
- A. TermehYousefi, H. Tanaka and S. Bagheri, Rev. Chem. Eng., 2017, 33, 201–215 CAS.
- X. Chu, D. Duan, G. Shen and R. Yu, Talanta, 2007, 71, 2040–2047 CrossRef CAS PubMed.
- C. Zhu, G. Yang, H. Li, D. Du and Y. Lin, Anal. Chem., 2015, 87, 230–249 CrossRef CAS PubMed.
- J. Wang, M. Musameh and Y. Lin, J. Am. Chem. Soc., 2003, 125, 2408–2409 CrossRef CAS PubMed.
- B. Mecheri, D. De Porcellinis, P. T. Campana, A. Rainer, M. Trombetta, A. Marletta, O. N. Oliveira and S. Licoccia, ACS Appl. Mater. Interfaces, 2015, 7, 28311–28318 CAS.
- M. Zhang, A. Smith and W. Gorski, Anal. Chem., 2004, 76, 5045–5050 CrossRef CAS PubMed.
- J. Wang and M. Musameh, Anal. Chem., 2003, 75, 2075–2079 CrossRef CAS PubMed.
- B. Kowalewska and K. Jakubow, Sens. Actuators, B, 2017, 238, 852–861 CrossRef CAS.
- M. Moumene, D. Rochefort and M. Mohamedi, Int. J. Electrochem. Sci., 2013, 8, 2009–2022 CAS.
- H.-Z. Zhao, J.-J. Sun, J. Song and Q.-Z. Yang, Carbon, 2010, 48, 1508–1514 CrossRef CAS.
- J. Li, H. T. Ng, A. Cassell, W. Fan, H. Chen, Q. Ye, J. Koehne, J. Han and M. Meyyappan, Nano Lett., 2003, 3, 597–602 CrossRef CAS.
- Y. Wang, Y. Shao, D. W. Matson, J. Li and Y. Lin, ACS Nano, 2010, 4, 1790–1798 CrossRef CAS PubMed.
- J.-W. Shen, T. Wu, Q. Wang and Y. Kang, Biomaterials, 2008, 29, 3847–3855 CrossRef CAS PubMed.
- S. Wang, E. S. Humphreys, S.-Y. Chung, D. F. Delduco, S. R. Lustig, H. Wang, K. N. Parker, N. W. Rizzo, S. Subramoney, Y.-M. Chiang and A. Jagota, Nat. Mater., 2003, 2, 196–200 CrossRef CAS PubMed.
- D. Lozano-Castelló, F. Suárez-García, D. Cazorla-Amorós and Á. Linares-Solano, in Carbons for Electrochemical Energy Storage and Conversion Systems, ed. F. Béguin and E. Frackowiak, CRC Press Taylor & Francis Group, Boca Raton, 2009, pp. 115–162 Search PubMed.
- F. López-Gallego, L. Betancor, C. Mateo, A. Hidalgo, N. Alonso-Morales, G. Dellamora-Ortiz, J. M. Guisán and R. Fernández-Lafuente, J. Biotechnol., 2005, 119, 70–75 CrossRef PubMed.
- M. J. Bleda-Martínez, J. A. Maciá-Agulló, D. Lozano-Castelló, E. Morallón, D. Cazorla-Amorós and A. Linares-Solano, Carbon, 2005, 43, 2677–2684 CrossRef.
- C. González-Gaitán, R. Ruiz-Rosas, E. Morallón and D. Cazorla-Amorós, Int. J. Hydrogen Energy, 2015, 40, 11242–11253 CrossRef.
- A. T. E. Vilian and S.-M. Chen, RSC Adv., 2014, 4, 50771–50781 RSC.
- A. Guiseppi-Elie, C. Lei and R. H. Baughman, Nanotechnology, 2002, 13, 559–564 CrossRef CAS.
- A. Seehuber and R. Dahint, J. Phys. Chem. B, 2013, 117, 6980–6989 CrossRef CAS PubMed.
- R. Vazquez-Duhalt, S. A. Aguila, A. A. Arrocha and M. Ayala, ChemElectroChem, 2014, 1, 496–513 CrossRef.
- M. D. Rubianes and G. A. Rivas, Electrochem. Commun., 2003, 5, 689–694 CrossRef CAS.
- M. Zhou, Y. Zhai and S. Dong, Anal. Chem., 2009, 81, 5603–5613 CrossRef CAS PubMed.
- J. Zhang, M. Feng and H. Tachikawa, Biosens. Bioelectron., 2007, 22, 3036–3041 CrossRef CAS PubMed.
- D. Ivnitski, K. Artyushkova, R. A. Rincón, P. Atanassov, H. R. Luckarift and G. R. Johnson, Small, 2008, 4, 357–364 CrossRef CAS PubMed.
- X. Kang, J. Wang, H. Wu, I. A. Aksay, J. Liu and Y. Lin, Biosens. Bioelectron., 2009, 25, 901–905 CrossRef CAS PubMed.
- Y. Watanabe and H. Miyagi, Jpn. J. Clin. Chem., 1986, 15, 75–79 CAS.
- V. K. L. Shanbhag and K. S. Prasad, Anal. Methods, 2016, 8, 6255–6259 RSC.
- M. Yamaguchi, M. Mitsumori and Y. Kano, IEEE Engineering in Medicine and Biology Magazine, 1998, 17, 59–63 CrossRef CAS PubMed.
- A. Heller and B. Feldman, Chem. Rev., 2008, 108, 2482–2505 CrossRef CAS PubMed.
Footnote |
| † Electronic supplementary information (ESI) available. See DOI: 10.1039/c7ra02380d |
| This journal is © The Royal Society of Chemistry 2017 |