 Open Access Article
A two-in-one device for online monitoring of direct immersion single-drop microextraction: an optical probe as both microdrop holder and measuring cell†
Serhii
Zaruba
 *a,
Andriy B.
Vishnikin
 a,
Jana
Škrlíková
 b,
Alina
Diuzheva
 b,
Ivana
Ozimaničová
b,
Kiril
Gavazov
b,
Ivana
Ozimaničová
b,
Kiril
Gavazov
 cd and
Vasil
Andruch
 b
b
aDepartment of Analytical Chemistry, Faculty of Chemistry, Oles Honchar Dnipropetrovsk National University, Dnipro, UA-49010, Ukraine. E-mail: zaruba.sv@gmail.com
bDepartment of Analytical Chemistry, Faculty of Science, Pavol Jozef Šafárik University in Košice, SK-04154 Košice, Slovak Republic
cFaculty of Chemistry, University of Plovdiv Paisii Hilendarski, Plovdiv 4000, Bulgaria
dFaculty of Pharmacy, Medical University of Plovdiv, Plovdiv 4002, Bulgaria
First published on 6th June 2017
Abstract
For the first time an optical probe is proposed as the microdrop holder and simultaneously the measuring cell in a direct immersion single-drop microextraction (DI-SDME) procedure. This approach enables the analytical signal (absorbance of organic phase) to be monitored and recorded online during the extraction process. Based on the suggested approach, a novel on-probe DI-SDME method for the determination of thiocyanate ions using the extraction of the ion pair formed between SCN− and Astra Phloxine reagent in acidic medium into 40 µL of amyl acetate is suggested. The final experimental conditions were found to be: the pH of the aqueous phase being 3, the stirring rate at 500 rpm, a 150 s extraction time, the absorption maximum at 555 nm and 700 nm as the reference wavelength. The calibration plot was linear in the range of 0.29–4.35 mg L−1 of SCN−, with a correlation coefficient of 0.9981. The limit of detection (LOD) was found to be 0.12 mg L−1. The method was applied for analysis of human saliva samples. Furthermore, the possibility of using the optical probe not only for DI-SDME but also for liquid–liquid–liquid microextraction (LLLME) and reverse mode microextraction techniques is shown in separate experiments.
Introduction
The present period is characterized by considerable developments in analytical chemistry, with the introduction of new procedures for sample preparation as well as procedures for the separation of analytes. At the same time there has been rapid development in analytical instrumentation. Manufacturers are constantly looking to improve devices in order to offer analytical chemists new possibilities. Hand in hand with that, analytical chemists are developing new procedures using the new analytical equipment.Several articles published at the end of the last century pointed out the potential of a microdrop for analytical purposes, and this initiated the development of microextraction techniques.1–7 Various microextraction techniques and modalities exist, including hollow fiber liquid phase microextraction (HF-LPME),8 homogeneous liquid–liquid extraction (HLLE),9,10 single-drop microextraction (SDME),11–14 dispersive liquid–liquid microextraction (DLLME),10,15 solidification of floating organic drop microextraction (SFODME),16 ultrasound-assisted emulsification microextraction (USAEME)17,18 and vortex-assisted liquid–liquid microextraction (VALLME).18,19
The SDME technique is mainly coupled with gas chromatography (GC) and high-performance liquid chromatography (HPLC). Only a handful of papers have been devoted to SDME procedures followed by UV-Vis spectrophotometric detection,13 such as enzymatic SDME of ethanol in alcohol-free cosmetics20 and directly suspended droplet microextraction of phosphate.21 The limitations of the technical solutions allowing absorbance measurements in microvolumes have been previously discussed.22 Very recently, we demonstrated the applicability of the optical probe as a microdrop holder in headspace single drop microextraction (HS-SDME).23 The usefulness of the recently developed approach was presented for sulfite determination in food samples. The method based on sulfite conversion to volatile sulfur dioxide followed by absorption into a drop of an aqueous mixed reagent solution placed on the optical probe tip, and online measuring of the absorbance of the formed colored complex. We have shown benefit of similar approach, which lies in the fact that the handling of a drop between extraction and detection steps is avoided. However, when we tried to adopt a similar approach for the DI mode, we encountered several of significant complications arising from the fact the microdrop should be under the surface of the aqueous phase.
Therefore, the goals of this work were to show the possibility of using an optical probe as the microdrop holder in DI-SDME. The usefulness of the proposed approach was demonstrated for thiocyanate determination in saliva samples. Thiocyanate was selected as the model analyte due to its potential as a marker of periodontal diseases and the presence of cyanide in the body and as an indicator that a person is a smoker.24–27 Moreover, the possibility of implementing the optical probe in liquid–liquid–liquid microextraction (LLLME) and reverse phase SDME was also shown and discussed.
Experimental
Reagents
All chemicals and solvents used were of analytical reagent grade. Double-distilled water was used throughout the work. A 0.05 mol L−1 thiocyanate stock solution was prepared by dissolving 380.6 mg of NH4SCN in 100 mL of water. The working solutions were prepared daily by appropriate dilution of the stock solution with water. A 1 mmol L−1 solution of Astra Phloxine (AP) was prepared by dissolving 78.5 mg of reagent in a small volume of ethanol and filling up with water to 200 mL. A 0.02 mol L−1 solution of HCl was prepared by dilution of concentrated acid.Apparatus
A USB 4000 fiber optic spectrometer equipped with an LS-1 tungsten halogen light source (both Ocean Optics, USA) and with a double pass optical probe of 10 mm path length (Expedeon, UK) was used for absorbance measurements. The optical probe consists of a chemical resistant stainless steel tube (with diameter 3.17 mm) with an ‘optical part’ on one side and optical fibers on the other side. The optical part (Fig. 1) is a rectangular hole 5 mm in length. The hole is bordered by optical windows. One optical fiber is connected to the radiation source, and a second fiber is connected to the spectrophotometer. Data acquisition was performed using the OceanView spectroscopy software and FIAlab® software. A magnetic stirrer with an RH digital heating model (IKA®-Werke GmbH & Co. KG, Germany) and a 12 × 2 mm stirring bar was used to stir the solutions. An ORION 720A+ pH meter (Thermo Scientific, Beverly, USA) with a glass electrode was used to measure the pH values of the solutions.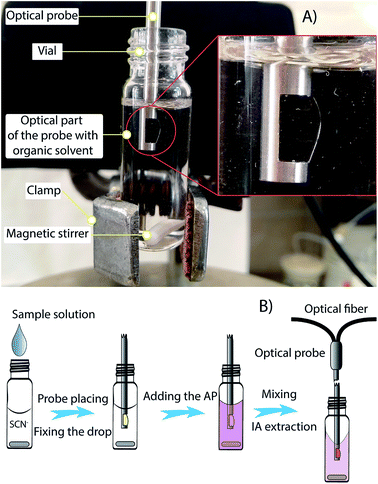 | ||
| Fig. 1 Scheme of the on-probe DI-SDME procedure: (A) view of the system for the on-probe DI-SDME technique; (B) procedure for SCN− determination (magnetic stirrer not shown). | ||
Conventional DI-SDME procedure
A conventional single-drop microextraction method, where a syringe needle was used as the microdrop holder for determination of SCN− was also suggested. The procedure is based on the same reaction chemistry as the on-probe DI-SDME procedure. All key parameters of the on-needle DI-SDME procedure, such as the stirring rate, extraction time and volume of organic solvent, were studied.A 3.25 mL volume of standard solution containing from 0.45 to 2.2 mg L−1 of thiocyanate, 0.55 mL of 1 mmol L−1 AP and 200 µL of 0.02 mmol L−1 HCl were placed into a glass vial containing a magnetic stir bar. Afterwards, the vial was placed on a magnetic stirrer. Then the needle of a syringe containing amyl acetate was immersed into the sample solution, and the needle tip was fixed nearly 1 cm below the surface of the aqueous phase. The plunger was depressed and a solvent microdrop formed at the end of the microsyringe needle. The magnetic stirrer was then turned on, and the extraction was carried out. The stirring rate of 150 rpm, extraction time of 10 min, and amyl acetate microdrop volume of 7 µL were selected as optimum extraction conditions. Extraction at a stirring rate of 300 rpm and higher was difficult due to frequent drop displacement. More than 8 µL microdrop volume of amyl acetate could not be used, because the amyl acetate drop was torn off by the stream of sample solution; on the other hand volumes less than 4 µL were not enough to fill the microvolume cell.
On probe DI-SDME procedure
A 3.25 mL volume of standard solution or sample solution containing from 0.36 to 5.4 mg L−1 of thiocyanate was placed into a 4 mL vial (without a septum) and containing a 12 × 2 mm stirrer bar. Next, 200 µL of 0.02 M HCl was added. The vial was held with a stand and clamp, and the optical probe was directly immersed into the analyzed solution; thus, the probe tip was 2–3 mm below the surface of the aqueous phase. The air residues adhering to the probe were removed by gently shaking it. Next, the needle of a Hamilton syringe with 40 µL of amyl acetate was immersed under the water surface such that the point of the needle touched the lower window of the optical probe. The syringe plunger was slowly pressed and a microdrop of organic solvent was formed (see ESI: Video 1†), so that the optical part of the probe was completely filled, and the magnetic stirrer was turned on (500 rpm, at ambient temperature). The absorbance measurement at 555 nm wavelength (700 nm as the reference wavelength) was begun and continued throughout the whole extraction process. After 7.5–10 seconds, 550 µL of 1 mmol L−1 Astra Phloxine began to be added, quickly but carefully (so as do not disrupt the drop). After 150 s extraction time, the absorbance value was read out. The optical part of the probe was cleaned with ethanol after each measurement and then thoroughly rinsed with distilled water. Thereafter the probe was dried with filter paper. The scheme of the procedure and its performing is shown in Fig. 1 and Video 1, respectively (see ESI†).Sample preparation
About 2 g of human saliva samples were collected in previously weighed conical plastic tubes from healthy volunteers before the lunchtime (informed consent was obtained from human subjects). Afterwards, the sample was diluted to 10 mL with water, mixed thoroughly and centrifuged for 10 minutes at 5000 rpm. The clear supernatant solution was collected and an appropriate aliquot was subjected to the DI-SDME procedure.Results and discussion
The developed method is based on the formation of the ion associate of SCN− with AP in an acidic medium (pH 3)28 and its on probe direct immersion single-drop microextraction into a microdrop of organic solvent placed on the hole of the optical probe tip. Since the effect of the HCl and dye reagent concentrations have been previously investigated,28 this work will further address only the extraction itself, such as the effect of extraction time, stirring rate as well as the type of organic solvent and volume of the microdrop. Water standard solutions were used for these purposes.Effect of extraction time
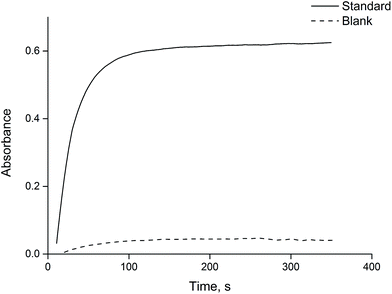
In general, analyte transfer into the solvent drop is a time-dependent process.29 Therefore, the effect of extraction time, ranging from 0 to 350 s, was evaluated. As seen from Fig. 2, the absorbance increases sharply to 90 s and then does not significantly change. However, to obtain more sustainable results in further experiments, extraction was carried out for 150 s after adding the dye reagent.Effect of stirring rate
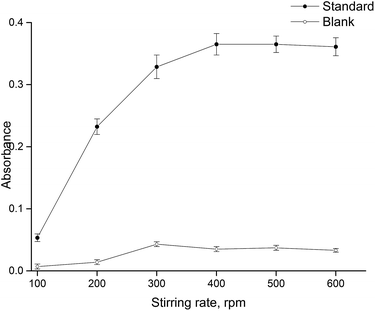
Sample agitation leads to an increase in extraction efficiency and consequently to reducing the extraction time as a result of better mass transfer in aqueous phase and thus faster establishment of equilibrium between the aqueous and the organic phases. The effect of the stirring rate was investigated ranging from 100 to 600 rpm. Higher stirring rates were not evaluated due to the probability of microdrop dislodgement. The experimental results (Fig. 3) show that absorbance increases as the stirring rate increases up to 400 rpm, and then the effectiveness of mass transfer does not significantly change, and the absorbance remains virtually unchanged. Thus, further experiments were performed with a stirring rate of 500 rpm.Effect of organic solvent type and volume
The detailed effect of the type of organic solvent on extraction efficiency of the AP-SCN ion associate was investigated in a previous work28 and amyl acetate was found to have a better signal-to-noise ratio value. Therefore, amyl acetate was chosen as the optimal extraction agent.In comparison with our previous work, in which HS-SDME was reported,23 the fixing of the extraction phase in DI-SDME has a particular feature: the organic solvents should be fixed on the probe after immersion of the optical probe into the sample solution (Video 1†); otherwise the organic solvent will spread away from the optical probe tip, due to its low surface tension in comparison with water solvents (surface tension of 72 and 25.8 dyn cm−1 for water and amyl acetate, respectively).
The effect of amyl acetate volume was studied in the range of 30–70 µL. The drop shapes of different volumes of amyl acetate are shown in Fig. 4. With volumes less than 30 µL, it is too difficult to fix the microdrop, as it has a great tendency to break away from the open tip of the probe. Volumes equal to and higher than 70 µL are too large; the microdrop begins to break away from the probe during the extraction at stirring conditions. Therefore, a volume of 40 µL was chosen for further experiments.
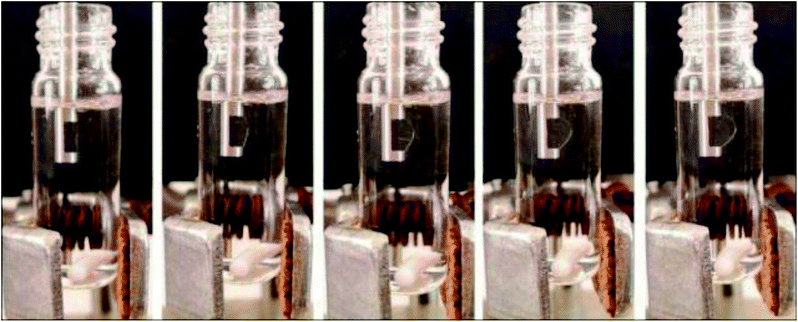 | ||
| Fig. 4 Effect of organic solvent drop volume. Aqueous phase volume, 3.45 mL; amyl acetate microdrop volume (from left to right): 30, 40, 50, 60 and 70 µL. | ||
Restrictions on organic solvents
A study of the effect of the type of organic solvent on extraction efficiency is an important step during the development of extraction procedures. The organic solvent should satisfy a few basic requirements for all extraction methods: it should be immiscible with water; it should be as safe as possible for the researcher and the environment; it should have good extraction efficiency for the target analytes, etc. But in regard to extraction with an optical probe, the extraction solvent should be easily fixed on the probe hole, i.e. it should have a good wettability for the probe material (especially to the windows of the optical probe), and it should remain stable on the probe during the extraction procedure.In this study, based on previous experience,28 amyl acetate was employed as the extraction solvent. However, it was interesting to try other solvents that otherwise would be suitable or which are not suitable for the on-probe DI-SDME technique. Therefore, the possibility of fixing several other organic solvents commonly used in microextraction techniques – those lighter than water (amyl acetate, benzene, toluene, hexane, octanol, decanol and undecanol) and those heavier than water (chloroform and dichloroethane) – on an optical probe tip was checked. Amyl acetate, toluene, benzene, hexane, chloroform and dichloroethane were successfully fixed as a microdrop on the probe. On the other hand, drops of octanol, decanol and undecanol could not be successfully placed on the optical probe. Accordingly, amyl acetate, toluene, benzene, hexane, carbon tetrachloride and dichloroethane can be used in optical probe DI-SDME for developing further extraction procedures.
Drop stability of selected organic solvents was also tested under various stirring conditions. The bar graph (Fig. 5) shows the percentage of resisted drops (drops that maintain their position on the probe after 150 s of stirring) at a certain stirring rate. The experiments were carried out 10 times for amyl acetate and 5 times for other solvents. According to the results obtained, hexane, benzene and toluene have better resistance to stirring than amyl acetate. Therefore, these solvents can be recommended to develop on-probe DI-SDME procedures with increased stirring rates, which allow accelerating the mass transfer of the target analytes into the organic phase and consequently decreasing the extraction time.
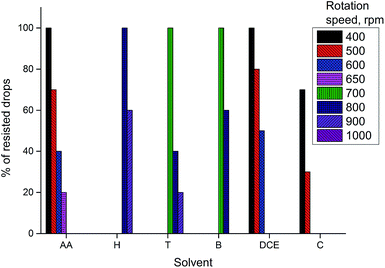 | ||
| Fig. 5 The influence of the organic solvent type. Conditions: volume of the organic solvent, 40 µL; AA, amyl acetate; H, hexane; T, toluene; B, benzene; DCE, dichloroethane, C, chloroform. | ||
Analytical figures of merit
Under the optimized experimental conditions, a calibration plot was constructed from seven data points over the range from 0.29 to 4.35 mg L−1. The regression equation was A = (0.171 ± 0.003)C + (0.014 ± 0.007) (where A means the absorbance and C the concentration of SCN− in mg L−1) and with a correlation coefficient of 0.9981, proving a good linear relationship between absorbance and the thiocyanate concentration. The LOD, calculated as three times the standard deviation of the blank test, was found to be 0.12 mg L−1. The precision and accuracy of the suggested method were checked by performing five extractions of spiked samples at two concentration levels (0.36 and 3.99 mg L−1 SCN−) over two consecutive days. The results are shown in Table 1.| SCN− added, mg L−1 | Intra-day | Inter-day | ||||
|---|---|---|---|---|---|---|
| Found, mg L−1 | RSD, % | R, % | Found, mg L−1 | RSD, % | R, % | |
| 0.36 | 0.37 ± 0.02 | 6.1 | 103 | 0.37 ± 0.02 | 4.8 | 101 |
| 3.99 | 3.93 ± 0.13 | 2.7 | 98.5 | 3.99 ± 0.06 | 1.2 | 100 |
View to the future. Applicability of the optical probe for other microextraction techniques
The applicability of the optical probe for reverse mode (an oily donor phase and an aqueous acceptor phase) and LLLME techniques was also tested. However, only the technical possibility of carrying out these modes of microextraction was checked, i.e. without samples or analytes.Reverse mode was checked with a 3.5 mL sunflower oil sample placed in a glass vial. A 30 µL aliquot of aqueous acceptor phase was placed and fixed on the optical probe tip and subsequently immersed directly into the oil sample. Three types of water drop were investigated: an acidic drop with a pH of nearly 1.7 (adjusted using HCl), a basic drop with a pH of 8.5 (an acetate buffer solution), and distilled water. All drop types successfully held on to probe in the oil phase even at a rotational speed of 2000 rpm. It should be noted that the optical probe containing the aqueous drop can be immersed into oil directly from air, i.e. without the need to place the drop on the probe tip below the surface of the sample.
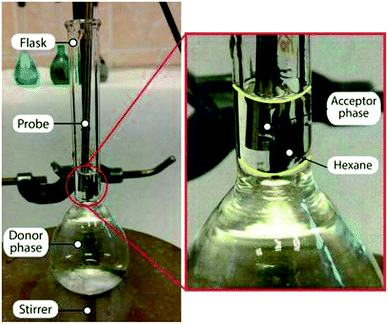
The possibility of using an optical probe for liquid–liquid–liquid microextraction was also checked. The scheme of this experiment is depicted in Fig. 6. A 25 mL volumetric flask with a magnetic stir bar was filled with water (donor phase) up to the start of the narrow part of the neck (nearly 23 mL). Then 400 µL of organic phase was carefully placed on the donor phase using a 500 µL microsyringe. Afterwards, the optical probe with the fixed drop of acceptor phase was gently immersed into the organic solvent. The magnetic stirrer was turned on, and stirring began at 1500 rpm.
Toluene, hexane and benzene were tested as the organic solvent, and as in the previous case, three types of the water drop were checked. The best results (better drop stability) were obtained with toluene and hexane independently of the content of the acceptor phase.
This section merely indicates possible options for further use of the optical probe in microextraction techniques. Detailed research on this issue is beyond the scope of this paper. However, work on this subject matter is on-going, and new results can be anticipated in the near future.
Analytical application
To evaluate the efficiency of the method, the method was applied for determination of thiocyanate in non-smoker and smoker saliva samples. The samples were pretreated according to the procedure described in the section ‘Sample preparation’. The determination was performed by the method of standard addition. The obtained results are shown in Table 2.| Samplea | Added, mg kg−1 | Found, mg kg−1 | R, % |
|---|---|---|---|
| a Gender (female or male)/age/smoker (s), non-smoker (ns); ex-s, ex-smoker. | |||
| F/24/ns | — | 155 ± 24 | — |
| 226 | 367 ± 20 | 93.8 | |
| M/26/ns | — | 75.1 ± 3.6 | — |
| 36.3 | 111 ± 5 | 99.9 | |
| F/26/ns | — | 69.4 ± 14.8 | — |
| 116 | 192 ± 9 | 106 | |
| F/27/ns | — | 94.8 ± 10.8 | — |
| 132 | 234 ± 60 | 105 | |
| M/23/ns | — | 119 ± 18 | — |
| 130 | 244 ± 87 | 94.7 | |
| F/20/s | — | 265 ± 37 | — |
| 66 | 330 ± 52 | 98.5 | |
| F/21/ex-s | — | 135 ± 26 | — |
| 145 | 287 ± 25 | 105 | |
Comparison of the developed method with existing methods
Various methods have been reported for thiocyanate determination, including spectrophotometric,30,31 ion chromatographic,32 extractive spectrophotometric,33 sequential injection28 and flow injection34–36 systems. Potentiometric sensors with different membranes37,38 as well as optical39,40 and colorimetric41 sensors have also been reported. However, the number of microextraction methods is limited. Selected extraction methods are compared in Table 3.| Method | Detection device | Linearity, mg L−1 | LOD, mg L−1 | Solvent, volume | Ref. |
|---|---|---|---|---|---|
| a SIA, sequential injection analysis. | |||||
| USAEME | 100 µL micro-quartz cell | 0.04–0.8 | 0.005 | Chloroform, 180 µL | 42 |
| DLLME | Matched cell of 1 mm path length | 3.1–28.2 | 0.11 | 500 µL amyl acetate, tetrachloromethane and acetonitrile, 1![[thin space (1/6-em)]](https://www.rsc.org/images/entities/char_2009.gif) : :![[thin space (1/6-em)]](https://www.rsc.org/images/entities/char_2009.gif) 1 1![[thin space (1/6-em)]](https://www.rsc.org/images/entities/char_2009.gif) : :![[thin space (1/6-em)]](https://www.rsc.org/images/entities/char_2009.gif) 1.5 (v/v/v) 1.5 (v/v/v) |
28 |
| SIA | Flow cell | 2.9–29 | 1.16 | Amyl acetate, 350 µL | 43 |
| Optical sensor | Optode | 2–50 | 0.9 | — | 39 |
| Optical sensor | Desktop scanner | 15–1160 | 3.5 | — | 40 |
| Optical sensor | Cell | 0.01–0.1 | 0.008 | — | 41 |
| Conventional DI-SDME | Micro-quartz cell | 0.36–1.82 | 0.10 | Amyl acetate, 8 µL | This work for comparison |
| On probe DI-SDME | Optical probe | 0.29–4.35 | 0.12 | Amyl acetate, 40 µL | This work |
The developed method has a comparable limit of detection (with the exception of one study42) and requires less volume of organic solvent (180 µL of chloroform;42 500 µL of mixture of amyl acetate, tetrachloromethane and acetonitrile28 and 350 µL of amyl acetate43). Therefore, the developed method is more environmentally friendly and cheaper. Moreover, phase separation28,42,43 and transfer of the extraction phase to a microvolume cell are excluded. As a consequence, the method can be considered as simpler and less time consuming. Methods based on optical40,41 sensors do not use organic solvents and have a wider linear range40 or lower LOD.41 However, these methods are more time consuming; they require handmade preparation of paper-based analytical devices40 or the synthesis of fluorescent carbon dots and gold nanoparticles.41 This makes such methods labor-intensive and requires specific skills from the chemical analyst, such us manual skills or skills in inorganic synthesis.
A comparison of conventional and on-probe DI-SDME shows that linearity and LOD are very close for both approaches (Table 3). However, the on-probe method allows the stirring rate to be increased up to 500 rpm, which leads to 4-fold reduction in the extraction time. Moreover, this approach avoids the handling of the drop between the extraction and detection steps, thus allowing for online analytical signal acquisition.
Conclusion and future research
For the first time, an optical probe is proposed as the holder of the extraction drop and the measuring cell in a direct immersion single-drop microextraction. In the proposed DI-SDME scheme the necessity of transferring the extraction phase to a microcuvette28,42 or the pedestal of a cuvetteless spectrophotometer as well as dispensing to a flow cell28,43 for absorbance measurement is eliminated. This makes the analysis simpler and less time-consuming and allows the absorbance to be recorded online. Moreover, in comparison with the conventional DI-SDME mode, the optical probe allows the stirring rate of the sample solution to be increased and consequently the extraction time to decrease without risk of displacement and losing the drop. An additional benefit is that the setup does not include any homemade and uncommon components and devices. The method was successfully applied for the determination of thiocyanate in human saliva samples.Furthermore, the possibility of using the optical probe not only for DI-SDME but also for LLLME and reverse mode microextraction techniques is also outlined. This indicates that using an optical drop as a microdrop holder has a wide field of applicability; it has potential in the development of new microextractions methods, both manually performed and automated, for example, using various flow-injection or sequential-injections instruments.
Acknowledgements
This work was supported by the Scientific Grant Agency of the Ministry of Education, Science, Research and Sport of the Slovak Republic (grant no. VEGA 1/0010/15), by the Slovak Research and Development Agency (SRDA) (grant no. APVV SK-BG-2013-0003) and by the Bulgarian Science Fund (grant DNTS/Slovakia 01/7). Serhii Zaruba would like to thank to International Visegrad Fund for providing a ten-month scholarship.Notes and references
- H. Liu and P. K. Dasgupta, Anal. Chem., 1995, 67, 4221–4228 CrossRef CAS.
- H. Liu and P. K. Dasgupta, TrAC, Trends Anal. Chem., 1996, 15, 468–475 CrossRef CAS.
- H. Liu and P. K. Dasgupta, Anal. Chim. Acta, 1996, 326, 13–22 CrossRef CAS.
- H. Liu and P. K. Dasgupta, Microchem. J., 1997, 57, 127–136 CrossRef CAS.
- S. Liu and P. K. Dasgupta, Anal. Chem., 1995, 67, 2042–2049 CrossRef CAS.
- M. A. Jeannot and F. F. Cantwell, Anal. Chem., 1997, 69, 235–239 CrossRef CAS.
- M. A. Jeannot and F. F. Cantwell, Anal. Chem., 1996, 68, 2236–2240 CrossRef CAS PubMed.
- K. E. Rasmussen, S. Pedersen-Bjergaard, M. Krogh, H. G. Ugland and T. Grønhaug, J. Chromatogr. A, 2000, 873, 3–11 CrossRef CAS PubMed.
- K. Murata, Y. Yokoyama and S. Ikeda, Anal. Chem., 1972, 44, 805–810 CrossRef CAS PubMed.
- A. N. Anthemidis and K.-I. G. Ioannou, Talanta, 2009, 80, 413–421 CrossRef CAS PubMed.
- A. Tankeviciute, R. Kazlauskas and V. Vickackaite, Analyst, 2001, 126, 1674–1677 RSC.
- A. Przyjazny and J. M. Kokosa, J. Chromatogr. A, 2002, 977, 143–153 CrossRef CAS PubMed.
- L. Kocúrová, I. S. Balogh and V. Andruch, J. Sep. Sci., 2013, 36, 3758–3768 CrossRef PubMed.
- J. M. Kokosa, TrAC, Trends Anal. Chem., 2015, 71, 194–204 CrossRef CAS.
- S. Berijani, Y. Assadi, M. Anbia, M.-R. M. Hosseini and E. Aghaee, J. Chromatogr. A, 2006, 1123, 1–9 CrossRef CAS PubMed.
- M. R. K. Zanjani, Y. Yamini, S. Shariati and J. Å. Jönsson, Anal. Chim. Acta, 2007, 585, 286–293 CrossRef PubMed.
- J. Regueiro, M. Llompart, C. Garcia-Jares, J. C. Garcia-Monteagudo and R. Cela, J. Chromatogr. A, 2008, 1190, 27–38 CrossRef CAS PubMed.
- V. Andruch, M. Burdel, L. Kocúrová, J. Šandrejová and I. S. Balogh, TrAC, Trends Anal. Chem., 2013, 49, 1–19 CrossRef CAS.
- E. Yiantzi, E. Psillakis, K. Tyrovola and N. Kalogerakis, Talanta, 2010, 80, 2057–2062 CrossRef CAS PubMed.
- N. Cabaleiro, I. de la Calle, C. Bendicho and I. Lavilla, Anal. Chim. Acta, 2012, 733, 28–33 CrossRef CAS PubMed.
- F. Pena-Pereira, N. Cabaleiro, I. de la Calle, M. Costas, S. Gil, I. Lavilla and C. Bendicho, Talanta, 2011, 85, 1100–1104 CrossRef CAS PubMed.
- V. Andruch, L. Kocúrová, I. S. Balogh and J. Škrlíková, Microchem. J., 2012, 102, 1–10 CrossRef CAS.
- S. Zaruba, A. B. Vishnikin, J. Škrlíková and V. Andruch, Anal. Chem., 2016, 88, 10296–10300 CrossRef CAS PubMed.
- E. Kaufman and I. B. Lamster, J. Clin. Periodontol., 2000, 27, 453–465 CAS.
- M. Valdés and M. Díaz-García, Crit. Rev. Anal. Chem., 2004, 34, 9–23 CrossRef.
- J. C. Dacre and I. R. Tabershaw, Arch. Environ. Occup. Health, 1970, 21, 47–49 CrossRef CAS.
- K. Tsuge, M. Kataoka and Y. Seto, J. Health Sci., 2000, 46, 343–350 CrossRef CAS.
- V. Andruch, C. C. Acebal, J. Škrlíková, H. Sklenářová, P. Solich, I. S. Balogh, F. Billes and L. Kocúrová, Microchem. J., 2012, 100, 77–82 CrossRef CAS.
- A. Jain and K. K. Verma, Anal. Chim. Acta, 2011, 706, 37–65 CrossRef CAS PubMed.
- A. R. Pettigrew and G. S. Fell, Clin. Chem., 1972, 18, 996–1000 CAS.
- A. B. Bendtsen and E. H. Hansen, Analyst, 1991, 116, 647 RSC.
- Y. Michigami, K. Fujii, K. Ueda and Y. Yamamoto, Analyst, 1992, 117, 1855 RSC.
- M. Tsubouchi, Anal. Chim. Acta, 1971, 54, 143–148 CrossRef CAS.
- D. L. Recalde-Ruiz, E. Andrés-García and M. E. Díaz-García, Anal. Lett., 2000, 33, 1603–1614 CrossRef CAS.
- S. S. M. Hassan, W. H. Mohmoud, A.-S. S. H. Elgazwy and N. M. Badawy, Electroanalysis, 2006, 18, 2070–2078 CrossRef CAS.
- S. S. Beheshti, F. Sohbat and M. K. Amini, J. Porphyrins Phthalocyanines, 2010, 14, 158–165 CrossRef CAS.
- A. K. Singh, U. P. Singh, S. Mehtab and V. Aggarwal, Sens. Actuators, B, 2007, 125, 453–461 CrossRef CAS.
- S. S. M. Hassan, M. H. A. Ghalia, A.-G. E. Amr and A. H. K. Mohamed, Anal. Chim. Acta, 2003, 482, 9–18 CrossRef CAS.
- S. Rastegarzadeh and Z. Moradpour, Anal. Lett., 2007, 40, 2993–3001 CrossRef CAS.
- F. Pena-Pereira, I. Lavilla and C. Bendicho, Talanta, 2016, 147, 390–396 CrossRef CAS PubMed.
- D. Zhao, C. Chen, L. Lu, F. Yang and X. Yang, Analyst, 2015, 140, 8157–8164 RSC.
- M. Hashemi, S. M. Daryanavard and S. Abdolhosseini, J. Chromatogr. B: Anal. Technol. Biomed. Life Sci., 2013, 917–918, 5–10 CrossRef CAS PubMed.
- C. C. Acebal, H. Sklenářová, J. Škrlíková, I. Šrámková, V. Andruch, I. S. Balogh and P. Solich, Talanta, 2012, 96, 107–112 CrossRef CAS PubMed.
Footnote |
| † Electronic supplementary information (ESI) available: Video 1 visualization of using an optical probe as the microdrop holder in DI-SDME. See DOI: 10.1039/c7ra02326j |
| This journal is © The Royal Society of Chemistry 2017 |

