DOI:
10.1039/C7RA02192E
(Paper)
RSC Adv., 2017,
7, 23961-23969
Corrosion control of mild steel in 0.1 M H2SO4 solution by benzimidazole and its derivatives: an experimental and theoretical study†
Received
22nd February 2017
, Accepted 28th April 2017
First published on 3rd May 2017
Abstract
The corrosion inhibition performances of four imidazolium-based corrosion inhibitors on mild steel in acidic medium, namely benzimidazole (BI), 2-aminobenzimidazole (ABI), 2-phenylbenzimidazole (PBI), and omeprazole (OP) were investigated in this work. The experimental results confirmed by electrochemical measurements and a scanning electron microscopy study show that OP may exhibit the best inhibitive performance among the four compounds for mild steel in sulfuric acid solution. Furthermore, quantum chemical calculations of density function theory (DFT) and molecular dynamics (MD) simulations were applied to theoretically determine the relationship between molecular structure and inhibition efficiency. OP shows the highest reaction activity among the four molecules. The binding energies of the corrosion inhibitor molecules and iron surface follow the order of OP > PBI > ABI > BI, which agrees well with the experimental findings.
1. Introduction
As the most important structural material, carbon steel is applied to almost the whole industrial domain due to its excellent properties. However, the corrosion of steel usually results in huge financial losses and many potential safety issues, and anticorrosion technology has aroused the great interest of researchers.1–3 Due to their economy and convenience, chemical inhibitors play an important role in protection and retarding corrosion.4–6 It is generally accepted that inhibitors act via their functional groups adsorbing on the metal surface, which contain either lone pair-donating heteroatoms (N, O, S) or π-bonds, changing the corrosion resistance properties of the metal.7–9
Imidazole compounds are well known steel corrosion inhibitors as can be concluded from numerous papers published so far.10–13 The researchers reported that the inhibiting effect depends on some physicochemical and electronic properties of the organic compound molecule which related to its functional groups, steric effects, the orbital character of donating electrons. However, in this regard, the effects of the molecular structure on the chemical reactivity have become burning issues for researchers.
In this work, we utilize electrochemical approach and other experimental methods to investigate the inhibiting performances of BI, ABI, PBI, and OP (see Fig. 1). To further clarify the anticorrosive mechanism, MD and DFT methods are employed to discuss the adsorption configuration, adsorption energy, quantum chemical descriptors, etc. Therefore, the aim of the present study is to build a system of 2-substituted benzimidazole inhibitors and compare their inhibition abilities. Combined with experiment results, the inhibiting mechanism revealed at molecular-level of the surface adsorption, and the key factors controlling inhibiting efficiency will be found. Therefore, this study would provide the experimental and theoretical basis to develop novel high efficient organic corrosion inhibitors.
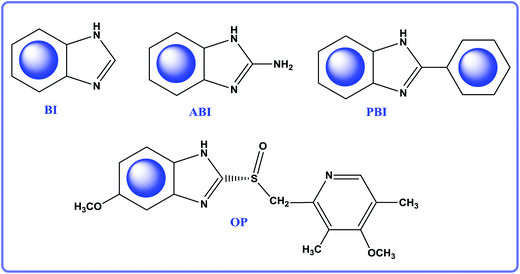 |
| | Fig. 1 The molecular structure of BI, ABI, PBI and OP. | |
2. Experimental details
2.1. Materials and sample preparation
The working electrode used in this experiment is mild steel Q235 (chemical composition: 0.17% C, 0.47% Mn, 0.26% Si, 0.017% S, 0.0048% P and the remainder iron), which was mechanically cut into 3.0 cm × 2.0 cm × 1.0 cm dimensions (a cuboid) for weight loss measurement, and 1.0 cm × 1.0 cm × 1.0 cm dimensions (a cube) for SEM measurement and electrochemical measurements. For electrochemical tests, the specimens were imbedded in epoxy resin with a surface area of 1.00 cm2 exposed to the corrosive medium. The surfaces of all the specimens were abraded with SiC paper of 400, 800, 1000, and 1200 grades, washed thoroughly with distill water, degreased ultrasonically in acetone and finally dried.
2.2. Electrochemical measurements
The electrochemical experiments were performed in a classical three-electrode cell assembly with Q235 specimen as the working electrode, platinum foil of 1.5 cm × 1.5 cm as the counter electrode, and a saturated calomel electrode (SCE) provided with a Luggin capillary as the reference electrode. All potentials were referred to SCE reference electrode. Electrochemical impedance spectroscopy (EIS) measurements were carried out at the open circuit potential (EOCP). The ac frequency range extended from 100 kHz to 10 mHz with a 10 mV peak-to-peak sine wave as the excitation signal. Then the impedance data were analyzed and fitted. The polarization curves were obtained from −250 to +250 mV (vs. EOCP) with 0.5 mV s−1 scan rate, and the data were collected and analyzed by Zsimpwin 3.10 software.
2.3. Weight loss experiments
Mild steel specimens in triplicate were immersed in the test 0.1 M H2SO4 solution for 9 days under different conditions. After that, the specimens were removed from the solutions, rinsed with water and absolute ethanol, finally dried and weighted. Weight loss experiments were utilized to calculate the mean corrosion rate.
2.4. SEM analysis
The surface morphology of specimens after immersion in 0.1 M H2SO4 in the absence and presence of different concentration of different inhibitors was performed on a KYKY2800B SEM. The accelerating voltage was 25 kV.
2.5. Computational details
The molecular dynamics (MD) simulations were performed using Material Studio. Fe(110) surface was chosen for the simulation study. COMPASS force field was used to optimize the structures of all components of the system.14 The MD simulation of the interaction between involved molecules and the Fe(110) surface was carried out in a simulation box (28.1 Å × 25.5 Å × 57.8 Å) with periodic boundary conditions to model a representative part of the interface devoid of any arbitrary boundary effects. The Fe(110) plane was first cleaved from iron crystal, and then the surface was optimized to the energy minimum. The inhibitor molecule was firstly optimized to the most stable configuration with molecular mechanics method. The amorphous cell was then constructed with the optimized inhibitor and 800 water molecules using Amorphous Cell module. The configurations of (inhibitors +800H2O) interacting with Fe(110) were obtained by “build Layers” tool. The MD simulation was performed under 298 K, NVT ensemble, with a time step of 1 fs and simulation time of 1 ns.
Quantum chemical calculations were conducted with the DMol3 module. All electronic calculations of four imidazoles molecules were accomplished by GGA/BLYP method with a double numerical with d and p polarization (DNP) basis set.15 The computationally economical DNP basis set is comparable in size to the Gaussian-type 6-31G (d, p) basis set and the reliability of this level of theory in studying the organic molecule has been confirmed.6,16 The convergence tolerance for geometry optimization was 2.7 × 10⁻⁴ eV for energy, 0.054 eV Å−1 for force, and 0.005 Å for displacement, respectively. The orbital cut off was set to 3.7 Å, and frequency analysis was performed to ensure the calculated structure being the minimum point on potential energy surface (without imaginary frequency).
3. Results and discussion
3.1. Electrochemical impedance spectroscopy
The impedance spectra for mild steel in 0.1 M H2SO4 solution with different concentrations of four imidazoles are presented as Nyquist plots in Fig. 2. It is not hard to notice that the impedance response of mild steel has significantly changed after the addition of different inhibitors in the corrosive solutions. As can be seen from Fig. 2, the Nyquist plots show that a single depressed semicircle and the diameter of semicircle increases with increasing inhibitor concentrations, indicating that the corrosion process on steel is mainly dominated by the charge transfer process, and the metal surface is inhomogeneous, which resulted from the roughness of the electrode surface or interfacial effect.17,18 Moreover, the diameter of semicircle increases substantially and the impedance values over the whole frequency range increase with increasing OP concentration as shown in Fig. 2d, demonstrating that the corrosion resistance of mild steel has been enhanced significantly.
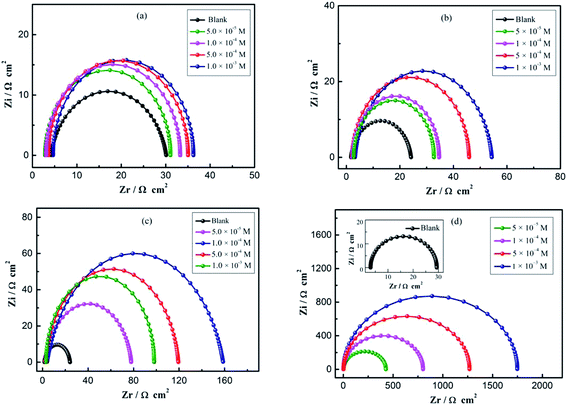 |
| | Fig. 2 EIS obtained in 0.1 M H2SO4 solution for the bare mild steel, with different concentrations of (a) BI, (b) ABI, (c) PBI, and (d) OP. | |
The electrical equivalent circuit employed to model the investigated system is shown in Fig. 3. This equivalent circuit consists of a constant phase element (CPE), in parallel with a resistor (Rct). The CPE is often used to substitute the double layer capacitance (Cdl) to give a more accurate fit of the experimental impedance data. In this designed circuit, the Rs reflects the resistance of the solution between the working electrode and SCE, Rct represents the charge-transfer resistance, CPE is constituted of component Y0 and a coefficient n. The use of the CPE-type impedance has been extensively reported elsewhere.19–21 It is described as the below equation:22
| |
 | (1) |
where
Y0 is a proportional factor,
j is the imaginary unit,
ω is the angular frequency, and
n is the deviation parameter which is often related to the surface morphology. Different values of
n (−1 ≤
n ≤ 1) give the CPE different electrical component presentation. When
n = 0, CPE stands for the resistance;
n = 1, CPE reflects the capacitance;
n = −1, CPE represents the inductance;
n = 0.5, CPE represents the Warburg impedance. Various parameters, such as
Rs,
Rct,
Cdl and
η% are summarized in
Table 1.
Cdl and
η% can be calculated according to the
eqn (2) and
(3), respectively:
| |
 | (3) |
where
Rct and
Rct,0 are the charge transfer resistance in the presence and absence of four inhibitors, respectively.
 |
| | Fig. 3 Equivalent circuit used to model impedance data. | |
Table 1 Electrochemical impedance parameters for mild steel in 0.1 M H2SO4 with different concentrations of BI, ABI, PBI, and OP at 298 K
| Inhibitor |
C (M) |
Rs (Ω cm2) |
CPE |
Rct (Ω cm2) |
Cdl (mF cm−2) |
η (%) |
| Y0 (×10−5 S sn cm−2) |
n |
| BI |
Blank |
1.76 |
32.38 |
0.9132 |
22.40 |
191.5 |
— |
| 5.0 × 10⁻⁵ |
2.86 |
29.08 |
0.9231 |
28.22 |
175.2 |
20.62 |
| 1.0 × 10⁻⁴ |
3.09 |
28.50 |
0.8701 |
30.18 |
165.4 |
25.78 |
| 5.0 × 10⁻⁴ |
3.63 |
26.24 |
0.8622 |
31.61 |
132.6 |
29.14 |
| 1.0 × 10⁻³ |
3.59 |
24.45 |
0.8686 |
32.44 |
107.0 |
30.94 |
| ABI |
5.0 × 10⁻⁵ |
2.27 |
25.09 |
0.9701 |
30.6 |
165.0 |
26.79 |
| 1.0 × 10⁻⁴ |
2.67 |
23.27 |
0.9622 |
32.67 |
132.4 |
31.44 |
| 5.0 × 10⁻⁴ |
2.12 |
20.23 |
0.9784 |
43.81 |
125.0 |
48.87 |
| 1.0 × 10⁻³ |
3.23 |
14.70 |
0.9273 |
51.22 |
112.8 |
56.27 |
| PBI |
5.0 × 10⁻⁵ |
2.89 |
17.81 |
0.9037 |
75.09 |
100.5 |
70.17 |
| 1.0 × 10⁻⁴ |
2.46 |
16.35 |
0.9191 |
116.90 |
59.1 |
80.84 |
| 5.0 × 10⁻⁴ |
3.16 |
15.72 |
0.9312 |
132.64 |
46.3 |
83.11 |
| 1.0 × 10⁻³ |
4.01 |
7.82 |
0.9404 |
154.70 |
34.2 |
85.52 |
| OP |
5.0 × 10⁻⁵ |
3.16 |
4.32 |
0.9035 |
425.14 |
9.6 |
94.37 |
| 1.0 × 10⁻⁴ |
1.87 |
2.88 |
0.9090 |
800.51 |
6.4 |
97.20 |
| 5.0 × 10⁻⁴ |
3.59 |
2.86 |
0.9107 |
1265.03 |
5.4 |
98.22 |
| 1.0 × 10⁻³ |
2.99 |
2.73 |
0.9242 |
1745.04 |
4.0 |
98.72 |
As can be seen in Table 1, the addition of four inhibitors increases the values of Rct and this effect is enhanced due to the increase of the inhibitor concentration. The high Rct value is generally associated with a slower corrosion process of the investigated system, in another word, the corrosion reaction on working electrode is more difficult to proceed after more inhibitor added. It's worth noting that the varying concentration of OP in acid solution from 5 × 10⁻⁵ to 1 × 10⁻³ M leads to the change of the inhibition efficiencies from 94.37% to 98.72%, indicating that the OP is the highest effective inhibitor for steel corrosion in H2SO4 solution among the four inhibitors. Meanwhile, with the increasing concentration of studied inhibitors, the values of Cdl exhibits a decreasing trend due to the decrease in exposed electrode surface area, from which it can be concluded that water molecules are replaced gradually by studied inhibitors at the steel/solution interface.
3.2. Polarization curve
Potentiodynamic polarization measurements were carried out immediately after the EIS experiments. Fig. 4 shows the polarization curves of mild steel in 0.1 M H2SO4 blank solution and in the presence of various concentrations of different inhibitors at 298 K. All the electrochemical parameters like the corrosion potential (Ecorr), corrosion current density (icorr), anodic Tafel slopes (βa), cathodic Tafel slopes (βc) and η% are summarized in Table 2. βa, βc, and the icorr are obtained from the extrapolation of anodic and cathodic lines to the corrosion potential using CHI600d electrochemical analyzer software. In the case, the inhibition efficiency (η%) of inhibitors on the corrosion of mild steel were calculated as following:| |
 | (4) |
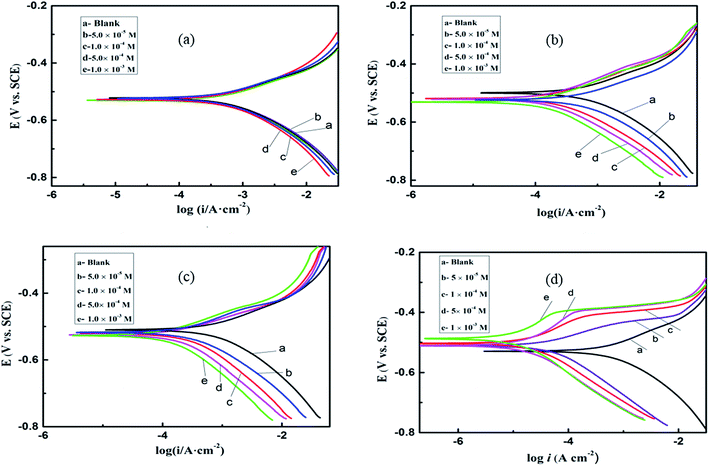 |
| | Fig. 4 Potentiodynamic polarization curves for mild steel in 0.1 M H2SO4 in the presence of different concentrations of (a) BI, (b) ABI, (c) PBI, and (d) OP. | |
Table 2 Corrosion parameters for mild steel in 0.1 M H2SO4 solution with different concentrations of BI, ABI, PBI, and OP
| Inhibitor |
C (M) |
Ecorr (mV) |
icorr (μA cm−2) |
βc (mV dec−1) |
βa (mV dec−1) |
η (%) |
| BI |
Blank |
−510 |
820.1 |
7.59 |
11.67 |
— |
| 5.0 × 10⁻⁵ |
−531 |
625.4 |
7.84 |
11.70 |
23.74 |
| 1.0 × 10⁻⁴ |
−531 |
570.1 |
7.87 |
11.78 |
30.48 |
| 5.0 × 10⁻⁴ |
−532 |
547.3 |
7.89 |
11.80 |
33.26 |
| 1.0 × 10⁻³ |
−533 |
507.6 |
7.94 |
11.86 |
38.10 |
| ABI |
5.0 × 10⁻⁵ |
−518 |
530.4 |
8.13 |
11.65 |
35.32 |
| 1.0 × 10⁻⁴ |
−518 |
480.1 |
7.91 |
11.49 |
41.46 |
| 5.0 × 10⁻⁴ |
−519 |
368.4 |
7.86 |
12.04 |
55.08 |
| 1.0 × 10⁻³ |
−521 |
275.7 |
7.33 |
14.48 |
66.38 |
| PBI |
5.0 × 10⁻⁵ |
−519 |
281.4 |
8.21 |
11.33 |
65.68 |
| 1.0 × 10⁻⁴ |
−517 |
239.8 |
8.58 |
11.57 |
70.76 |
| 5.0 × 10⁻⁴ |
−513 |
158.6 |
8.04 |
12.13 |
80.66 |
| 1.0 × 10⁻³ |
−515 |
121.1 |
8.71 |
11.43 |
85.23 |
| OP |
5.0 × 10⁻⁵ |
−511 |
30.25 |
11.61 |
15.84 |
96.31 |
| 1.0 × 10⁻⁴ |
−503 |
20.74 |
10.59 |
11.50 |
97.47 |
| 5.0 × 10⁻⁴ |
−510 |
15.09 |
10.91 |
9.74 |
98.16 |
| 1.0 × 10⁻³ |
−503 |
11.13 |
10.29 |
7.95 |
98.64 |
As shown in Fig. 4, in comparison with the Tafel curve obtained in the absence of different inhibitors, both the cathodic and anodic densities exhibit a noticeable decreasing tendency after the addition of these imidazole compounds. The parallel cathodic Tafel curves in Fig. 4 reveal that the hydrogen evolution was activation-controlled and the mechanism of cathodic hydrogen evolution reaction was not affected by the presence of the inhibitors.23–25 The corrosion active sites on the metal surface are blocked after the adsorption interaction has taken place between the inhibitor molecules and the steel surface. As a result, the exposed surface which is attacked by the H+ ions decreases, while the reaction mechanism remains unchanged.
As shown in Fig. 4d, as the polarization potential moves a certain value (about −100 mV), a plat form in vertical can be seen on the anodic curves especially at relatively high inhibitor concentration. This can be explained by desorption of the omeprazole molecules from the electrode surface due to the significant dissolution of steel. In this case the desorption rate of OP is higher than its adsorption rate, so the corrosion current increased more significantly with rising potential. Between the extended Tafel line of the polarization curve and the flat region, there is a potential of the intersection point which can be described as desorption potential. According to the Table 2, it is obviously find that the desorption potentials (Edes) move to more positive values with increasing inhibitor concentration, in other words, the adsorbed inhibitor molecules get more stable on the surface. It is observed (see Table 2) that inhibiting effects increased with increasing the inhibitor concentration. At 1.0 × 10⁻³ M, BI, ABI, PBI and OP reached a maximum value of 38.10%, 66.38%, 85.23% and 98.64, respectively. For these compounds the inhibition efficiency orders are: OP > PBI > ABI > BI. Especially, a comparison of our results with other similar benzimidazole derivatives already published elsewhere has been made and given in the ESI.†
3.3. Weight loss test
The corrosion rate (v) can be obtained from weight loss measurements for different concentrations of inhibitors in 0.1 M H2SO4, as provided in Table 3. Corrosion rate v (mg cm−2 h−1) and the corrosion inhibition efficiency were obtained by the following formulas:| |
 | (5) |
| |
 | (6) |
where ΔW is the average weight loss (mg), A is the surface area of specimens (cm2), t is the immersion time (h); v0 and vi signified the corrosion rate in the absence and presence of inhibitors, respectively.
Table 3 Inhibition efficiency for mild steel in 0.1 M H2SO4 solution with different concentrations of inhibitors
| Inhibitor |
C (M) |
v (mg cm−2 h−1) |
η (%) |
θ |
| BI |
Blank |
0.486 |
— |
— |
| 5.0 × 10⁻⁵ |
0.378 |
22.22 |
0.222 |
| 1.0 × 10⁻⁴ |
0.365 |
24.90 |
0.249 |
| 5.0 × 10⁻⁴ |
0.344 |
29.20 |
0.292 |
| 1.0 × 10⁻³ |
0.319 |
34.36 |
0.343 |
| ABI |
5.0 × 10⁻⁵ |
0.297 |
38.89 |
0.389 |
| 1.0 × 10⁻⁴ |
0.253 |
47.94 |
0.480 |
| 5.0 × 10⁻⁴ |
0.227 |
53.29 |
0.533 |
| 1.0 × 10⁻³ |
0.181 |
62.76 |
0.628 |
| PBI |
5.0 × 10⁻⁵ |
0.135 |
72.22 |
0.722 |
| 1.0 × 10⁻⁴ |
0.106 |
78.19 |
0.782 |
| 5.0 × 10⁻⁴ |
0.085 |
82.51 |
0.825 |
| 1.0 × 10⁻³ |
0.056 |
88.48 |
0.885 |
| OP |
5.0 × 10⁻⁵ |
0.043 |
91.15 |
0.912 |
| 1.0 × 10⁻⁴ |
0.021 |
95.68 |
0.957 |
| 5.0 × 10⁻⁴ |
0.005 |
98.97 |
0.990 |
| 1.0 × 10⁻³ |
0.001 |
99.79 |
0.998 |
As can be seen from Table 3 and Fig. 5 that the corrosion inhibitors can protect mild steel perfectly and the inhibition efficiency increased with increasing concentrations. The corrosion rate reached to the minimum at 1.0 mM, but the inhibition efficiency reached to maximum. This phenomenon suggests that the four molecules varying act by adsorption on the steel surface. As the concentration of OP reached to 1 × 10⁻³ M, θ of OP gained a high value of 99.8% at 298 K, which suggests that OP can repress the metal corrosion at top efficiency in acid solution among the four inhibitors. The inhibition efficiencies obtained from weight lost measurements are in accordance with those in the EIS and polarization experiments.
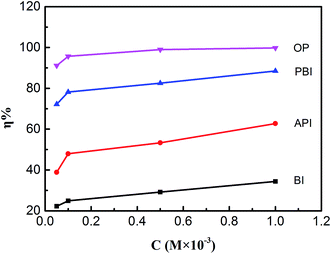 |
| | Fig. 5 The effect of corrosion inhibitor for mild steel in weight loss with different concentrations. | |
3.4. Scanning electron microscopy studies
The SEM images of Q235 specimens exposed to 0.1 M H2SO4 solutions for 9 days with and without inhibitors are given in Fig. 6. Before corrosion, the surface morphology of the sample was a freshly polished steel surface, as seen in Fig. 6a. After corrosion in 0.1 M H2SO4 solution, the surface morphology becomes porous and rough as shown in Fig. 6b, which means the steel, was severely corroded. Fig. 6c–f show the morphological features of the inhibited surface.
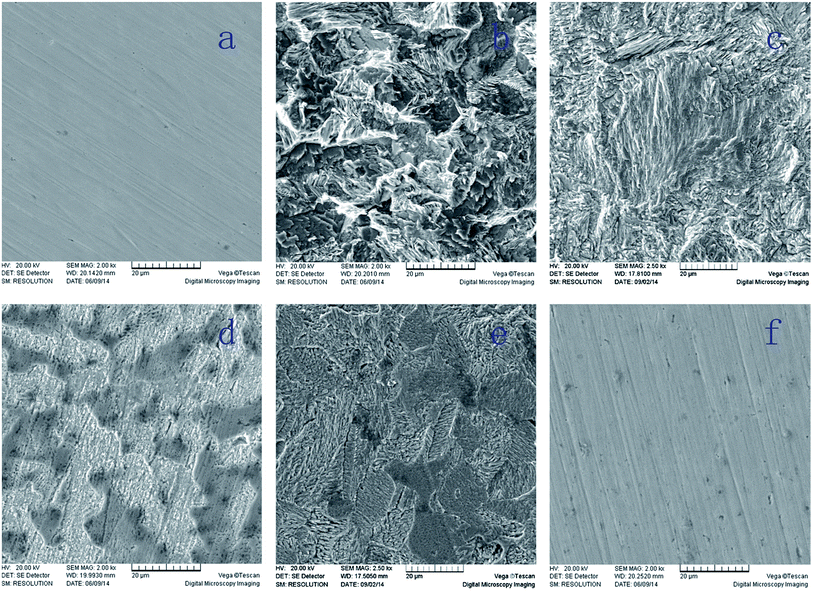 |
| | Fig. 6 SEM micrographs of mild steel samples (a) base material, (b) blank, (c) BI, (d) ABI, (e) PBI, and (f) OP. | |
Compared with the bare steel, the surface of sample immersed in 0.1 M H2SO4 solution with BI, ABI or PBI was smoother, even there were a few moderate notches. Moreover, the surface of sample treated with OP was almost as smooth as the original steel sample. These results indicated that inhibitors above mentioned may adsorb on the Q235 surface and form a protective film, resulting in a decrease of contact between steel and the aggressive solution.
3.5. Computational studies
Quantum chemical calculation has been widely utilized to provide a molecular-level understanding of the relationship between the inhibitor structure and its inhibition behavior. With this method, the chemical reactivity of the inhibitor can be predicted with the analysis of the quantum chemical indices. According to frontier orbital theory, the reaction of reactants mainly occurred on the HOMO and LUMO, and the formation of a transition state is due to an interaction between the frontier orbitals of the reactants.26–28 So, it was important to investigate the distribution of HOMO and LUMO for exploration of inhibition mechanism. One the one hand, the unoccupied d orbitals of Fe atom can accept electrons from inhibitor molecule to form coordinate bond, and on the other hand, the inhibitor molecule can also accept electrons from Fe atom with its anti-bonding orbitals to form back-donating bond.29
The distribution of HOMO/LUMO densities, electrostatic potential structures for BI, ABI, PBI, and OP are presented in Fig. 7. The HOMOs for all studied inhibitors are π-type molecular orbitals, and the nearly planar geometry of the inhibitor molecules suggest a parallel adsorption manner of inhibitor molecules on metal surface.
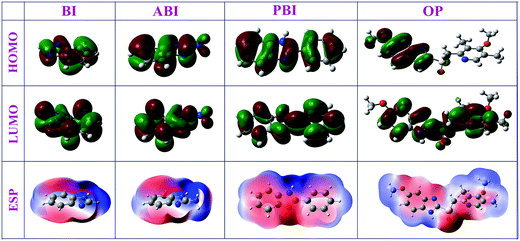 |
| | Fig. 7 Calculated HOMOs, LUMOs, and electrostatic potential structures for four inhibitor molecules at GGA/BLYP/DNP level. | |
Fig. 8 shows the correlation diagram of frontier molecular orbitals for the investigated inhibitors and their calculated LUMO–HOMO gap (ΔE). It was generally acknowledged that low values of ΔE will provide good inhibition efficiency, because the energy for removing an electron from the last occupied orbital will be low. In Fig. 7, the values of ΔE decreased in the following order: OP > PBI > ABI > BI. It can be observed that all the nitrogen and sulfur atoms for each molecule possess an excess of negative charge. The sulfur and nitrogen atoms are assumed to play the key role for the inhibition action because these are the most negative centers of the compounds. Compared with the other three compounds, due to steric effects the nitrogen and sulfur atoms of OP possess more negative charges which implied that these atoms preferred to provide electrons to form more coordinate bonds with the metal atoms, these atoms were the electrophilic reactive sites during absorption. Hence, it could be concluded that the absorption would occur on multiple reactivity sites, which increased adsorption stability and led to the improvement of inhibition efficiency.
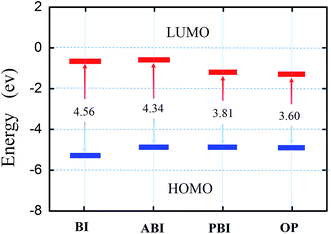 |
| | Fig. 8 Correlation diagram of the frontier molecular orbitals of the inhibitors investigated and their calculated ΔE. | |
The equilibrium adsorption configurations for the four corrosion inhibitors are shown in Fig. 9. By careful examination of Fig. 9, we can find that during the process of simulation, benzimidazole and its derivatives molecules moved gradually near the Fe(110) surface. After the system reached equilibrium, all the investigated inhibitors adsorbed nearly parallel to the Fe(110) surface, and they adsorb on the metal surface through the nitrogen and sulfur atoms as well as the five-membered aromatic rings. Quantitative appraisal of the interaction between each molecule and the Fe surface was achieved by calculating the adsorption energy (Eads) using eqn (8):30
| | |
Eads = EMol/surf − (Esurf + EMol)
| (7) |
where
EMol,
Esurf, and
EMol/surf are the total energies of isolated adsorbate, Fe(110) slab, and Mol/Fe(110) system, respectively. And the binding energy is the negative value of the interaction energy,
Ebinding = −
Eads. The values of the adsorption and binding energies of the four inhibitors on Fe(110) surface are calculated. The values of
Eads are −293.3, −314.2, −476.6, and −757.1 for BI, ABI, PBI, and OP, respectively. The high negative values of the adsorption energies indicate that the adsorption of inhibitors on Fe(110) surface is spontaneous, strong, and stable. The binding energies are found to decrease in the order OP > PBI > ABI > BI. OP gives the maximum binding energy during the whole simulation process, which indicates that OP will adsorb more strongly on the iron surface and possess better inhibition performance than the other inhibitors. This result is consistent with the aforementioned quantum chemistry analysis.
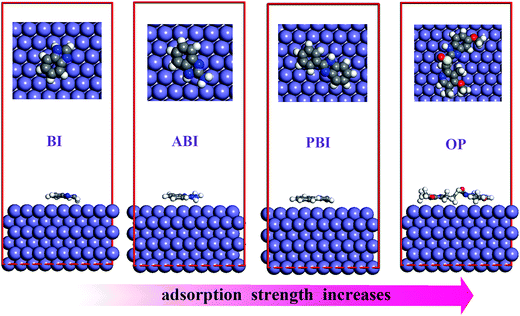 |
| | Fig. 9 Representative snapshots of BI, ABI, PBI and OP on Fe(110) surface, viewed along different perspectives. | |
3.6. Mechanism of adsorption and inhibition
A clarification of the mechanism of inhibition requires full knowledge of the interaction between the protective organic inhibitor and the metal surface. The corrosion behavior of mild steel in H2SO4 solution has received considerable attention in the literature.31,32 The mechanism of the anodic dissolution of iron is shown in the following equations:| | |
(H2O)ads + SO42− ⇒ H2O + (SO42−)ads
| (8) |
| | |
Fe + SO42− ⇔ (FeSO42−)ads
| (9) |
| | |
(FeSO42−)ads ⇔ (FeSO4)ads + 2e−
| (10) |
| | |
(FeSO4)ads ⇔ Fe2+ + SO42−
| (11) |
Assumed in presence of SO42− ions, reaction (9) rapid proceeds on the metal surface. Hence, the anodic iron dissolution was controlled by both electrodissolution of iron and diffusion of soluble (FeSO4)ads to the bulk solution. As illustrated in Fig. 10, a mechanism has been proposed to explain the adsorption model of inhibitor (Inh) on the iron surface. In the low-lying area, sulfate anions are first adsorbed onto the positively charged metal surface. Because benzimidazole derivatives are organic bases, then OP, PBI, ABI, and BI molecules can exist as protonated form (InhH+) in acidic solution. Inhibitor quickly reacts with Fe(0) and forms a strong protective layer in the non-corroded area. The layer is very thin and is presumably a single monolayer. On the other hand, InhH+ reacts with Fe(II) and forms a thick and protective [FeSO42− InhH+] complex. Therefore, aggressive ions were obstructed by the protective film and the steel was effectively protected from corrosion.
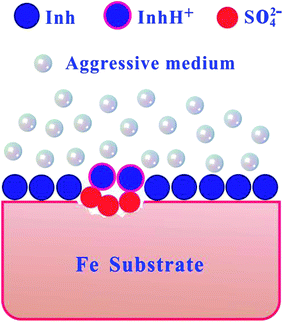 |
| | Fig. 10 Proposed mechanism for the adsorption of inhibitor molecules on the iron surface in H2SO4 medium. | |
Cathodic chemical process occurs as following:33
| | |
(FeH+)ads + e− ⇔ (FeH)ads
| (13) |
| | |
(FeH)ads + H+ + e− ⇔ Fe + H2
| (14) |
Then, the protonated inhibitor molecules can be also adsorbed at cathodic sites of mild steel in competition with hydrogen ions that going to reduce to H2 gas evolution.
4. Conclusions
In summary, polarization measurements, EIS, and weight loss experiments indicate that BI, ABI, PBI and OP can protect mild steel from corrosion in acid solution. The inhibition efficiency obtained from the polarization and weight loss tests is coincident with ones obtained from EIS, and both of the inhibition efficiencies increase with the concentration of impregnation liquid. In addition, SEM micrographs showed that the OP molecules form a best protective film on the Fe surface among them. Molecular modeling was used to evaluate the structural, electronic and reactivity parameters of benzimidazole in relation to their effectiveness as corrosion inhibitors. The inhibitory properties of benzimidazole and its derivatives were observed that the adsorption occurs mostly through the lone pair of electrons of the hetero-atoms and π-electrons of the benzimidazole moiety. All values of Eads are negative, which means that the adsorption could occur spontaneously. Ultimately, OP shows the best inhibiting performance among the four selected compounds, which is in good agreements with the experiment data. The results clearly showed that the molecular modification of the benzimidazole led to a more efficient corrosion inhibitor molecule and that the proposed molecular modelling methods can be applied to design new molecules to be tested as corrosion inhibitors.
Acknowledgements
This research was supported by the Natural Science Foundation of China (21376282), the Chongqing Innovation Fund for Graduate Students (CYB16035), the Science and Technology Program of Guizhou Province (QKHJC2016-1149), the Guizhou Provincial Department of Education Foundation (QJHKYZ2016-105), and the Research Fund for the Doctoral Program of Tongren University (trxyDH1510).
References
- X. G. Li, D. W. Zhang, Z. Y. Liu, Z. Li, C. W. Du and C. F. Dong, Nature, 2015, 527, 441–442 CrossRef CAS PubMed.
- S. Nesic, Corros. Sci., 2007, 49, 4308–4338 CrossRef CAS.
- A. Cook, G. Frankel, A. Davenport, T. Hughes, S. Gibbon, D. Williams, H. Bluhm, V. Maurice, S. Lyth, P. Marcus, D. Shoesmith, C. Wren, J. Wharton, G. Hunt, S. Lyon, T. Majchrowski, R. Lindsay, G. Williams, B. Rico Oller, M. Todorova, S. Nixon, S. T. Cheng, J. Scully, A. Wilson, F. Renner, Y. H. Chen, C. Taylor, H. Habazaki, A. Michaelides, S. Morsch, P. Visser, L. Kyhl and A. Kokalj, Faraday Discuss., 2015, 180, 543–576 RSC.
- P. B. Raja, M. Ismail, S. Ghoreishiamiri, J. Mirza, M. C. Ismail, S. Kakooei and A. A. Rahim, Chem. Eng. Commun., 2016, 203, 1145–1156 CrossRef CAS.
- B. E. A. Rani and B. B. J. Basu, Int. J. Corros., 2012, 2012, 1–15 CrossRef.
- E. E. Oguzie, Y. Li, S. G. Wang and F. Wang, RSC Adv., 2011, 1, 866–873 RSC.
- A. Kokalj, Corros. Sci., 2013, 68, 195–203 CrossRef CAS.
- L. Guo, W. P. Dong and S. T. Zhang, RSC Adv., 2014, 4, 41956–41967 RSC.
- D. Wang, L. Gao, D. Zhang, D. Yang, H. Wang and T. Lin, Mater. Chem. Phys., 2016, 169, 142–151 CrossRef CAS.
- C. Zuriaga-Monroy, R. Oviedo-Roa, L. E. Montiel-Sanchez, A. Vega-Paz, J. Marin-Cruz and J. M. Martinez-Magadan, Ind. Eng. Chem. Res., 2016, 55, 3506–3516 CrossRef CAS.
- I. B. Obot, A. Madhankumar, S. A. Umoren and Z. M. Gasem, J. Adhes. Sci. Technol., 2015, 29, 2130–2152 CrossRef CAS.
- J. Radilla, G. E. Negron-Silva, M. Palomar-Pardave, M. Romero-Romo and M. Galvan, Electrochim. Acta, 2013, 112, 577–586 CrossRef CAS.
- X. M. Wang, Y. Wan, Y. Zeng and Y. X. Gu, Int. J. Electrochem. Sci., 2012, 7, 2403–2415 CAS.
- H. Sun, J. Phys. Chem. B, 1998, 102, 7338–7364 CrossRef CAS.
- C. T. Lee, W. T. Yang and R. G. Parr, Phys. Rev. B: Solid State, 1988, 37, 785–789 CrossRef CAS.
- X. H. Li, S. D. Deng, X. G. Xie and G. B. Du, Mater. Chem. Phys., 2016, 181, 33–46 CrossRef CAS.
- A. M. Beccaria and C. Bertolotto, Electrochim. Acta, 1997, 42, 1361–1371 CrossRef CAS.
- B. Heeg and D. Klenerman, Langmuir, 2000, 16, 1783–1792 CrossRef CAS.
- O. Benali, C. Selles and R. Salghi, Res. Chem. Intermed., 2014, 40, 259–268 CrossRef CAS.
- M. Behpour, S. M. Ghoreishi, M. Khayatkashani and N. Soltani, Mater. Chem. Phys., 2012, 131, 621–633 CrossRef CAS.
- K. Babic-Samardzija and N. Hackerman, J. Solid State Electrochem., 2005, 9, 483–497 CrossRef CAS.
- A. K. Singh, Ind. Eng. Chem. Res., 2012, 51, 3215–3223 CrossRef CAS.
- D. K. Yadav and M. A. Quraishi, Ind. Eng. Chem. Res., 2012, 51, 8194–8210 CrossRef CAS.
- W. Li, L. Hu, Z. Tao, H. Tian and B. Hou, Mater. Corros., 2011, 62, 1042–1050 CrossRef CAS.
- J. J. Fu, S. N. Li, L. H. Cao, Y. Wang, L. H. Yan and L. D. Lu, J. Mater. Sci., 2010, 45, 979–986 CrossRef CAS.
- R. E. Morsi, E. A. Khamis and A. M. Al-Sabagh, J. Taiwan Inst. Chem. Eng., 2015, 60, 573–581 CrossRef.
- D. O. Isin and N. Karakus, J. Taiwan Inst. Chem. Eng., 2015, 50, 306–313 CrossRef CAS.
- X. Li and X. Xie, J. Taiwan Inst. Chem. Eng., 2014, 45, 3033–3045 CrossRef CAS.
- G. Golestani, M. Shahidi and D. Ghazanfari, Appl. Surf. Sci., 2014, 308, 347–362 CrossRef CAS.
- L. Guo, X. Ren, Y. Zhou, S. Xu, Y. Gong and S. Zhang, Arabian J. Chem., 2017, 10, 121–130 CrossRef CAS.
- A. Doner, R. Solmaz, M. Ozcan and G. Kardas, Corros. Sci., 2011, 53, 2902–2913 CrossRef.
- A. Y. Musa, A. A. H. Kadhum, A. B. Mohamad and M. S. Takriff, Mater. Chem. Phys., 2011, 129, 660–665 CrossRef CAS.
- L. Guo, S. Zhu, S. Zhang, Q. He and W. Li, Corros. Sci., 2014, 87, 366–375 CrossRef CAS.
Footnote |
| † Electronic supplementary information (ESI) available. See DOI: 10.1039/c7ra02192e |
|
| This journal is © The Royal Society of Chemistry 2017 |
Click here to see how this site uses Cookies. View our privacy policy here.  Open Access Article
 *a,
Savaş Kayac,
Xiaofang Luoa and
Bin Xiang*a


