 Open Access Article
Creative Commons Attribution 3.0 Unported Licence
Enhanced photocatalytic removal of NO over titania/hydroxyapatite (TiO2/HAp) composites with improved adsorption and charge mobility ability†
Jie Yaoab,
Yufei Zhangb,
Yawen Wang*a,
Meijuan Chenc,
Yu Huang *b,
Junji Caob,
Wingkei Hod and
Shun Cheng Leee
aCollege of Chemistry and Chemical Engineering, Taiyuan University of Technology, Taiyuan 030024, China. E-mail: wangyawen@tyut.edu.cn
bKey Lab of Aerosol Chemistry & Physics, Institute of Earth Environment, Chinese Academy of Sciences, Xi'an 710061, China
cSchool of Human Settlements and Civil Engineering, Xi'an jiaotong University, Xi'an 710049, China
dDepartment of Science and Environmental Studies, The Education University of Hong Kong, Hong Kong, China
eDepartment of Civil and Environmental Engineering, The Hong Kong Polytechnic University, Hung Hom, Hong Kong, China
First published on 8th May 2017
Abstract
Effective photocatalysis processes with production of fewer toxic intermediates are highly desirable for air purification. In this study, titania/hydroxyapatite (TiO2/HAp) composites were synthesized by a facile hydrothermal method and employed to decontaminate nitric oxide (NO) in air under simulated solar light irradiation for the first time. It was found that the photocatalytic activity of the as-prepared TiO2/HAp composite (44.61%) was superior to those of the pristine components (TiO2: 38.57%, HAp: 36.73%) and mechanically mixed samples (35.36%). The TiO2/HAp composite with mass ratio of 3![[thin space (1/6-em)]](https://www.rsc.org/images/entities/char_2009.gif) :
:![[thin space (1/6-em)]](https://www.rsc.org/images/entities/char_2009.gif) 1 (75% TiO2/HAp) exhibited the highest NO removal efficiency among them. Moreover, the toxic intermediate NO2 production was significantly inhibited over TiO2/HAp. These synergistically improved properties can be ascribed to the high separation efficiency and faster transfer of the photo-generated charge carriers as evidenced by the experimental results from photocurrent tests and electrochemical impedance spectroscopy (EIS). The results from temperature programmed desorption (TPD) confirmed that the 75% TiO2/HAp sample had stronger chemisorption for NO due to the increased concentration of surface OH groups. Furthermore, the electron spin resonance (ESR) characterization suggested that ˙O2− and ˙OH radicals were the major species involved for NO removal over TiO2/HAp composites. The five recycling tests suggested that the TiO2/HAp has superior photocatalytic stability. This study suggests that the combination of TiO2 with HAp is an effective approach for air purification.
1 (75% TiO2/HAp) exhibited the highest NO removal efficiency among them. Moreover, the toxic intermediate NO2 production was significantly inhibited over TiO2/HAp. These synergistically improved properties can be ascribed to the high separation efficiency and faster transfer of the photo-generated charge carriers as evidenced by the experimental results from photocurrent tests and electrochemical impedance spectroscopy (EIS). The results from temperature programmed desorption (TPD) confirmed that the 75% TiO2/HAp sample had stronger chemisorption for NO due to the increased concentration of surface OH groups. Furthermore, the electron spin resonance (ESR) characterization suggested that ˙O2− and ˙OH radicals were the major species involved for NO removal over TiO2/HAp composites. The five recycling tests suggested that the TiO2/HAp has superior photocatalytic stability. This study suggests that the combination of TiO2 with HAp is an effective approach for air purification.
1. Introduction
Nitric oxides (NOx) generated from the combustion of fossil fuels have attracted lots of attention because they can lead to various environmental problems, such as acid rain, haze, photochemical smog, ozone depletion and destruction of animal and plant species.1 The control of NOx in the atmosphere has become one of the greatest challenges in environmental protection. Several techniques have been developed for removing NOx, such as electrochemical methods,2 a chemical absorption-biological reduction integrated system,3 selective catalytic reduction4 and semiconductor photocatalysis.5 Among these methods, semiconductor photocatalysis is a promising technology for low concentration air purification, because it allows for the utilization of renewable, safe and clean solar light to solve environmental problems.Titanium dioxide (TiO2) is one of the most popular photocatalysts in view of its non-toxicity, cheapness and excellent photochemical stability. However, the drawbacks of low adsorption capacity for pollutants6,7 and high recombination of photo-generated electron–hole pairs8,9 impair its photocatalytic performance. In order to solve these issues, several strategies have been adopted to enhance the photocatalytic efficiency. For example, modification with noble metals on the surface of TiO2 is considered as an efficient way for improving the photocatalytic activity.10,11 Besides, the combination of TiO2 with other semiconductor materials of suitable band structure (e.g. C3N4, Ag2CO3, Fe2O3, and Bi2WO6, etc.) can improve the charge separation efficiency and prolong the life of charges, enhancing the photocatalytic activity of TiO2 eventually.12–14 However, the above two strategies can not solve the drawback of low adsorption capacity for pollutants. Recently, some literatures reported that TiO2 supported materials, such as zeolite, silica, purity natural diatomite (rich in SiO2 87–91%), activated carbon, hydroxyapatite (HAp), can offer abundant active adsorption sites, which resulted in quick mass transfer and fast catalytic reactions.15–19
Among these supported materials, hydroxyapatite (HAp), Ca10(PO4)6(OH)2, with mechanical stability, non-toxicity, good biocompatibility, and low cost has been widely studied. Yuichi Komazaki et al. reported that NO2 was effectively collected on HAp in the annular diffusion scrubber.21 Due to its inherent hexagonal crystal, HAp possess hydroxyl ions (OH−) channels, which can enhance the electrical conductivity and charge carrier migration.20 The surface OH groups or H2O molecules adsorbed can react with the h+ to produce hydroxyl (˙OH) radicals. Fu et al. reported that the ZnSn(OH)6 provided a mass of OH groups and facilitated ˙OH radicals formation to enhance the photocatalytic performance.22 In addition, the electron state change of the PO43− groups in the surface of HAp during the photocatalytic process can result in the generation of ˙O2− radicals.23 Dai et al. also found that the oxygen vacancies were formed on the surface of HAp and acted as electrons receiver to achieve the electron–hole pairs separation.24
Hence, it is expected that combining the merits of HAp with TiO2 can not only improve the adsorption capacity of TiO2 for pollutants, but also decrease the recombination of photo-generated electron–hole pairs. So the combination of TiO2 and HAp may be an effective approach for air purification. In this paper, the TiO2/HAp composites were synthesized by a hydrothermal method. The as-prepared TiO2/HAp composites showed excellent photocatalytic activity on NOx removal under the simulated solar light. The physical and chemical properties of the TiO2/HAp were deeply discussed and the possible photocatalytic mechanism was proposed.
2. Experimental section
2.1. Materials
Titanium tetrachloride (TiCl4, analytical pure), ammonium hydroxide solution (NH3·H2O solution, 25%–28wt%, analytical pure), ammonium phosphate ((NH4)2HPO4, analytical pure), calcium nitrate (Ca(NO3)2·4H2O, analytical pure), absolute ethyl alcohol (C2H6O, analytical grade) were purchased from Sinopharm (Shanghai, China) and used without further treatment.2.2. Sample synthesis
The TiO2/HAp composites were prepared by adding a certain amount of as-prepared TiO2 powder into the precursor solution of HAp through a facile hydrothermal treatment. Firstly, 18 mL NH3·H2O solution (25%–28 wt%) was added dropwise into 10 mL TiCl4 solution and simultaneously stirred for 2 hour. Next, the white precipitate was collected by centrifugal separation, and washed thoroughly with deionized water and absolute ethyl alcohol for several times, and then dried at 60 °C overnight. The precursor powder was dispersed in 60 mL deionized water with vigorously stirring. Then it was put in 100 mL Teflon-lined autoclave and kept at 190 °C for 8 h to obtain the TiO2 powder. Secondly, (NH4)2HPO4 and Ca(NO3)2 were dissolved in water with a molar ratio of Ca/P = 1.67. Then its pH value was adjusted by ammonia to 9–10. The prepared TiO2 powder was added into the above solution and stirred for 2 h to get a suspension. Next, the suspension was transferred into a Teflon-lined autoclave and subsequently heated at 190 °C for 8 h. The obtained products were centrifuged and washed with deionized water and absolute ethyl alcohol, and then dried at 60 °C overnight.To get TiO2/HAp composites with different mass ratios, the amount of TiO2 powder was varied. The samples with mass ratios of TiO2![[thin space (1/6-em)]](https://www.rsc.org/images/entities/char_2009.gif) :
:![[thin space (1/6-em)]](https://www.rsc.org/images/entities/char_2009.gif) HAp = 1
HAp = 1![[thin space (1/6-em)]](https://www.rsc.org/images/entities/char_2009.gif) :
:![[thin space (1/6-em)]](https://www.rsc.org/images/entities/char_2009.gif) 1, 3
1, 3![[thin space (1/6-em)]](https://www.rsc.org/images/entities/char_2009.gif) :
:![[thin space (1/6-em)]](https://www.rsc.org/images/entities/char_2009.gif) 1, 5
1, 5![[thin space (1/6-em)]](https://www.rsc.org/images/entities/char_2009.gif) :
:![[thin space (1/6-em)]](https://www.rsc.org/images/entities/char_2009.gif) 1 were labeled as 50%, 75% and 83% TiO2/HAp (calculating by the ratio of TiO2), respectively. For comparison, the pure HAp was prepared under the same procedure without adding TiO2 powder.
1 were labeled as 50%, 75% and 83% TiO2/HAp (calculating by the ratio of TiO2), respectively. For comparison, the pure HAp was prepared under the same procedure without adding TiO2 powder.
2.3. Characterization
The XRD patterns were collected on a Philips X'pert PRO SUPER diffractometer using Cu Kα radiation (λ = 1.5406 Å) at a scan rate of 0.05° 2θ per s. FTIR (Magna-IR 50, Nicolet, America) spectra was obtained using a Fourier transform infrared spectroscopy absorption spectrometer from 4000 to 400 cm−1 at room temperature. X-ray photoelectron spectroscopy (XPS) were collected on ThermoFisher Scientific photoelectron spectrometer (Escalab 250Xi). The morphologies of as-prepared samples were analyzed by transmission electron microscopy (TEM, JEM-2010, Japan), and high-resolution transmission electron microscopy (HRTEM) microscopy. The specific surface areas of the as-synthesized samples were determined by N2 sorption using a Micromeritics Gemini 2390 analyzer and the pore size distribution was calculated using the Barrett–Joyner–Halenda (BJH) model. UV-vis diffuse reflectance spectra (DRS) was recorded by a UV-vis spectrophotometer using BaSO4 as the reference standard. Temperature programmed desorption (TPD) was carried out on a chemisorption analyzer (BJbuilder, PCA 1200, China). The sample for electron spin resonance spectroscopy (ER200-SRC, BRUKER, Germany) was prepared by mixing 0.05 prepared samples in a 25 mM DMPO solution with 50 mL aqueous dispersion for DMPO-˙OH or 50 mL alcohol dispersion for DMPO-˙O2−, respectively. The light irradiation source was a 300 W Xe arc lamp (PLS-SXE 300, Beijing).2.4. Evaluation of photoelectrochemical properties
The photoelectrochemical properties of pure TiO2, HAp and TiO2/HAp composites were carried out using a Parstat 4000 electrochemical workstation (USA) in a conventional three-electrode cell. In this three-electrode cell system, Ag/AgCl electrode and a platinum plate were used as reference electrode and counter electrode, respectively. In order to fabricate the working electrode, 0.09 wt% ethyl cellulose and 0.73 wt% terpineol were dissolved in ethanol, then 0.18 wt% sample was added in the above solution to obtain homogeneous suspension by bath sonication. Then the samples were coated on the fluorine doped tin oxide (FTO) glass through dip coating method. In order to remove the additives, the prepared electrodes were heat-treated in a furnace at 500 °C for 30 min. The current–time curves were measured at 0.2 V vs. Ag/AgCl in 0.1 mol L−1 Na2SO3 solution under a 300 W Xe arc lamp irradiation. Electrochemical impedance spectroscopy (EIS) was analyzed at a frequency range of 0.1 Hz to 100 kHz with a 5 mV voltage amplitude under open-circuit voltage in 1 mmol L−1 K3Fe(CN)6 and K4Fe(CN)6 solution.2.5. Evaluation of photocatalytic activity
The photocatalytic activity of the as-synthesized samples was investigated through the removal of NO at ppb level in a continuous flow reactor (30 cm × 15 cm × 10 cm) under simulated solar light irradiation at room temperature. The dispersed photocatalyst (0.1 g) was coated on a glass dish (D = 9.0 cm) (as shown in Fig. S1†). Then the dishes were treated at 70 °C until complete removal of water in the suspension. The simulated solar light source was a commercial 300 W Xe arc lamp (PLS-SXE 300, Beijing), which was vertical placed 20 cm above the reactor. The light intensity at the surface of the as-synthesized samples was controlled at 0.75 W cm−2 as measured by a photometer (THORLABS PD130, USA). The NO gas at ppb level was obtained from a compressed gas cylinder at a concentration of 50 ppm of NO (N2 balance). The 50 ppm of NO was diluted to about 420 ppb by the air stream from a zero air generator. The flow rate of the gas streams was controlled at 3 L min−1 by a mass flow controller. The lamp was not turned on until the adsorption–desorption equilibrium among catalysts, gases and water vapor was obtained. The concentration of NO, NO2, and NOx was continuously measured every 1 minute by a NOx analyzer (Ecotech, 9841) at a sampling rate of 0.6 L min−1. The removal ratio (R) of NO after irradiation was calculated according to the following equation:| R (%) = (1 − C/C0) × 100% |
3. Results and discussion
3.1. Phase structure and chemical composition
Fig. 1a show the XRD patterns of TiO2, HAp and TiO2/HAp composites. For the pure TiO2, the diffraction peaks at 25.2°, 37.8°, 48.0°, 53.9°, 55.2°, 62.7°, 68.5°, 70.3° are consistent with the characteristic peaks of anatase-TiO2 (JCPDS, 04-0477).25 As for pure HAp, all diffraction peaks and their relative intensities are agreement with the standard power diffraction patterns of hexagonal phase HAp (JCPDS, 09-0432). Fig. 1b shows the crystal structure model of HAp. It is clearly seen that the hydroxyapatite surface is rich in OH− groups, PO43− groups. No other impurity peak is observed, which indicates that pure TiO2 and HAp are successfully synthesized. Moreover, the diffraction patterns of the other three samples (50%, 75% and 83% TiO2/HAp composites) show that both anatase-TiO2 and hexagonal phase HAp are existed. It can be concluded that the TiO2/HAp composites were successfully synthesized by the hydrothermal method. Obviously, the intensities of TiO2 diffraction peaks have corresponding positive relationship with its relative content in the composites (50%, 75% and 83% TiO2/HAp). | ||
| Fig. 1 XRD patterns of as-synthesized samples (a), the crystal structure models of HAp (b) and FTIR spectra of TiO2, HAp and TiO2/HAp (50%, 75% and 83%) composites (c). | ||
The FTIR spectra of pure TiO2, HAp and TiO2/HAp composites are shown in Fig. 1c. The peaks at 3429 and 1626 cm−1 are caused by the lattice water of samples.26 The typical broad absorption bands of TiO2 are observed at 800–450 cm−1, which is attributed to the stretching vibration of Ti–O–Ti bonds.27 For HAp sample, the characteristic bands of PO43− present at 472 cm−1 (ν2), 562 and 604 cm−1 (ν4), 966 cm−1 (ν1) and 1031 and 1095 cm−1(ν3).28 The peaks appearing at 3573 and 633 cm−1 are attributed to stretching and bending vibration modes of OH bands of HAp, respectively.29 For the TiO2/HAp composites, well-preserved characteristic peaks of TiO2 and HAp in the spectra of TiO2/HAp (50%, 75% and 83%) composites, indicating no change of structure or phase transformation of TiO2 and HAp after composites synthesis. This observation demonstrates that the TiO2/HAp composites are synthesized successfully, which is consistent with the XRD results.
XPS was used to further determine surface chemical composition and chemical states of pure TiO2, HAp and TiO2/HAp composites. Fig. 2 shows the XPS spectra of TiO2, HAp and 75% TiO2/HAp. In Fig. 2a Ti, O, Ca and P elements are observed in the survey spectra of TiO2/HAp. The additional C element peak is mainly derived from the adventitious carbon as shown in Fig. 2b, the Ti 2p peaks of TiO2 located at 459.2 eV and 464.7 eV are attributed to the Ti–O bonds.30 However, the Ti 2p peaks of 75% TiO2/HAp move to 458.7 eV and 464.3 eV respectively, the lower energy levels, which could result from the existence of the Ti–O–Ca bonds in TiO2/HAp. Similarly, Duo et al. reported that the shift of the Ti 2p peaks in the TiO2/BiOCl composite was ascribed to the formation of Ti–O–Bi bonds.31 In Fig. 2c the Ca 2p peaks of HAp located at 346.6 eV and 350.1 eV are observed, while the Ca 2p peaks of 75% TiO2/HAp shift to 346.9 eV and 350.4 eV.32 Fig. 2d shows the corresponding high-resolution O 1s spectra of pure TiO2, HAp and TiO2/HAp. The two peaks at 529.7 eV and 530.9 eV in TiO2 are assigned to the Ti–O bonds and –OH groups, respectively.33 The two peaks at 530.8 eV and 532.4 eV in HAp are attributed to phosphate group (PO43−) and adsorbed water, respectively.34 The three peaks at 529.5 eV, 530.6 eV and 532.2 eV in 75% TiO2/HAp are assigned to lattice oxygen species TiO2 (Ti–O bonds), phosphate group (PO43−) and chemically adsorbed oxygen species of water, respectively.34
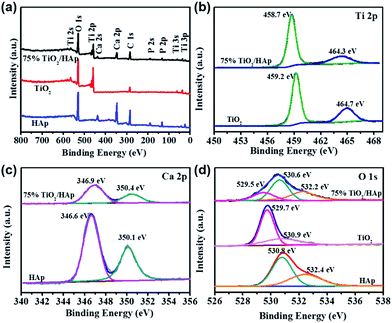 | ||
| Fig. 2 Survey XPS spectra (a) and high-resolution XPS spectra of Ti 2p (b), Ca 2p (c), and O 1s (d) of the as-prepared samples. | ||
3.2. Morphological analysis
The microcomposition and crystal structure of TiO2, HAp and TiO2/HAp were further analysed by TEM microscopy. Fig. 3a shows that the as-prepared TiO2 contains of intersection nanoparticles with an irregular shape. The size range of TiO2 is from 11 nm to 39 nm. In Fig. 3b the HAp power is composed of rod-like nanocrystals with the length of 32.17–127.23 nm and the width of 14.96–40.49 nm. Fig. 3c shows the TEM image of 75% TiO2/HAp composite. It is clearly seen that 75% TiO2/HAp possesses both irregular TiO2 nanoparticles and rod-like HAp. In particular, the size of HAp in 75% TiO2/HAp is the length of 63.40–49.32 nm and width of 19.51–15.73 nm, smaller as compared to pure HAp. The size change is probably ascribed to the addition of TiO2 precursor powers, which inhibits the growth of HAp. Miao Xu and coworker also reported that the addition of g-C3N4 can efficiently decrease the particle size of Ag2O in the g-C3N4/Ag2O composite preparation process.35 Fig. 3d shows the HRTEM image of the 75% TiO2/HAp. The lattice spacing of approximately 0.351 and 0.344 nm is ascribed to the (101) crystal plane of anatase-TiO2 nanoparticles (JCPDS, 04-0477) and the (002) crystal plane of rod-like hexagonal phase HAp (JCPDS, 09-0432), respectively. The distinct intersections of lattice fringes are observed in Fig. 3d, indicating an intimate contact is formed between TiO2 and HAp.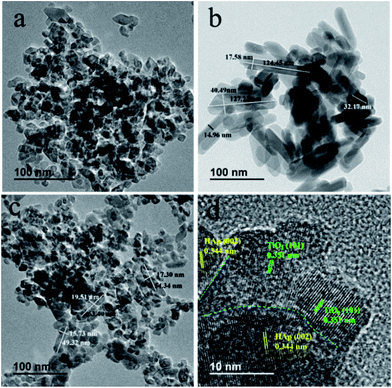 | ||
| Fig. 3 TEM images of pure TiO2 (a), HAp (b), 75% TiO2/HAp composite (c), and HRTEM images for 75% TiO2/HAp composite (d). | ||
The N2 adsorption–desorption isotherms and pore size distributions of samples are presented in Fig. S2.† The specific surface areas and average pore diameters of pure TiO2, HAp and TiO2/HAp composites are shown in Table 1. The BET specific surface areas of pure TiO2, HAp, 83% TiO2/HAp, 75% TiO2/HAp, 50% TiO2/HAp and are 73, 54, 98, 80 and 57 m2 g−1, respectively. The BET specific surface areas of except 50% TiO2/HAp are much higher than that of the pure TiO2 and HAp. It indicates that except 50% TiO2/HAp has the better photocatalytic activity, this may be due to the existence of a mass of surface active sites.36
| Sample | TiO2 | 83% TiO2/HAp | 75% TiO2/HAp | 50% TiO2/HAp | HAp |
|---|---|---|---|---|---|
| SBET (m2 g−1) | 73 | 98 | 80 | 57 | 54 |
| Pore diameter (nm) | 12.9 | 11.2 | 14.9 | 30.5 | 39.9 |
3.3. Photocatalytic activity and stability
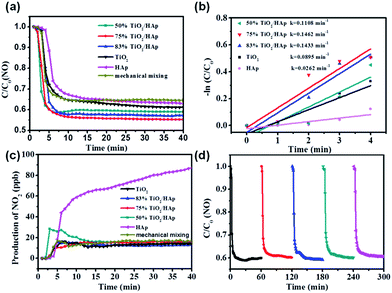
The photocatalytic degradation NO in air of the as-prepared samples is investigated. Fig. 4a shows the NO concentration vs. irradiation time curves of TiO2/HAp composites, mechanically mixed TiO2/HAp (mass ratios of TiO2 and HAp = 3![[thin space (1/6-em)]](https://www.rsc.org/images/entities/char_2009.gif) :
:![[thin space (1/6-em)]](https://www.rsc.org/images/entities/char_2009.gif) 1, the same ratio to 75% TiO2/HAp composite), pure TiO2 and HAp under solar light irradiation. All TiO2/HAp (50%, 75% and 83%) composites show better NO removal performance as compared to pure TiO2 and HAp. The NO removal ratio of 75% TiO2/HAp is the highest of 44.61% among the six samples. In order to make a clearly quantitative comparison, we used the Langmuir–Hinshelwood model in the initial time period to evaluate the rates of NO photodegradation. According to previous study,37 the linear plot between ln(C0/C) and irradiation time (t) indicates that photocatalytic NO degradation over the as-prepared samples follows first-order order kinetics. The rate constant (kNO) for TiO2, HAp, and TiO2/HAp composites are listed in Fig. 4b. The kNO (0.1462 min−1) of 75% TiO2/HAp is the highest among the samples. The kNO follows the order of 75% TiO2/HAp > 83% TiO2/HAp > 50% TiO2/HAp > TiO2 > HAp, which is different from the BET result, and their specific surface area follows the order of 83% TiO2/HAp > 75% TiO2/HAp > TiO2 > 50% TiO2/HAp > HAp. It indicates that the specific surface area is not the only reason accounting for the improved photocatalytic activity. The NO removal activity and reaction rate constants (kNO) over the 75% TiO2/HAp composite with and without light irradiation were shown in Fig. S3 and Table S2,† respectively. It's clear to see that the 75% TiO2/HAp composite shows excellent photocatalytic activity on NO removal, while the activity without light irradiation was ignorable. Furthermore, the NO removal ratio of the TiO2/HAp sample as-prepared through the mechanically mixed method is 35.36% under the same condition, which is lower than that of 75% TiO2/HAp. Therefore, 75% TiO2/HAp composite has better photocatalytic activity than simply mixing, indicating that the interfacial contact between TiO2 and HAp in the composite benefits the photocatalytic performance.
1, the same ratio to 75% TiO2/HAp composite), pure TiO2 and HAp under solar light irradiation. All TiO2/HAp (50%, 75% and 83%) composites show better NO removal performance as compared to pure TiO2 and HAp. The NO removal ratio of 75% TiO2/HAp is the highest of 44.61% among the six samples. In order to make a clearly quantitative comparison, we used the Langmuir–Hinshelwood model in the initial time period to evaluate the rates of NO photodegradation. According to previous study,37 the linear plot between ln(C0/C) and irradiation time (t) indicates that photocatalytic NO degradation over the as-prepared samples follows first-order order kinetics. The rate constant (kNO) for TiO2, HAp, and TiO2/HAp composites are listed in Fig. 4b. The kNO (0.1462 min−1) of 75% TiO2/HAp is the highest among the samples. The kNO follows the order of 75% TiO2/HAp > 83% TiO2/HAp > 50% TiO2/HAp > TiO2 > HAp, which is different from the BET result, and their specific surface area follows the order of 83% TiO2/HAp > 75% TiO2/HAp > TiO2 > 50% TiO2/HAp > HAp. It indicates that the specific surface area is not the only reason accounting for the improved photocatalytic activity. The NO removal activity and reaction rate constants (kNO) over the 75% TiO2/HAp composite with and without light irradiation were shown in Fig. S3 and Table S2,† respectively. It's clear to see that the 75% TiO2/HAp composite shows excellent photocatalytic activity on NO removal, while the activity without light irradiation was ignorable. Furthermore, the NO removal ratio of the TiO2/HAp sample as-prepared through the mechanically mixed method is 35.36% under the same condition, which is lower than that of 75% TiO2/HAp. Therefore, 75% TiO2/HAp composite has better photocatalytic activity than simply mixing, indicating that the interfacial contact between TiO2 and HAp in the composite benefits the photocatalytic performance.
In addition, the toxic intermediate NO2 generation is monitored simultaneously in the NO photocatalytic oxidation process. Fig. 4c shows that the amount of NO2 produced by TiO2 and TiO2/HAp (50%, 75% and 83%) composites was about 12.1–15.8 ppb, much lower than that of 87.5 ppb produced by HAp. It indicates that the addition of TiO2 is beneficial to inhibit the generation of NO2. The above results demonstrate that 75% TiO2/HAp shows the best photocatalytic activity.
The photocatalytic stability of 75% TiO2/HAp composite was evaluated. In Fig. 4d, the removal ratio of NO in the five cycle experiments was not significantly decreased, the maximum of 44.61% and the minimum of 41.02%. It suggests that the TiO2/HAp composites possess favorable stability and durability property.
3.4. Mechanism of photocatalytic activity improvement
Generally, the improved photocatalytic activity of catalysts is related to their optical absorption ability, target pollutant-catalyst adsorption/desorption ability, and the charge carriers' mobility. Fig. 5a shows the UV-vis diffuse reflectance spectroscopy to investigate the optical properties of the samples. The optical absorption edges and band gap energies (Eg) for the as-prepared samples are shown in Table S1.† It clear seen that the absorption edge of pure TiO2 is located at 413 nm, corresponding to band gap (Eg) of 3.01 eV, while the absorption edge of pure HAp is less than 250 nm. Compared with pure HAp, the absorption edge of the TiO2/HAp composites shows a significant red shift. Moreover, the absorption edge of the TiO2/HAp composites shows a slight blue shift compare with TiO2, which indicates that the TiO2/HAp composites possess higher oxidation capacity than pure TiO2.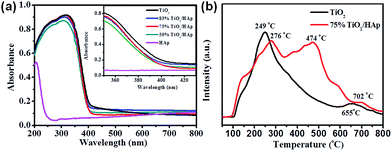 | ||
| Fig. 5 (a) UV-vis DRS spectra of pure TiO2, HAp, TiO2/HAp composite (inset is magnification spectra in the range of 300–500 nm), (b) TPD profiles of NO for pure TiO2 and 75% TiO2/HAp composite. | ||
In order to investigate the adsorption/desorption process of NO on the synthesized photocatalysts, temperature programmed desorption (TPD) tests were carried out. Fig. 5b shows that in the TPD curves of pure TiO2, there appear two desorption peaks located at around 249 °C and 655 °C, which were assigned to the desorption of NO and NO2–O2, respectively. While the 75% TiO2/HAp composite have three main peaks located at around 276 °C, 474 °C and 702 °C. Among them, the stronger desorption peak of NO at 474 °C was assigned to the stronger chemisorption bond between NO and surface OH groups of HAp.21
Photocurrent response was employed to investigate the separation efficiency of photo-generated electrons and holes. Fig. 6a shows the photocurrent–time curves of TiO2, HAp and TiO2/HAp composites under the simulated solar light irradiation. There is no photocurrent over pure HAp.24 The photocurrent density of 75% TiO2/HAp composites is 1.2 times as high as the pure TiO2, which indicates that more efficient separation of the photo-generated electron–hole pairs over 75% TiO2/HAp. According to the TEM and XPS results, the transfer and separation of the photo-generated carriers relate to the intimate interfacial contact between TiO2 and HAp, which improves photocatalytic activity of the TiO2/HAp.
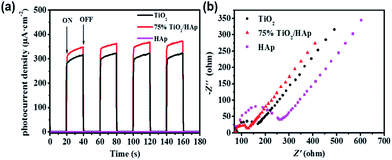 | ||
| Fig. 6 Transient photocurrent densities (a) and electrochemical impedance spectroscopy measurements (b) of pure TiO2, HAp, TiO2/HAp composite. | ||
Moreover, in order to explain the interfacial charge transfer and charge carriers recombination, electrochemical impedance spectroscopy (EIS) measurements of pure TiO2, HAp and 75% TiO2/HAp composite were carried out in dark. The arc in the Nyquist plot can reflect the charge transfer process, and the semicircle diameter semicircle represents the charge transfer resistance.38 Fig. 6b shows that 75% TiO2/HAp composite has the smallest diameter of arc in Nyquist plot comparing with pure TiO2 and HAp, which indicates that 75% TiO2/HAp improve electron migration and promote the separation of photo-generated carriers.
In order to further reveal the photocatalytic mechanism of TiO2/HAp composite, ESR was investigated to determine the active reaction groups. As shown in Fig. 7, the characteristic peaks of the DMPO-˙O2− adducts (originated form ˙O2− radicals) are observed from HAp, while signals of DMPO-˙OH (four characteristic peaks of DMPO-˙OH with an intensity ratio of 1![[thin space (1/6-em)]](https://www.rsc.org/images/entities/char_2009.gif) :
:![[thin space (1/6-em)]](https://www.rsc.org/images/entities/char_2009.gif) 2
2![[thin space (1/6-em)]](https://www.rsc.org/images/entities/char_2009.gif) :
:![[thin space (1/6-em)]](https://www.rsc.org/images/entities/char_2009.gif) 2
2![[thin space (1/6-em)]](https://www.rsc.org/images/entities/char_2009.gif) :
:![[thin space (1/6-em)]](https://www.rsc.org/images/entities/char_2009.gif) 1 originated form ˙OH radicals) adducts are weak, which is conformity with previous study.39 For pure TiO2, the appearance of DMPO-˙OH and the absence of DMPO-˙O2− signal indicate that NO is removed through oxidation by ˙OH radicals via pure TiO2. The band positions of TiO2 can be theoretically calculated by the following equations:40 EVB = χ − Ee + 0.5 Eg, ECB = EVB − Eg, where EVB is the valance band edge potential, ECB is conduction band edge potential, χ represents the electronegativity of the semiconductor, which is the geometric mean of the electronegativity of the constituent atoms, where the χ of TiO2 calculated to be 5.81 eV. Ee is the energy of free electrons on the hydrogen scale (∼4.5 eV),41,42 Eg is the band gap energy of the semiconductor, which is calculated from the results of UV-vis diffuse reflectance spectroscopy. The VB and CB potentials of pure TiO2 are calculated to be 2.81 eV and −0.20 eV, respectively. Because the CB potential of TiO2 is more positive than the redox potential of O2/˙O2− (−0.33 eV),43 the ˙O2− radicals could not be formed, which is consistent with the ESR results. The VB of TiO2 is more positive than that of OH/˙OH (1.99 eV),44 thus the photo-generated hole can oxidize OH into ˙OH radicals. The signal intensity of ˙OH radicals in 75% TiO2/HAp is significant stronger than that in pure TiO2 and HAp, which demonstrates that the combination of TiO2 and HAp can promote the generation of ˙OH radicals. Additionally, 75% TiO2/HAp have similar signal intensity of ˙O2− radicals to HAp, while it is significant stronger than that in pure TiO2. It may be because the electron state change of the PO43− groups in the surface of HAp in photocatalytic process under UV irradiation can result in the generation of ˙O2− radicals.5,23,45
1 originated form ˙OH radicals) adducts are weak, which is conformity with previous study.39 For pure TiO2, the appearance of DMPO-˙OH and the absence of DMPO-˙O2− signal indicate that NO is removed through oxidation by ˙OH radicals via pure TiO2. The band positions of TiO2 can be theoretically calculated by the following equations:40 EVB = χ − Ee + 0.5 Eg, ECB = EVB − Eg, where EVB is the valance band edge potential, ECB is conduction band edge potential, χ represents the electronegativity of the semiconductor, which is the geometric mean of the electronegativity of the constituent atoms, where the χ of TiO2 calculated to be 5.81 eV. Ee is the energy of free electrons on the hydrogen scale (∼4.5 eV),41,42 Eg is the band gap energy of the semiconductor, which is calculated from the results of UV-vis diffuse reflectance spectroscopy. The VB and CB potentials of pure TiO2 are calculated to be 2.81 eV and −0.20 eV, respectively. Because the CB potential of TiO2 is more positive than the redox potential of O2/˙O2− (−0.33 eV),43 the ˙O2− radicals could not be formed, which is consistent with the ESR results. The VB of TiO2 is more positive than that of OH/˙OH (1.99 eV),44 thus the photo-generated hole can oxidize OH into ˙OH radicals. The signal intensity of ˙OH radicals in 75% TiO2/HAp is significant stronger than that in pure TiO2 and HAp, which demonstrates that the combination of TiO2 and HAp can promote the generation of ˙OH radicals. Additionally, 75% TiO2/HAp have similar signal intensity of ˙O2− radicals to HAp, while it is significant stronger than that in pure TiO2. It may be because the electron state change of the PO43− groups in the surface of HAp in photocatalytic process under UV irradiation can result in the generation of ˙O2− radicals.5,23,45
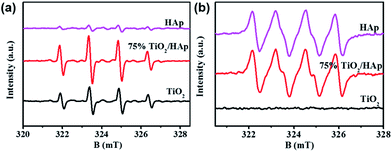 | ||
| Fig. 7 Electron spin resonance (ESR) spectra of radical adducts trapped for pure TiO2, HAp and 75% TiO2/HAp composite by (a) DMPO-˙OH and (b) DMPO-˙O2− under simulated solar-light irradiation. | ||
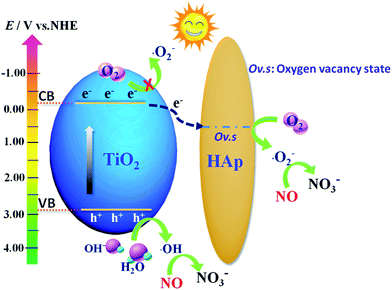
Based on the above analysis, the photocatalytic mechanism of TiO2/HAp composite under simulated solar light irradiation is showed in Fig. 8. TiO2 photocatalyst is excited by the simulated solar light irradiation to generate photoinduced electrons which are then transferred to the oxygen defect level from the electron state change of the PO43− groups in the surface of HAp.23 Then the electron captured by HAp reacts with the surrounding oxygen on the vacancies to form ˙O2− radicals.45 Next, a fraction of ˙O2− reacts with H2O and H+ to form H2O2, and then the electrons combines with H2O2 to produce ˙OH radicals.5 This transfer behavior of the electrons from TiO2 transfer to the vacancy on HAp enhances the separation and lengthens the lifetime of carriers, and inhibits the recombination of photo-generated electrons–holes pairs, and result in the generation of more ˙OH radicals. Simultaneously, the photoinduced hole on the VB of TiO2 reacts with H2O or OH− to form ˙OH radicals. At last, the ˙O2− and ˙OH radicals can further react with NOx to produce NO3−.
4. Conclusion
In summary, TiO2/HAp composite has been successfully synthesized by a facile hydrothermal method. The NO removal ratio of 75% TiO2/HAp is 44.61%, which is the highest among the pure TiO2, HAp and TiO2/HAp composites. The results of TPD analysis, photocurrent generation and EIS measurements demonstrated that the enhanced photocatalytic activity of TiO2/HAp composites can be ascribed to stronger chemisorption for NO, higher separation efficiency and faster transfer of the photo-generated electron–holes pairs. The ESR results revealed that ˙O2− and ˙OH radicals as the major active species in the photocatalytic reaction process. The photocatalytic removal mechanism of NO over the TiO2/HAp composites is illustrated in detail. This study suggests that 75% TiO2/HAp composites with the highest photocatalytic activity is considered to be a promising air-cleaning material.Acknowledgements
This research was financially supported by the National Science Foundation of China (41573138, 41401567), the Key Project of International Cooperation of the Chinese Academy of Sciences (GJHZ1543). Yu Huang is also supported by the “Hundred Talent Program” of the Chinese Academy of Sciences.Notes and references
- Y. J. Sun, Z. W. Zhao, F. Dong and W. Zhang, Phys. Chem. Chem. Phys., 2015, 17, 10380–10390 Search PubMed.
- Q. Guo, Y. He, T. Sun, Y. Wang and J. Jia, J. Hazard. Mater., 2014, 276, 371–376 CrossRef CAS PubMed.
- Y. F. Xia, B. H. Lu, N. Liu, Q. L. Chen, S. J. Li and W. Li, Bioresour. Technol., 2013, 149, 184–190 CrossRef CAS PubMed.
- Z. Liu, Y. Yi, S. Zhang, T. Zhu, J. Zhu and J. Wang, Catal. Today, 2013, 216, 76–81 CrossRef CAS.
- Y. Huang, Y. Gao, Q. Zhang, J. J. Cao, R. J. Huang, W. Ho and S. C. Lee, Appl. Catal., A, 2016, 515, 170–178 CrossRef CAS.
- T. S. Natarajan, J. Y. Lee, H. C. Bajaj, W. K. Jo and R. J. Tayade, Catal. Today, 2016, 282, 13–23 CrossRef.
- Y. Liu, C. Y. Liu, J. H. Wei, R. Xiong, C. X. Pan and J. Shi, Appl. Surf. Sci., 2010, 256, 6390–6394 CrossRef CAS.
- H. Liu, T. Lv, C. Zhu and Z. Zhu, Sol. Energy Mater. Sol. Cells, 2016, 153, 1–8 CrossRef CAS.
- D. Friedmann, C. Mendive and D. Bahnemann, Appl. Catal., B, 2010, 99, 398–406 CrossRef CAS.
- H. Wang, J. L. Faria, S. Dong and Y. Chang, Mater. Sci. Eng., B, 2012, 177, 913–919 CrossRef CAS.
- Q. Lu, Z. Lu, Y. Lu, L. Lv, Y. Ning, H. Yu, Y. Hou and Y. Yin, Nano Lett., 2013, 13, 5698–5702 CrossRef CAS PubMed.
- J. Balbuena, G. Carraro, M. Cruz, A. Gasparotto, C. Maccato, A. Pastor, C. Sada, D. Barreca and L. Sánchez, RSC Adv., 2016, 6, 74878–74885 RSC.
- N. Mohaghegh, B. Eshaghi, E. Rahimi and M. R. Gholami, J. Mol. Catal. A: Chem., 2015, 406, 152–158 CrossRef CAS.
- J. Zhang, L. Huang, L. Yang, Z. Lu, X. Wang, G. Xu, E. Zhang, H. Wang, Z. Kong, J. Xi and Z. Ji, J. Alloys Compd., 2016, 676, 37–45 CrossRef CAS.
- M. Gar Alalm, A. Tawfik and S. Ookawara, J. Environ. Chem. Eng., 2016, 4, 1929–1937 CrossRef CAS.
- M. R. Eskandarian, M. Fazli, M. H. Rasoulifard and H. Choi, Appl. Catal., B, 2016, 183, 407–416 CrossRef CAS.
- J. Matos, J. Laine and J. M. Herrmann, J. Catal., 2001, 200, 10–20 CrossRef CAS.
- S. K. Padmanabhan, S. Pal, E. Ul Haq and A. Licciulli, Appl. Catal., A, 2014, 485, 157–162 CrossRef CAS.
- A. Pal, T. K. Jana and K. Chatterjee, Mater. Res. Bull., 2016, 76, 353–357 CrossRef CAS.
- M. Buchi Suresh, P. Biswas, V. Mahender and R. Johnson, Mater. Sci. Eng., C, 2017, 70, 364–370 CrossRef CAS PubMed.
- Y. Komazaki, H. Shimizu and S. Tanaka, Atmos. Environ., 1999, 33, 4363–4371 CrossRef CAS.
- X. Fu, J. Wang, D. Huang, S. Meng, Z. Zhang, L. Li, T. Miao and S. Chen, ACS Catal., 2016, 6, 957–968 CrossRef CAS.
- H. Nishikawa, J. Mol. Catal. A: Chem., 2003, 206, 331–338 CrossRef CAS.
- Y. Chai, J. Ding, L. Wang, Q. Liu, J. Ren and W. L. Dai, Appl. Catal., B, 2015, 179, 29–36 CrossRef CAS.
- L. S. Birks and H. Friedman, J. Appl. Phys., 1946, 17, 687 CrossRef CAS.
- Q. Xu, J. Feng, L. Li, Q. Xiao and J. Wang, J. Alloys Compd., 2015, 641, 110–118 CrossRef CAS.
- G. Sheng, L. Qiao and Y. Mou, J. Environ. Eng., 2011, 137, 611–616 CrossRef CAS.
- N. Pramanik, S. Mohapatra, P. Bhargava and P. Pramanik, Mater. Sci. Eng., C, 2009, 29, 228–236 CrossRef CAS.
- R. M. Tripathi, N. Kumar, A. Singh Bhadwal, R. K. Gupta, B. R. Shrivastav and A. Shrivastav, Mater. Lett., 2015, 140, 64–67 CrossRef CAS.
- W. Li, Y. Tian, H. Li, C. Zhao, B. Zhang, H. Zhang, W. Geng and Q. Zhang, Appl. Catal., A, 2016, 516, 81–89 CrossRef CAS.
- F. Duo, Y. Wang, C. Fan, X. Mao, X. Zhang, Y. Wang and J. Liu, Mater. Charact., 2015, 99, 8–16 CrossRef CAS.
- S. Abbasi, M. R. Bayati, F. Golestani-Fard, H. R. Rezaei, H. R. Zargar, F. Samanipour and V. Shoaei-Rad, Appl. Surf. Sci., 2011, 257, 5944–5949 CrossRef CAS.
- K. Li, S. Gao, Q. Wang, H. Xu, Z. Wang, B. Huang, Y. Dai and J. Lu, ACS Appl. Mater. Interfaces, 2015, 7, 9023–9030 CAS.
- M. Salarian, W. Z. Xu, Z. Wang, T. K. Sham and P. A. Charpentier, ACS Appl. Mater. Interfaces, 2014, 6, 16918–16931 CAS.
- M. Xu, L. Han and S. Dong, ACS Appl. Mater. Interfaces, 2013, 5, 12533–12540 CAS.
- H. Y. Zhu, R. Jiang, Y. Q. Fu, R.-R. Li, J. Yao and S. T. Jiang, Appl. Surf. Sci., 2016, 369, 1–10 CrossRef CAS.
- Z. Wang, Y. Huang, W. Ho, J. Cao, Z. Shen and S. C. Lee, Appl. Catal., B, 2016, 199, 123–133 CrossRef CAS.
- W. Teng, X. Li, Q. Zhao and G. Chen, J. Mater. Chem. A, 2013, 1, 9060 CAS.
- H. Nishikawa and K. Omamiuda, J. Mol. Catal. A: Chem., 2002, 179, 193–200 CrossRef CAS.
- Q. Wang, D. Jiao, J. Lian, Q. Ma, J. Yu, H. Huang, J. Zhong and J. Li, J. Alloys Compd., 2015, 649, 474–482 CrossRef CAS.
- T. B. Li, G. Chen, C. Zhou, Z. Y. Shen, R. C. Jin and J. X. Sun, Dalton Trans., 2011, 40, 6751–6758 RSC.
- F. Dong, Y. Sun, M. Fu, Z. Wu and S. C. Lee, J. Hazard. Mater., 2012, 219–220, 26–34 CrossRef CAS PubMed.
- W. Liu, M. Wang, C. Xu, S. Chen and X. Fu, Mater. Res. Bull., 2013, 48, 106–113 CrossRef CAS.
- G. Li, D. Q. Zhang, J. C. Yu and M. K. H. Leung, Environ. Sci. Technol., 2010, 44, 4276–4281 CrossRef CAS PubMed.
- M. Reddy, A. Venugopal and M. Subrahmanyam, Appl. Catal., B, 2007, 69, 164–170 CrossRef CAS.
Footnote |
| † Electronic supplementary information (ESI) available. See DOI: 10.1039/c7ra02157g |
| This journal is © The Royal Society of Chemistry 2017 |

