
 Open Access Article
 This Open Access Article is licensed under a
 Creative Commons Attribution 3.0 Unported Licence
Effects of C/N in the substrate on the simultaneous production of polyhydroxyalkanoates and extracellular polymeric substances by Haloferax mediterranei via kinetic model analysis†
You-Wei Cui *,
Yun-Peng Shi and
Xiao-Yu Gong
*,
Yun-Peng Shi and
Xiao-Yu Gong
National Engineering Laboratory for Advanced Municipal Wastewater Treatment and Reuse Technology, Beijing University of Technology, Beijing 100124, China. E-mail: cyw@bjut.edu.cn
First published on 29th March 2017
Abstract
The extreme halophilic archaeon Haloferax mediterranei can produce polyhydroxyalkanoates (PHAs) and extracellular polymeric substances (EPSs) simultaneously. In this study, we studied the influence of the ratio of carbon and nitrogen concentration (C/N) during feeding on PHA and EPS production in open fermentation by means of the developed model. The results indicated that nitrogen availability had significant effects on stain growth and PHA and EPS synthesis. The PHA volumetric productivity, EPS volumetric productivity and biomass increased with the increase of nitrogen concentration. Haloferax mediterranei synthesized EPSs with a faster rate than that for PHAs, indicating that EPSs were synthesized as priority energy and food reserves by Haloferax mediterranei. The deficiency of nitrogen promoted PHA accumulation. The highest PHA cell content of 47.22% mg PHA per mg CDW was found at a C/N ratio of 35. In contrast, the highest EPS productivity of 733.58 mg L−1 was observed at a C/N ratio of 5. At a C/N ratio of 35, the percentage of the PHA yield coefficient in the sum of the PHA and EPS yield coefficient was 92.8%, indicating that the majority of the carbon was converted to PHA rather than EPS. Supported by the carbon flow and PHA and EPS productivity, PHA was the main product of Haloferax mediterranei despite the C/N ratio. The study proved that controlling the C/N ratio during feeding could be one solution to adjust the carbon flow to PHA and EPS synthesis by Haloferax mediterranei.
1. Introduction
Polyhydroxyalkanoates (PHAs), which serve as intracellular carbon and energy reserves under unbalanced or non-optimal growth conditions, are polymers commonly synthesized by various eubacteria and some haloarchaeal species.1,2 PHA properties are similar to those of petroleum-based plastics3,4 except that it can be biologically degraded.5 This characteristic has attracted attention as it could be used as a potential sustainable substitute for plastics6 or as the base material for other products such as package films, bone replacements, artificial blood vessels, and scaffold materials.1,7–9Haloferax mediterranei, an extreme halophilic archaeon, is reported to have the ability to accumulate PHAs.10 Compared to the widely used freshwater eubacteria as fermentation bacteria, H. mediterranei has more advantages for PHA production.11 Firstly, H. mediterranei was reported to have the potential of high-content PHA accumulation as reported.12 Secondly, H. mediterranei is capable of synthesizing poly(3-hydroxybutyrate-co-3-hydroxyvalerate) or PHBV, which is a more valuable and more applicable PHA than poly(3-hydroxybutyrate) or PHB due to its low melting point and strong plasticity.13 Thirdly, since H. medierranei depends on salts to maintain its cell wall stability, it can be incubated in an open unsterile fermentation setup, reducing aseptic operational expenses.14 Finally, the recovery of PHAs from cells is easier because halophilic cell walls lyse in the absence of salt,15 which reduces the amount of organic solvents required.
Studies found that H. mediterranei also produces extracellular polymeric substances (EPSs) in parallel to synthesizing intracellular polymers when degrading the substrate.16–18 EPSs are a complex mixture of high molecular weight polymers19 excreted by microorganisms through lysis and hydrolysis.6 However, the energy and reducing power derived from the degradation of carbon sources are divided into these two biological processes, resulting in low PHA production. Because both PHA and EPS production need extracellular carbon sources and energy, EPS synthesis may reduce PHA production.
Research has demonstrated that EPS synthesis could lead to decreased PHA production. Koller et al.16 found that the formation of EPSs and PHAs in the H. mediterranei strain DSM 1411 competed for the available exogenous carbon source. EPS production thus negatively affected the conversion yields of PHA biosynthesis since 70% of the total energy reserves were put into EPS production, resulting in the shift of carbon flow towards EPS instead of PHA production. Fig. 1 shows the possible pathways of PHBV and EPS synthesis in H. mediterranei.17,20 The factors which can lead to different synthesizing ratios of PHAs and EPSs may influence the carbon flow between PHAs and EPSs, such as nitrogen. Zhao et al.17 developed a novel EPS-mutant H. mediterranei strain by knocking out the gene cluster involved in EPS biosynthesis of the wild-type strain and demonstrated that PHA production in the engineered H. mediterranei strain was enhanced by up to 20% compared to that in the wild-type strain. This research demonstrates that EPS synthesis indeed negatively impacts PHA production of H. mediterranei. However, possible mechanisms to control the competitive production between EPSs and PHAs in wild-type H. mediterranei remain unexplored. If PHAs are targeted to be produced using wild-type H. mediterranei, it would be necessary to control EPS production during fermentation to save costs for substrate utilization and biopolymer recovery. Therefore, exploring the potential factors regulating the competition between PHAs and EPSs is of importance to increase the yield of the desired material.
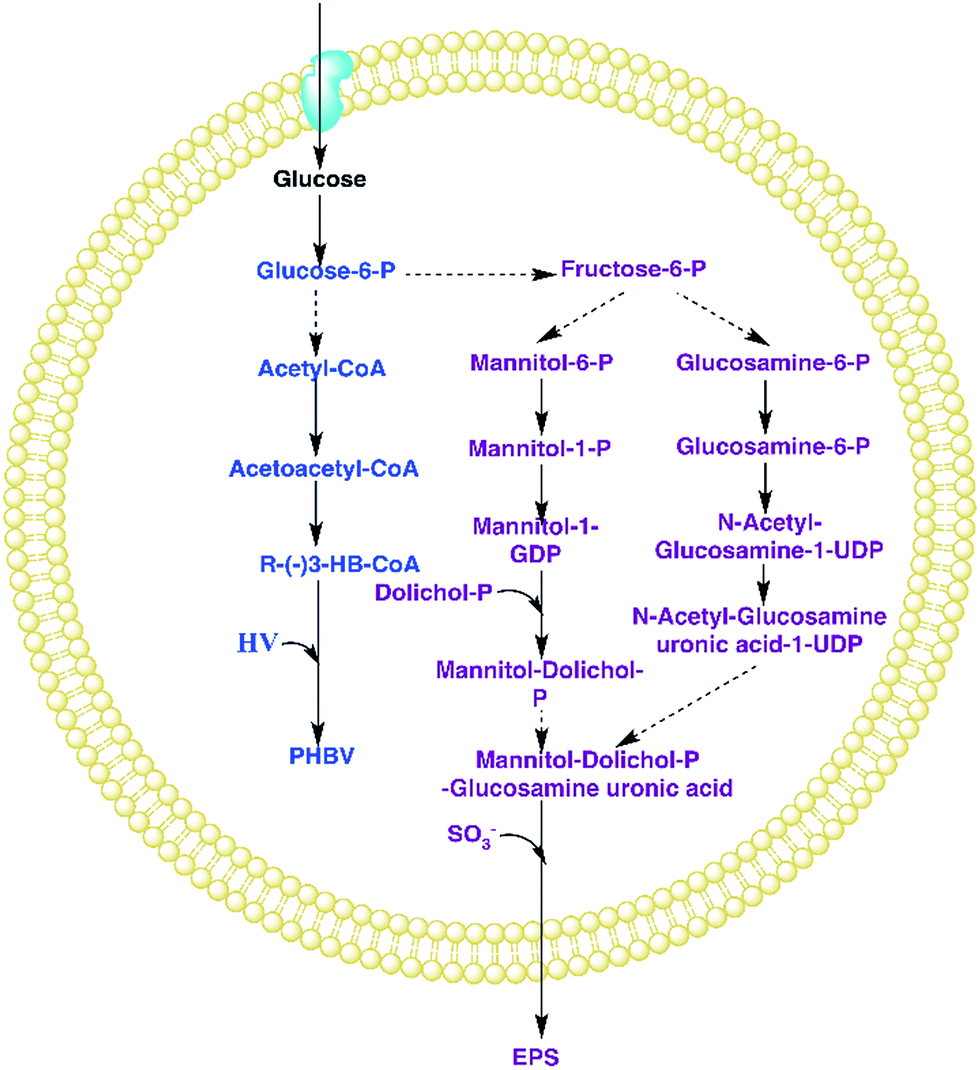 | ||
| Fig. 1 PHA and EPS synthesis on glucose by H. mediterranei. First of all, glucose enters into the cell and becomes glucose-6-P by combining with phosphoric acid. Glucose-6-P has two metabolic pathways: (1) the glucose-6-P can synthesize acetyl-CoA which later becomes PHBV; (2) glucose-6-P transforms into fructose-6-P first, and then synthesizes EPS by several pathways. The main intermediate product between PHA and EPS is glucose-6-P, which is the dominant factor that affects PHBV and EPS production by glucose. | ||
This study focuses on the effects of the ratio of supplemental carbon and nitrogen (C/N) on the competitive productions of the intracellular PHBV and the extracellular EPS by H. mediterranei during incubation. The relationship between the production of the two polymers was evaluated as the function of C/N during the feeding. The focus of the investigation was to unravel the dynamics of PHA and EPS synthesis, which was illustrated by both mathematical models and kinetic analysis.
2. Methods and materials
2.1 Strain cultivation
Haloferax mediterranei ATCC 33500 was purchased from the China General Microbiological Culture Collection Center (CGMCC, Chaoyang District, Beijing, China). The pure strain was maintained on CM (complete medium) solid plates containing 7.5 g L−1 casamino acid, 10 g L−1 yeast extract, 3 g L−1 sodium citrate, 20.0 g L−1 MgSO4·7H2O, 2 g L−1 KCl, 10 ppm Fe2+, 200 g L−1 NaCl, and 15 g L−1 agar (direction from CGMCC). The same liquid medium without agar was used to inoculate strains for later experiments. The inoculants were cultivated in 120 mL of the medium in 500 mL flasks, which were placed in a rotary shaker at 37 °C and 180 rpm for 48 h, where strains were allowed to reach the late phase of exponential growth.2.2 Batch experiments
To evaluate the influence of different C/N ratios on PHA and EPS production, we used four identical batch reactors with a working volume of 1.2 L. The control feeding was composed of 150 g L−1 NaCl, 13 g L−1 MgCl2·6H2O, 0.55 g L−1 CaCl2, 4 g L−1 KCl, 20 g L−1 MgSO4·7H2O, 10 mg L−1 Fe2+, 0.4 g L−1 KH2PO4, 0.25 g L−1 NaHCO3, 0.5 g L−1 NaBr, 10 g L−1 glucose, and 1 mL SL-6 trace element solution.17 Another three types of feeding with different N concentrations were prepared by adding NH4Cl to the control feeding with final NH4Cl concentrations of 0.475, 1.950, and 7.640 g L−1. A total of 60 mL of enriched strain after 48 h amplification was further inoculated in different SBRs (Sequencing Batch Reactors), and the four feedings were added separately to each SBR. The pH-value of the mixed liquid in the SBRs was automatically adjusted to 7.5 ± 0.3 by adding either 1 mol L−1 HCl or NaOH when needed through a pH controller (SC-200, Si Chen Apparatus Science and Technology limited Company, China) throughout the experiments. The dissolved oxygen (DO) in the mixed liquid was sustained at 100% via an aeration device, and the DO was monitored by WTW (Multi 3420 SET B, Germany). The temperature on the other hand was maintained at 40 °C, using a heated water bath (HH-4, Guo Hua Electric Appliance Company, China). The batch experiments lasted for 72 hours. All the above-mentioned treatments were carried out twice in parallel and their mean values were taken as the final values.2.3 Analysis methods
During the batch experiments, regularly mixed liquid samples were collected to determine the cell dry weight (CDW) of the PHAs and EPSs. To determine the CDW, 5 mL of the sampled liquid culture was centrifuged at 6000 rpm for 5 min, then the supernatant was discarded. The remaining pellet was washed twice with distilled water to remove salts. The pellet was dried in an oven at 105 °C to a constant mass. The PHA content in the cells was measured following the method by Oehmen et al.21 with gas chromatography analysis (7890A, Agilent, USA). For PHA detection, a 30 mL sample was collected from the reactor and centrifuged at 6000 rpm for 10 min. The supernatant was discarded and the pellets were collected. The pellets were then dissolved in distilled water to the initial volume, and 1 mL of sodium hypochlorite solution (4%) was added to deactivate the cells. The inactive cells were washed again twice with distilled water and dried in a freeze dryer. The dried sample was used for PHA measurement. The chromatograph was operated with a DB-1 capillary column (Agilent, USA) connected to a flame ionization detector (FID). Nitrogen gas was used as the carrier gas, and the chloroform-dissolved sample (1 μL) was injected using an autosampler. The injector and detector temperatures were set at 250 and 300 °C respectively. The PHA content was expressed as a percentage of CDW.The sonication-cation exchange resin (CER) method22 was used to extract the EPSs, with some adjustments. Firstly, a 20 mL sample of the mixed liquid from the reactor was collected, centrifuged at 6000 rpm for 10 min, and the pellets were recovered. The collected pellets were washed with distilled water and dissolved in distilled water to the initial volume. The resuspended cells were lysed by sonicating at 40 kHz for 2 min, followed by centrifugation at 6000 rpm for 3 min. The supernatant was filtered through a 0.45 μm filter to recover the loose-bound EPSs (LB-EPSs). The pellets meanwhile were dissolved in distilled water back to the initial volume and mixed with the cation exchange resin, and stirred at 200 rpm for 1 h with a magnetic stirrer (IKA, Germany). The mixed liquid was centrifuged at 6000 rpm for 3 min and the supernatant was collected. The resulting supernatant was again filtered through a 0.45 μm filter to recuperate the tightly-bound EPSs (TB-EPSs). The total EPS content was then determined from the sum of the LB-EPSs and TB-EPSs.
Proteins in the EPSs were detected using the modified Lowry method, the DNA with N-phenylaniline, and the total carbohydrate using the anthrone-sulfuric acid method.16
2.4 Metabolic model development
A metabolic model was developed based on the Monod equation to explain the relationship between PHAs and EPSs. The following assumptions and considerations were made.(1) Competition between PHAs and EPSs for external carbon only occurs in the feast phase, thus, metabolic reactions during the famine phase were ignored.
(2) In the existing models, cell catabolism was not usually included for simplification.22 Since cells undergo anabolism and catabolism during growth phases, it was assumed that the biomass would be the outcome of both growth and decay and that the cell growth and decay was then integrated into our model. So, cell catabolism was fully considered for the first time due to its possible impacts on EPS and PHA accumulation.
(3) Previous studies have demonstrated that H. mediterranei could simultaneously use PHAs and EPSs when they are synthesized.13 Thus, the production of PHAs and EPSs was deemed as a balance between synthesis and utilization. Until now, the simultaneous usage of PHAs and EPSs when they are synthesized was never included into the available metabolism models. This study’s model simultaneously combined the usage of PHAs and EPSs into the synthesis process for the first time.
Eqn (1) expresses the substrate uptake using regular kinetics:
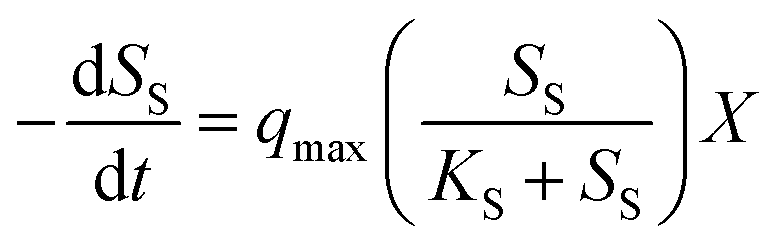 | (1) |
Eqn (2) describes Haloferax mediterranei growth:
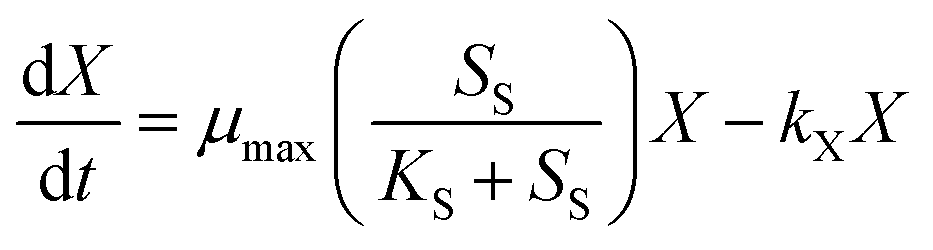 | (2) |
PHA accumulation can be described by substrate catabolism, and PHA catabolism in the feast phase can be described using biomass concentration. As such, eqn (3) expresses the PHA metabolic equation:
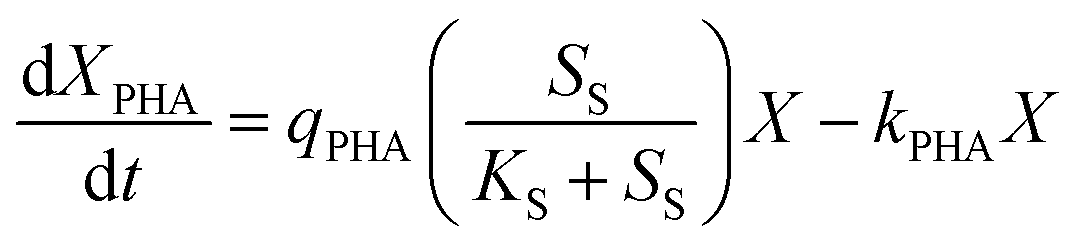 | (3) |
Eqn (4) expresses the EPS metabolic expression:
 | (4) |
3. Results and discussion
3.1 Model validation and calibration
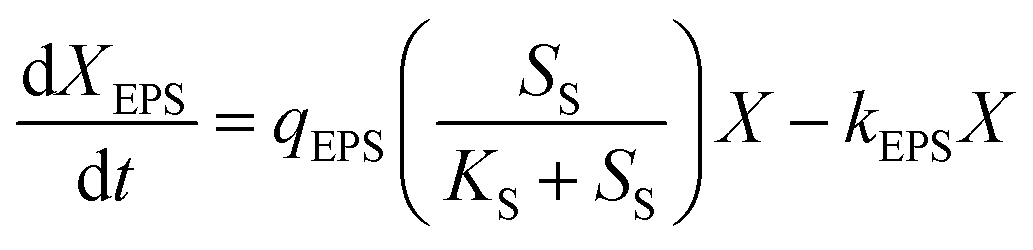
The experimental data in Fig. 2 show profiles of the CDW, and EPS and PHA production along with the substrate consumption during batch culture incubations at different C/N ratios. These data were compared to the fitted data derived from eqn (1)–(4). The results show that the CDW, and PHA and EPS content increased gradually with the COD (Chemical Oxygen Demand) consumption in the feast phase. The maximal substrate consumption, CDW, and PHA and EPS production decreased with an increasing C/N ratio. To evaluate the concurrence of the actual and predicted values, we compared the measured and modeled data in the feast phase (Fig. 3). Fig. 3 shows that the COD, CDW, EPS and PHA data fit well with the R2 values of 0.97, 0.96, 0.95, and 0.89, respectively. This illustrates that our model fits well with the experimental data generated at different C/N ratios, describing the kinetic behavior of H. mediterranei at the C/N ratios investigated in this study. Table 1 summarizes the kinetic parameters of these biological processes. The decay coefficients of PHA and EPS were very similar to that of the biomass, proving that the reuse processes of PHAs and EPSs occurred alongside their synthesis.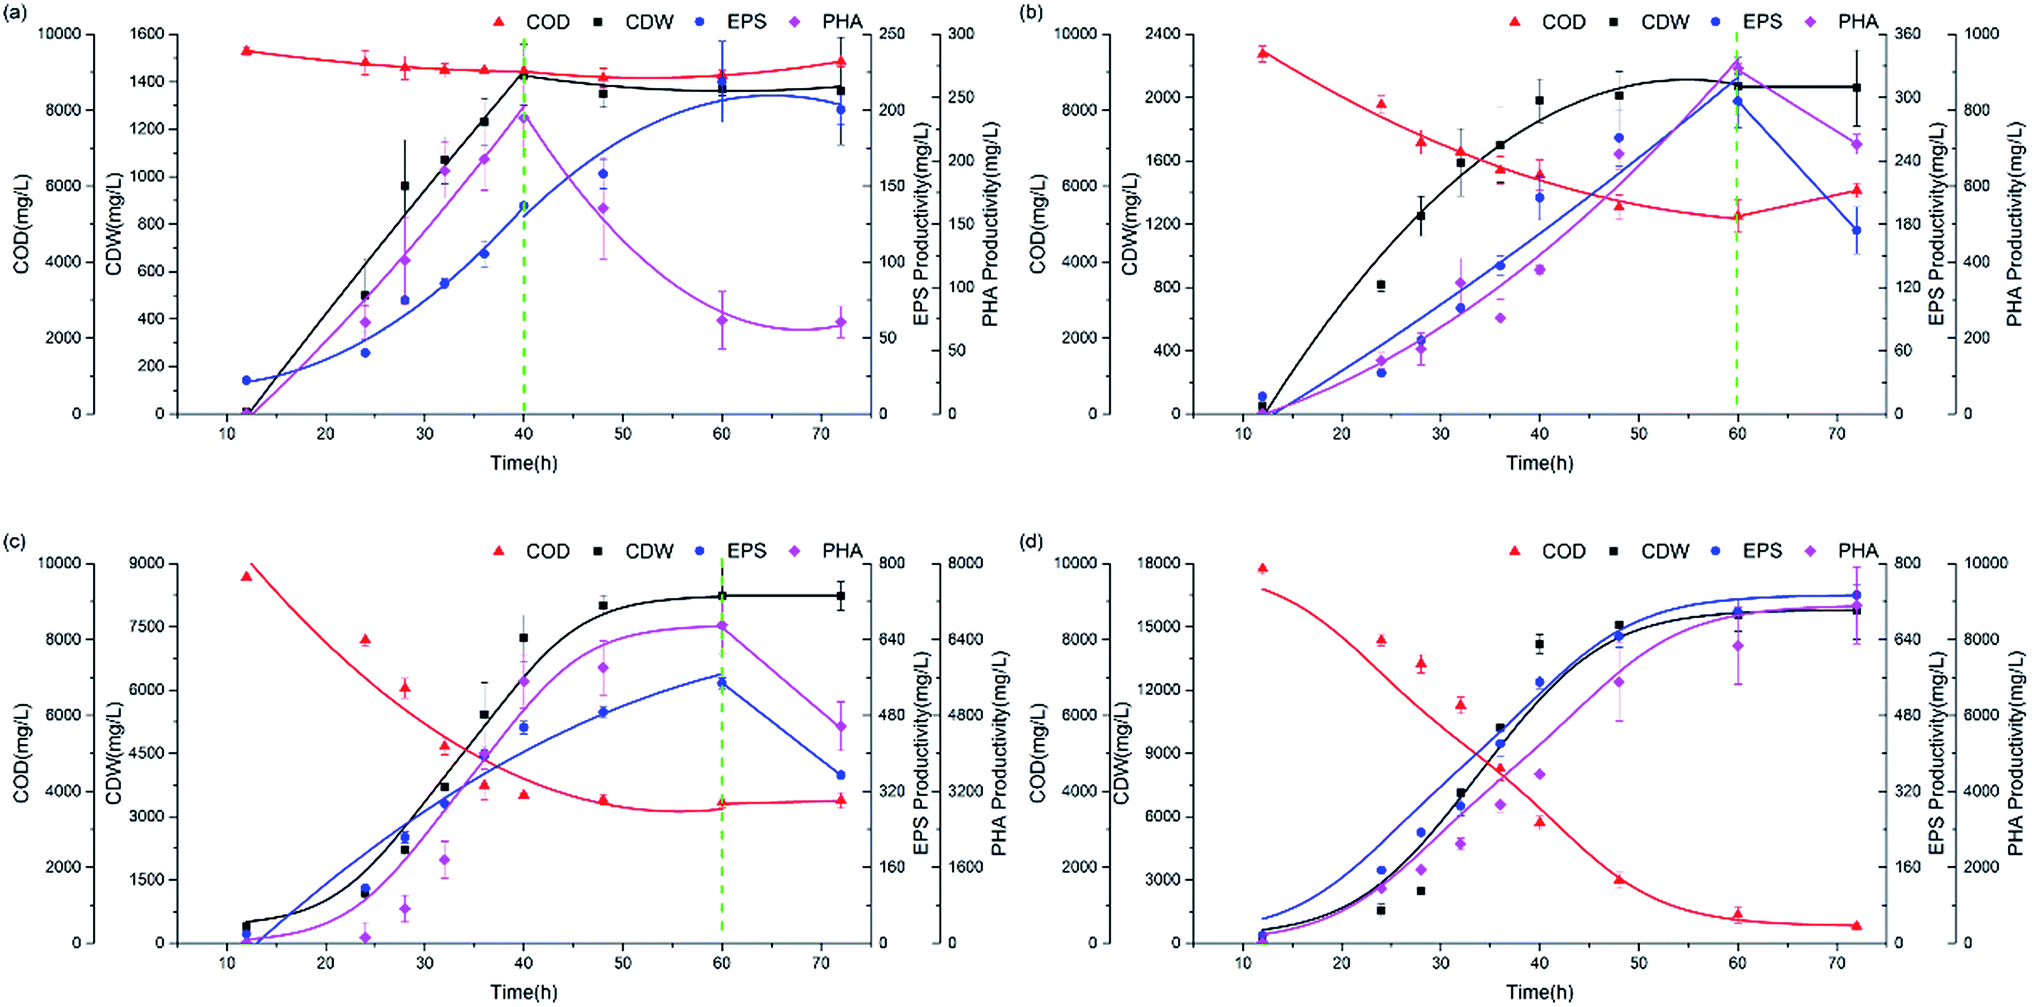 | ||
| Fig. 2 Profiles of the CDW, and EPS and PHA production along with the process of substrate consumption under all C/N ratios. (a) C/N = 65, (b) C/N = 35, (c) C/N = 15, (d) C/N = 5. | ||
 | ||
| Fig. 3 Calibration between the measured value and modeled value. (a) COD, (b) CDW, (c) EPS, (d) PHA. | ||
| C/N | KS, mg L−1 | qmax, h−1 | μmax, h−1 | kX, h−1 | qPHA, h−1 | kPHA, h−1 | qEPS, h−1 | kEPS, h−1 | YPHA/S, mg L−1 mg−1 L | YEPS/S, mg L−1 mg−1 L |
|---|---|---|---|---|---|---|---|---|---|---|
| 5 | 127.4 | 0.36 | 0.12 | 0.002 | 0.0018 | 0.0001 | 0.025 | 0.0002 | 0.861 | 0.096 |
| 15 | 127.4 | 0.40 | 0.095 | 0.001 | 0.0013 | 0.0001 | 0.015 | 0.0002 | 0.743 | 0.089 |
| 35 | 127.4 | 0.14 | 0.099 | 0.002 | 0.0170 | 0.0002 | 0.014 | 0.0002 | 0.313 | 0.059 |
| 65 | 127.4 | 0.05 | 0.067 | 0.003 | 0.0019 | 0.0003 | 0.013 | 0.0003 | 0.232 | 0.22 |
3.2 Effect of the C/N ratio on biological processes
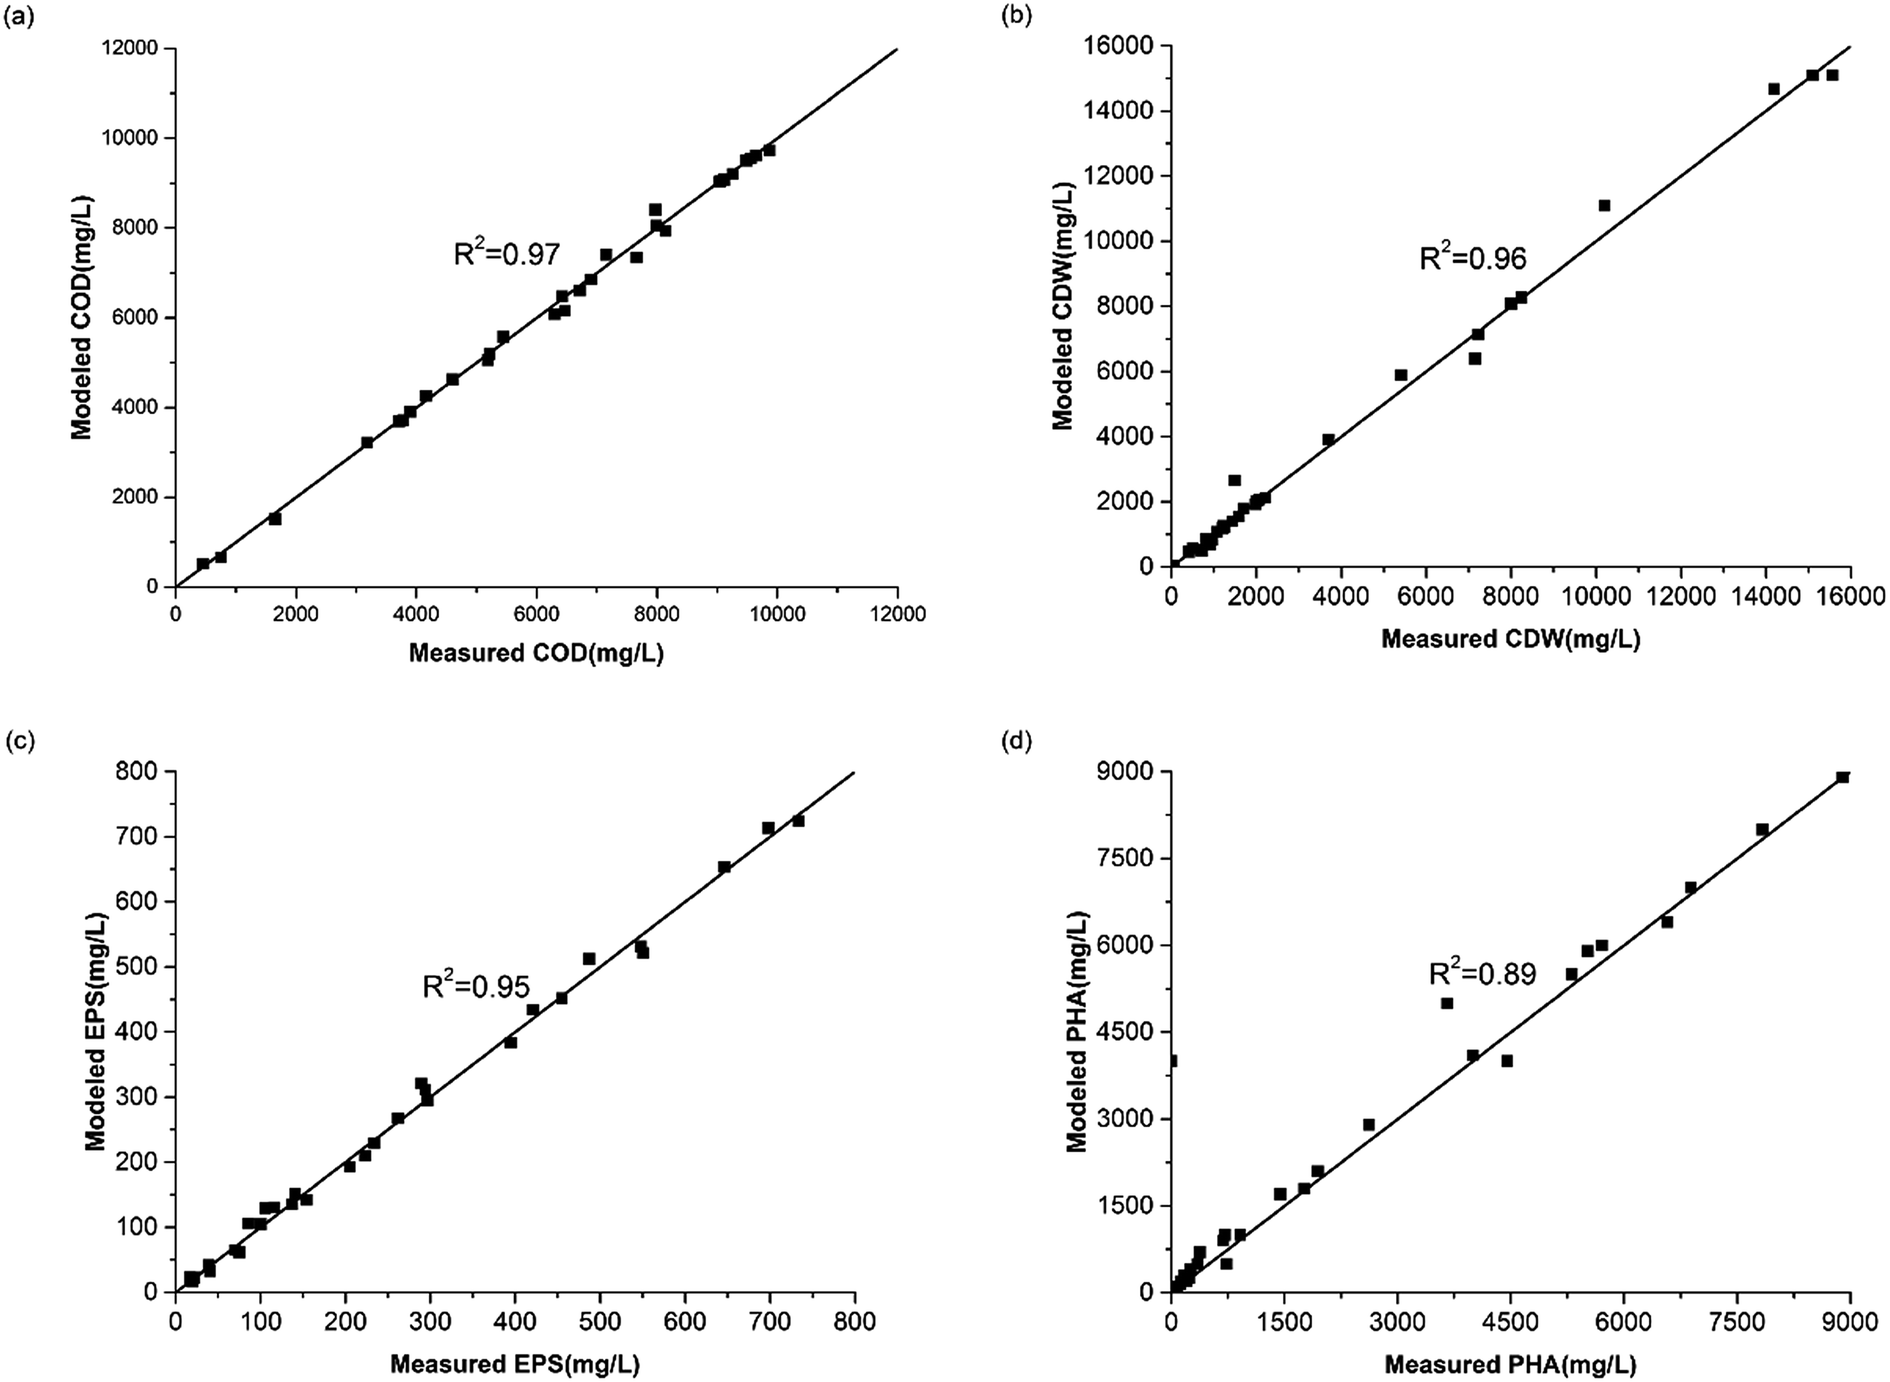
![[thin space (1/6-em)]](https://www.rsc.org/images/entities/char_2009.gif) 800 mg L−1 at C/N ratios of 65, 35, 15 and 5, respectively. Results of the batch experiments indicated that growth of H. mediterranei was significantly affected by nitrogen availability when carbon sources remained the same. Patterns at a C/N ratio of 15 represented the expected normal growth of H. mediterranei. In comparison with the other ratios, it indicates that the CDW is negatively correlated with the C/N ratio regardless of the shortage and excess of nitrogen. The observed increase of the CDW in the control experiment (C/N = 65) was due to the remaining nitrogen which came from the medium of the inoculating phase where the total residual nitrogen concentration was 143.5 mg L−1, and the recycled nitrogen came from other polymers, including PHAs and EPSs. When the nitrogen content was excessive (C/N = 5), the CDW reached a higher value than that under the normal conditions (C/N = 15) because the carbon source became a limiting factor. This means that the COD consumption was maximized and produced the most number of cells. This is in agreement with a previous study showing that cell growth is highly dependent on nitrogen concentration, and a higher nitrogen concentration could lead to higher growth.23 Deficiency in nitrogen supply could lead to decreased activity of cells, because nitrogen is necessary for protein synthesis.24 However, oxidative phosphorylation, which is the main pathway for ATP production under aerated conditions,25 was also limited under this condition. The decrease of ATP can inhibit active transportation and accelerate endogenous respiration, which encourages cell lysis as a consequence. Therefore, these could lead to a lower CDW under nitrogen-limited conditions.
800 mg L−1 at C/N ratios of 65, 35, 15 and 5, respectively. Results of the batch experiments indicated that growth of H. mediterranei was significantly affected by nitrogen availability when carbon sources remained the same. Patterns at a C/N ratio of 15 represented the expected normal growth of H. mediterranei. In comparison with the other ratios, it indicates that the CDW is negatively correlated with the C/N ratio regardless of the shortage and excess of nitrogen. The observed increase of the CDW in the control experiment (C/N = 65) was due to the remaining nitrogen which came from the medium of the inoculating phase where the total residual nitrogen concentration was 143.5 mg L−1, and the recycled nitrogen came from other polymers, including PHAs and EPSs. When the nitrogen content was excessive (C/N = 5), the CDW reached a higher value than that under the normal conditions (C/N = 15) because the carbon source became a limiting factor. This means that the COD consumption was maximized and produced the most number of cells. This is in agreement with a previous study showing that cell growth is highly dependent on nitrogen concentration, and a higher nitrogen concentration could lead to higher growth.23 Deficiency in nitrogen supply could lead to decreased activity of cells, because nitrogen is necessary for protein synthesis.24 However, oxidative phosphorylation, which is the main pathway for ATP production under aerated conditions,25 was also limited under this condition. The decrease of ATP can inhibit active transportation and accelerate endogenous respiration, which encourages cell lysis as a consequence. Therefore, these could lead to a lower CDW under nitrogen-limited conditions.
 | ||
| Fig. 4 Profiles of the maximum CDW value (a) and the specific growth rate changing tendency (b) under all C/N ratios. | ||
Patterns of the biomass specific growth rate (μ) are shown in Fig. 4b. We observed that the maximum μ values were 0.06 h−1, 0.09 h−1, 0.09 h−1 and 0.12 h−1 at C/N ratios of 65, 35, 15 and 5 respectively. Overall, the general tendency of the maximum μ value was consistent with the CDW, indicating that nitrogen availability in the substrate influenced the growth rate essentially. The deficiency of extracellular nitrogen created a starvation event, stimulating H. mediterranei to use intracellular nitrogen. When nitrogen was not the limiting factor, no circumstantial factors initially facilitated biomass synthesis but cellular anabolism became faster with time due to the need for growth.
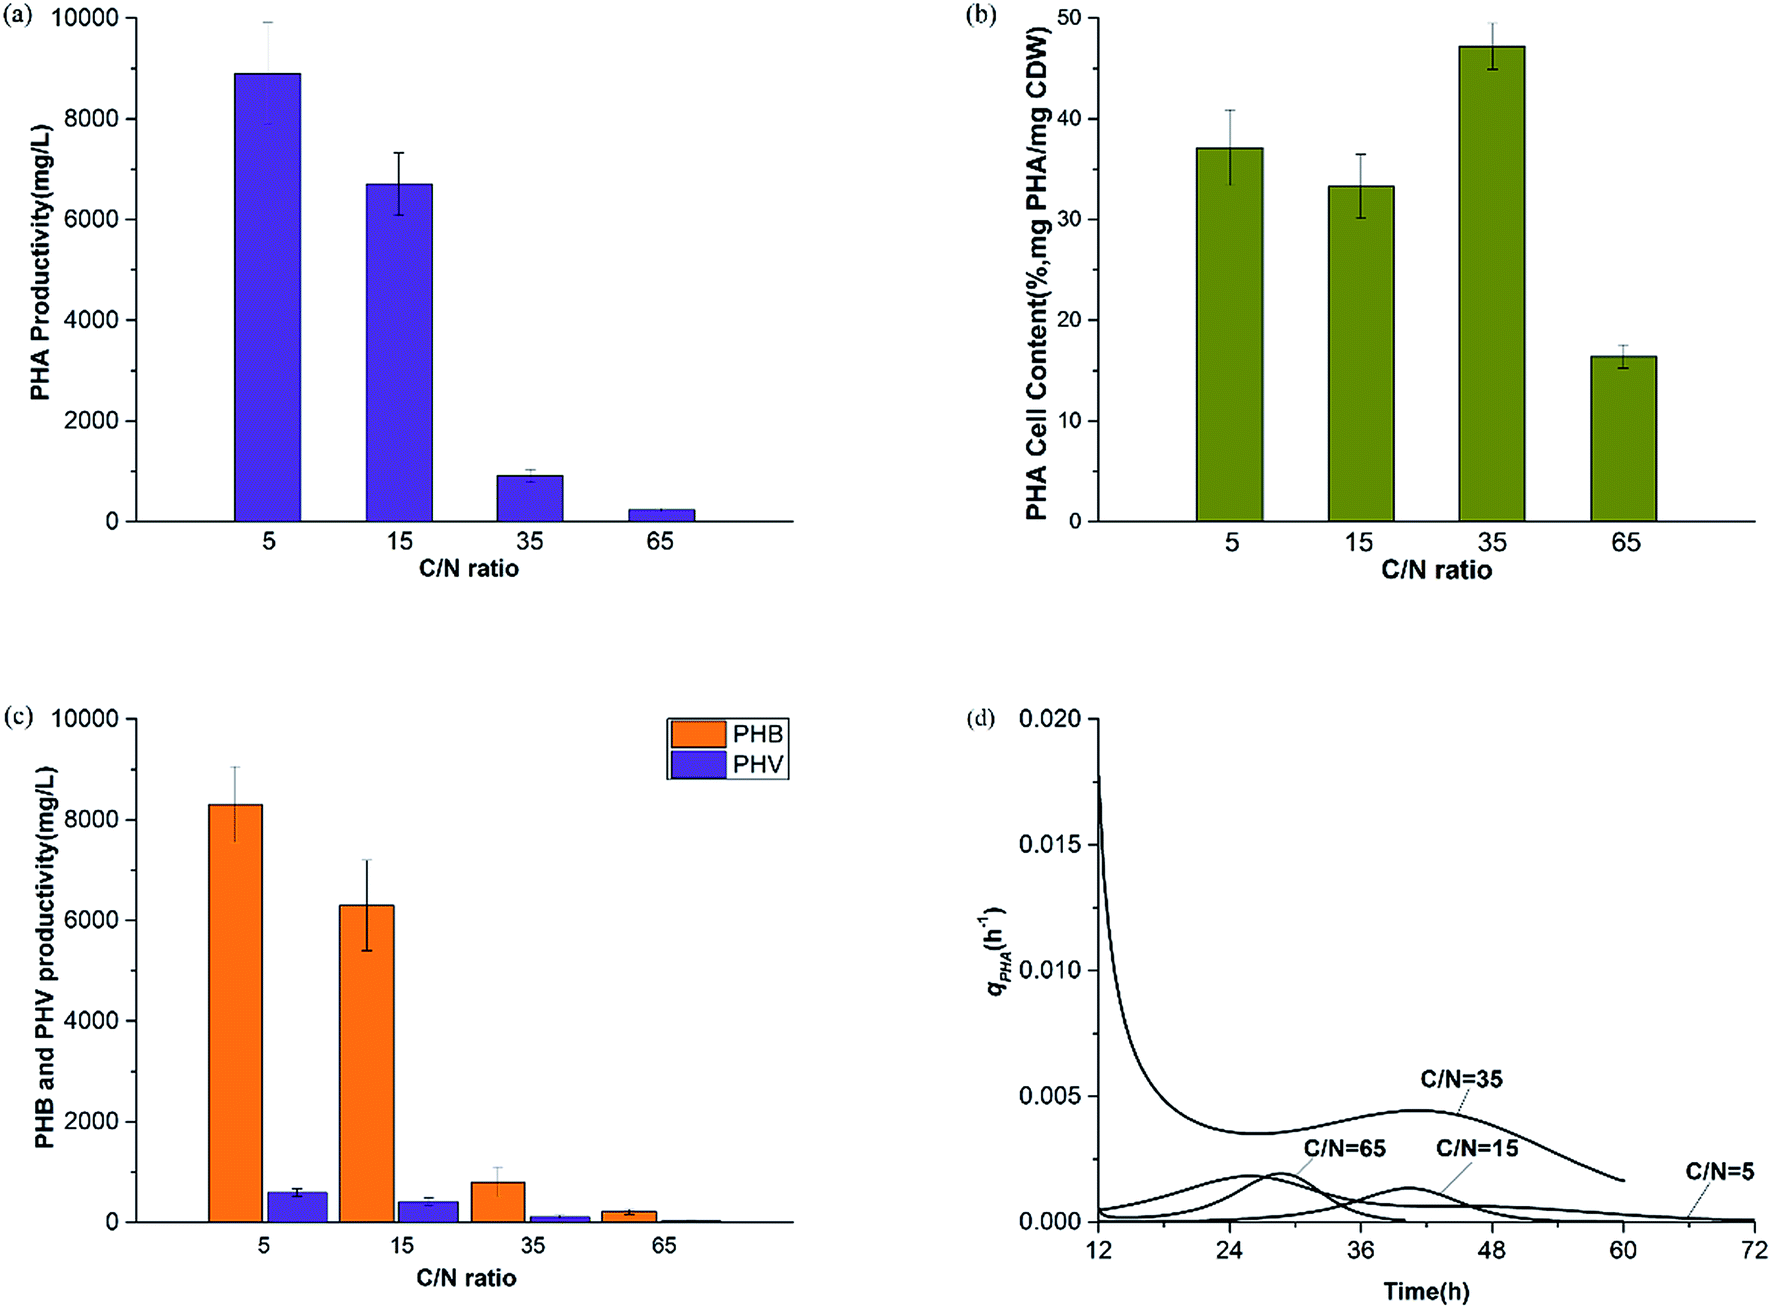 | ||
| Fig. 5 PHA changing tendency during the experiment under all C/N ratios. (a) PHA productivity, (b) PHA cell content, (c) PHB and PHV productivity, (d) PHA specific synthesis rate. | ||
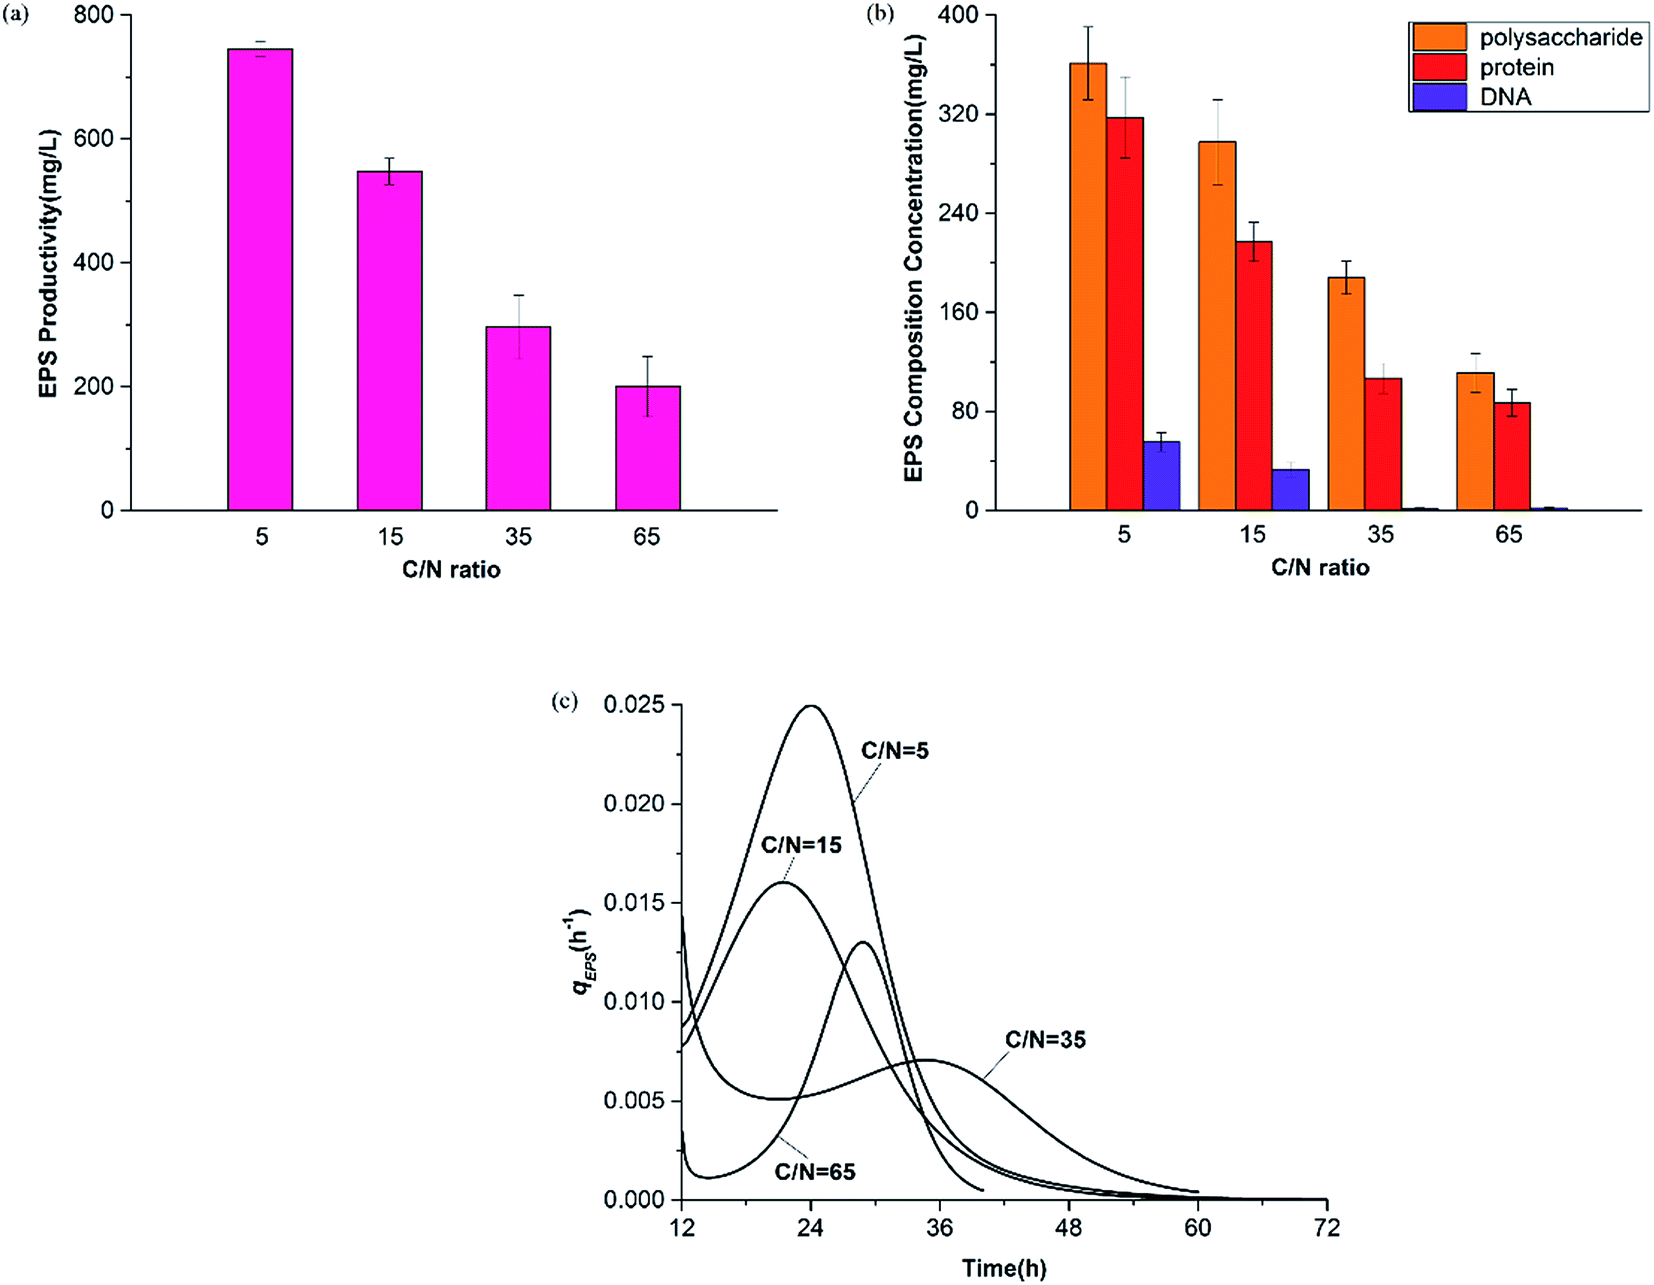 | ||
| Fig. 6 EPS production under all C/N ratios. (a) EPS productivity, (b) EPS compositions, and (c) specific EPS synthesis rates. | ||
3.3 Relationship between PHAs and EPSs
Fig. 7 shows the productivity of PHAs and EPSs during the feast phase. In comparison to the C/N ratio for normal growth, the results under limited and excess nitrogen conditions differed significantly. PHA production rose stably when the C/N ratio decreased, which meant that a decreased C/N ratio promoted the volume yield of PHAs. This result was triggered by the fast growth of H. mediterranei under low C/N conditions. On the other hand, this result also indicated that H. mediterranei preferred to synthesize PHAs compared to EPSs because the proportion of PHA production under the four C/N ratios was more than 60%. Compared with Fig. 5d and 6c, it was observed that the rate of PHA synthesis was lower than that of EPS synthesis. EPS synthesis occurred at the onset of fermentation with a fast rate, when the feast substrate was supplied. PHA synthesis continued after EPS synthesis stopped. After EPS synthesis ceased, the PHA content continued to increase up to the maximum value when all excess carbon was depleted, which suggests that PHA synthesis occurred after EPS synthesis during the feast period. Based on the results, we could conclude that H. mediterranei synthesized EPSs with a higher priority than PHAs. This means that EPSs were possibly the primary energy and food source for H. mediterranei, which are secreted and wrapped in the cell surface.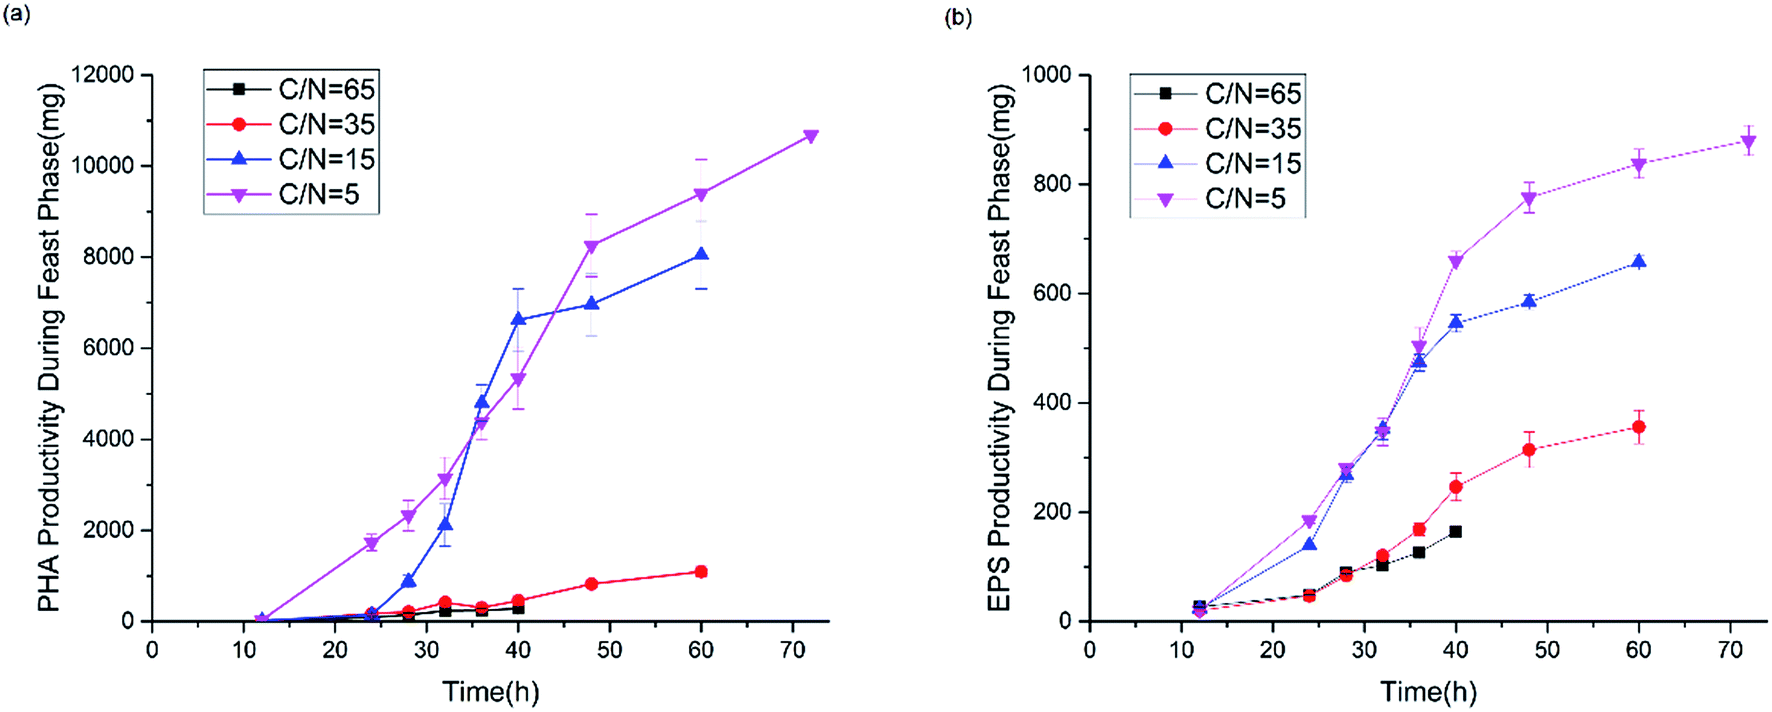 | ||
| Fig. 7 PHA and EPS productivity during the feast phase. (a) PHA productivity, (b) EPS productivity. | ||
Fig. 8 presents the percentage of the PHA yield coefficient out of the sum of the PHA and EPS yield coefficients at all C/N ratios. The PHA and EPS yield coefficients represent the carbon flow of substrates into polymers. The percentages of the PHA yield coefficients were 51.32%, 77.59%, 92.8% and 91.7% with increasing C/N ratios. These results supported that H. mediterranei was mainly synthesizing PHAs using extracellular carbon other than EPSs as the main reserve of energy. The highest percentage of 92.8% was observed at a C/N ratio of 35, showing that the carbon was mainly used to synthesize PHAs. Our results illustrate that changing the C/N ratio can possibly affect the metabolism of glucose-6-P by also affecting enzyme synthesis. According to Fig. 1, under the condition of nitrogen deficiency, more glucose-6-P was used to synthesize acetyl-CoA, leading to more PHBV production. Accompanying the addition of nitrogen, fructose-6-P becomes the dominant intermediate product, which inhibits acetyl-CoA synthesis. Differences in the availability of nitrogen may cause a change in enzyme synthesis in the cell, which in turn affects the distribution of glucose-6-P and finally results in the different PHA and EPS production levels.
 | ||
| Fig. 8 Comparison of the PHA yield coefficient with the sum of the PHA and EPS yield coefficients at all C/N ratios. YPHA and YEPS represent the PHA and EPS yields in glucose consumption, respectively. | ||
4. Conclusion
This study presents the influence of C/N ratios during feeding on the synthesis of EPSs and PHAs by Haloferax mediterranei with glucose as the sole carbon source. Continuous cultures showed that the concentration of nitrogen also affected the use of carbon and its distribution in biomass, EPS and PHA production. The maximal PHA cell content of 47.22% and the highest PHA volumetric productivity was found at C/N ratios of 35 and 5 respectively. Based on analysis of the developed model, we can infer that Haloferax mediterranei utilizes carbon to produce greater amounts of PHAs than EPSs, although EPS synthesis has a faster rate. It is possible to achieve the highest PHA production with the least influence of EPS at a C/N ratio of 35. In order to explore more effective control solutions to adjust the competition between PHA synthesis and EPS synthesis over excess carbon, more exploration is needed to investigate the effects of the single fermentation condition or composed fermentation conditions on PHA and EPS production by Haloferax mediterranei.Nomenclature
| SS | Substrate, mg L−1 |
| X | Biomass concentration, mg L−1 |
| XPHA | PHA concentration, mg L−1 |
| XEPS | EPS concentration, mg L−1 |
| μmax | Biomass specific growth rate, h−1 |
| qS | Substrate specific utilization rate, h−1 |
| qPHA | PHA specific synthesis rate, h−1 |
| qEPS | EPS specific synthesis rate, h−1 |
| kX | Biomass specific decay rate, h−1 |
| kPHA | PHA specific decay rate, h−1 |
| kEPS | EPS specific decay rate, h−1 |
| YPHA/S | PHA yield based on substrate |
| YEPS/S | EPS yield based on substrate |
Acknowledgements
This research was supported by the National Natural Science Foundation of China (Project No. 51478011).References
- A. Shrivastav, S. K. Mishra and S. Mishra, Int. J. Biol. Macromol., 2010, 46, 255–260 CrossRef CAS PubMed.
- A. Bhattacharyya, K. Jana, S. Haldar, A. Bhowmic, U. K. Mukhopadhyay, S. De and J. Mukherjee, World J. Microbiol. Biotechnol., 2015, 31, 717–727 CrossRef CAS PubMed.
- F. Cerrone, R. Davis, S. T. Kenny, T. Woods, A. O’Donovan, V. K. Gupta, M. Tuohy, R. P. Babu, P. O’Kiely and K. O’Connor, Bioresour. Technol., 2015, 191, 45–52 CrossRef CAS PubMed.
- L. Shen, H. Hu, H. Ji, C. Zhang, N. He, Q. Li and Y. Wang, Bioresour. Technol., 2015, 189, 236–242 CrossRef CAS PubMed.
- W. Guo, C. Song, M. Kong, W. Geng, Y. Wang and S. Wang, Appl. Microbiol. Biotechnol., 2011, 92, 791–801 CrossRef CAS PubMed.
- J. Wang and H. Yu, Appl. Microbiol. Biotechnol., 2007, 75, 871–878 CrossRef CAS PubMed.
- J. Lu, R. C. Tappel and C. T. Nomura, Polym. Rev., 2009, 49, 226–248 CrossRef CAS.
- E. Bugnicourt, P. Cinelli, A. Lazzeri and V. Alvarez, eXPRESS Polym. Lett., 2014, 8, 791–808 CrossRef.
- J. C. Fradinho, A. Oehmen and M. A. M. Reis, J. Biotechnol., 2014, 185, 19–27 CrossRef CAS PubMed.
- M. Koller, P. Hesse, R. Bona, C. Kutschera, A. Atlic and G. Braunegg, Macromol. Symp., 2007, 253, 33–39 CrossRef CAS.
- Q. Lu, J. Han, L. Zhou, J. Zhou and H. Xiang, J. Bacteriol., 2008, 190, 4173–4180 CrossRef CAS PubMed.
- J. G. Lillo and F. Rodriguezvalera, Appl. Environ. Microbiol., 1990, 56, 2517–2521 Search PubMed.
- J. Han, L. Wu, J. Hou, D. Zhao and H. Xiang, Biomacromolecules, 2015, 16, 578–588 CrossRef CAS PubMed.
- T. Huang, K. Duan, S. Huang and C. W. Chen, J. Ind. Microbiol. Biotechnol., 2006, 33, 701–706 CrossRef CAS PubMed.
- T. Don, C. W. Chen and T. Chan, J. Biomater. Sci., Polym. Ed., 2006, 17, 1425–1438 CrossRef CAS PubMed.
- M. Koller, E. Chiellini and G. Braunegg, Chem. Biochem. Eng. Q., 2015, 29, 87–98 CrossRef CAS.
- D. Zhao, L. Cai, J. Wu, M. Li, H. Liu, J. Han, J. Zhou and H. Xiang, Appl. Microbiol. Biotechnol., 2013, 97, 3027–3036 CrossRef CAS PubMed.
- J. Anton, I. Meseguer and F. Rodriguezvalera, Appl. Environ. Microbiol., 1988, 54, 2381–2386 CAS.
- G. Sheng, J. Xu, W. Li and H. Yu, Chemosphere, 2013, 93, 1436–1441 CrossRef CAS PubMed.
- H. Liu, J. Han, X. Liu, J. Zhou and H. Xiang, J. Genet. Genomics, 2011, 38, 261–269 CrossRef CAS PubMed.
- A. Oehmen, B. Keller-Lehmann, R. J. Zeng, Z. G. Yuan and E. Keller, J. Chromatogr. A, 2005, 1070, 131–136 CrossRef CAS PubMed.
- B. Ni, F. Fang, B. E. Rittmann and H. Yu, Environ. Sci. Technol., 2009, 43, 2489–2497 CrossRef CAS PubMed.
- H. Shi, C. Lee and W. Ma, World J. Microbiol. Biotechnol., 2007, 23, 625–632 CrossRef CAS.
- F. Valentino, L. Karabegouic, M. Majone, F. Morgan-Sagastume and A. Werker, Water Res., 2015, 77, 49–63 CrossRef CAS PubMed.
- Y. Jiang, M. Hebly, R. Kleerebezem, G. Muyzer and M. C. M. van Loosdrecht, Water Res., 2011, 45, 1309–1321 CrossRef CAS PubMed.
- E. Haba, J. Vidal-Mas, M. Bassas, M. J. Espuny, J. Llorens and A. Manresa, Biochem. Eng. J., 2007, 35, 99–106 CrossRef CAS.
- J. Esclapez, G. Bravo-Barrales, V. Bautista, C. Pire, M. Camacho and M. J. Bonete, FEMS Microbiol. Lett., 2014, 350, 168–174 CrossRef CAS PubMed.
- B. Ni, R. J. Zeng, F. Fang, J. Xu, G. Sheng and H. Yu, Environ. Sci. Technol., 2009, 43, 3743–3750 CrossRef CAS PubMed.
Footnote |
| † Electronic supplementary information (ESI) available. See DOI: 10.1039/c7ra02131c |
| This journal is © The Royal Society of Chemistry 2017 |