DOI:
10.1039/C7RA02083J
(Paper)
RSC Adv., 2017,
7, 23246-23254
Synthesis and excellent visible light photocatalysis performance of magnetic reduced graphene oxide/ZnO/ZnFe2O4 composites
Received
20th February 2017
, Accepted 21st April 2017
First published on 27th April 2017
Abstract
A novel magnetic RGO/ZnO/ZnFe2O4 composite was synthesized by a two step method. The phase formation, structure, morphology and chemical states were characterized by XRD, FESEM, TEM, FT-IR, Raman and XPS. The results showed that the composite consisted of a core–shell structure of ZnO/ZnFe2O4 coated with nearly transparent flake-like RGO. The photocatalytic effect of the composite was obviously better than that of single ZnO and ZnO/ZnFe2O4. The optimal sample was RGO/ZnO/ZnFe2O4-3 (the weight ratio of graphene to ZnO/ZnFe2O4 was 3%) which exhibited the best photocatalytic efficiency of 98.64% after 60 min under visible light irradiation for decolorization of MB. The reusability of RGO/ZnO/ZnFe2O4-3 was excellent because of the magnetic ZnFe2O4 which can be recycled using a magnet or constant magnetic field.
1. Introduction
With the rapid development of industry, more and more industrial wastewater containing toxic organics is let out without any purification treatment, which has resulted in great harm to the health of human beings.1 Semiconductor photocatalytic materials such as ZnO have attracted lots of attention because of their cheap price, easy preparation methods, high chemical stability and excellent photocatalytic performance under UV-light.2,3 However, the development of single ZnO is limited by its narrow light response range, wide band gap (3.2 eV) and difficult recycling.4 To overcome these weaknesses, many researchers have focused on preparing composites containing ZnO and another magnetic semiconductor. Shao et al.5 have prepared magnetic recyclable ZnFe2O4/ZnO with a core–shell structure by a solvothermal method and alkali precipitation method. The result indicates that the photocatalytic activity of photocatalyst composite is higher than single ZnO. Wang et al.6 reported magnetic ZnFe2O4/ZnO (ZFO/ZnO) multi-porous nanotubes, when the molar ratio of ZnFe2O4 was 50%, it exhibited the best photocatalytic efficiency of 99% after 150 min under the solar irradiation for the decolorization of RhB. Xie et al.7 have provided a reliable method to synthesis Sr-doped TiO2/magnetic Ni0.6Zn0.4Fe2O4 composites which not only has a high efficiency (90–100%) and a good cycling performance (90% maintenance) for photodegradation of bisphenol A (BPA) under both UV and visible light irradiation, but also can be easily separated from water for reuse only by introducing an external magnetic field.
As we all known, the large bandgap of ZnO (∼3.2 eV) only allows it absorbing UV light for the required band gap excitation and charge carrier generation, limiting its light harvesting efficiency, since UV light only contributes ∼4% of the solar energy.8 To address this problem, combining ZnO with advanced carbon materials will be efficient solution.9 Graphene has fascinating properties, such as a large surface area, good mechanical flexibility, high chemical stability, and unique electronic properties.10 Graphene is considered an ideal substrate to form graphene-based nanocomposites by anchoring nanoparticles on the layer surface, which make the resulting nanocomposite an efficient photocatalyst, because of the enhanced adsorption on the catalyst, non-aggregation of nanoparticles, an extended light-absorption range, and a significantly less recombination of photogenerated electron–hole pairs.11 Zhang et al.12 have synthesised the ZnO nanorod/graphene composite by a hydrothermal method. They found that the composite has good photocatalytic performance resulting from high surface areas and electron transfer ability of graphene which hinders the quick combination of photogenerated electron–hole. Fu et al.13 synthesized ZnFe2O4/RGO for the removal of methylene blue in the presence of H2O2 under visible-light irradiation.
Inspired of above truth, the ZnO/ZnFe2O4 nanocomposite was prepared by hydrothermal method and then deposited on the surface of graphene to obtain the RGO/ZnO/ZnFe2O4 composite. The structures and morphologies were investigated. The possible mechanism of photocatalysis was also further discussed.
2. Experimental
2.1. Synthesis of ZnFe2O4
ZnFe2O4 was prepared by a hydrothermal method. (CH3COO)2Zn and FeCl3 (Analytical Reagent) were dissolved in distilled water in stoichiometric proportion along with moderate hydrazine hydrate solution. The mixture was magnetically stirred for 30 min and transferred to a Teflon-lined stainless steel autoclave and heated at 180 °C for 12 h. The product was washed by distilled water and ethanol several times and dried at 60 °C in a vacuum oven.
2.2. Synthesis of ZnO/ZnFe2O4 composite
A certain amount of ZnFe2O4 and (CH3COO)2Zn were dissolved in 30 mL ethanol and ultra-sonicated for 1 h to obtain fine dispersion. The 30 mL ethanol solution containing moderate NaOH (the molar ratio of NaOH and (CH3COO)2Zn was 2![[thin space (1/6-em)]](https://www.rsc.org/images/entities/char_2009.gif) :
:![[thin space (1/6-em)]](https://www.rsc.org/images/entities/char_2009.gif) 1) was added into the dispersion drop by drop and stirred for 1 h. The mixture was transferred to a Teflon-lined stainless steel autoclave and heated at 90 °C for 10 h. The product was washed by distilled water, ethanol several times and was dried at 60 °C in a vacuum oven. The obtained ZnO/ZnFe2O4 composite was marked as Z/ZF.
1) was added into the dispersion drop by drop and stirred for 1 h. The mixture was transferred to a Teflon-lined stainless steel autoclave and heated at 90 °C for 10 h. The product was washed by distilled water, ethanol several times and was dried at 60 °C in a vacuum oven. The obtained ZnO/ZnFe2O4 composite was marked as Z/ZF.
2.3. Synthesis of reduce graphene oxide/ZnO/ZnFe2O4 composite
The preparation of reduced graphene oxide/ZnO/ZnFe2O4 composite was based on a facile one-pot method. Typically, a certain amount graphite oxide powder was dispersed 100 mL deionized water and ultra-sonicated for 2 h to produce GO solution. (The graphite oxide was synthesized by modified Hummers method.14) Then 0.4 g ZnO/ZnFe2O4 was added into the GO solution and stirred for 3 h. After that, moderate hydrazine hydrate was added to the mixture with constant stirring at 95 °C for 12 h. The resulting precipitate was filtrated, washed with distilled water and ethanol repeatedly and dried under vacuum at 60 °C for about 12 h. The samples with different weight ratios of 1, 3, and 5% of graphene and ZnO/ZnFe2O4 were denoted as RGO/Z/ZF-1, RGO/Z/ZF-3, RGO/Z/ZF-5, respectively.
2.4. Characterization
The resulting powder was characterized by X-ray diffraction (XRD) using a diffractometer (RIGAKU, model D/max) with CuKα radiation of wavelength λ = 0.1540598 nm. Fourier transform infrared spectra (FT-IR) were carried out using the infrared spectrophotometer (NICOLET, model NEXUS-670) in the range from 4000 to 400 cm−1 with a resolution of 1 cm−1. Raman spectra were measured using a Laser Raman spectroscope (Thermo Fisher, model DXR) at a 633 nm wavelength incident laser light. The morphologies were studied with a field emission scanning electron microscope (JEOL, model JSM-7001F) and a transmission electron microscope (JEOL, model JEM-2001). The chemical states were investigated by X-ray photoelectron spectroscopy (XPS, model ESCALAB-250Xi). BET surface areas were calculated from N2 adsorption data that were obtained using specific surface area analyzer (Quantachrome, model Autosorb-1) at liquid N2 temperature. Before the measurement, the sample was degassed for 12 h at 150 °C. Magnetization measurements were taken at room temperature (293 K) using a vibrating sample magnetometer (LDJ, model 9600-1).
2.5. Photocatalytic testing
Photocatalytic activities of the obtained photocatalysts were evaluated by the degradation of MB in aqueous solution. A 500 W Xenon lamp with suitable cutoff filters (λ > 420 nm) was employed as the light source. For each photocatalytic testing, 50 mg photocatalyst was dispersed into 100 mL of MB aqueous solution with the concentration of 10 mg L−1 with or without 0.5 M CH3OH as the hole scavenger. The suspension solution was magnetically stirred in the dark for 30 min to reach the absorption–desorption equilibrium. Then the suspension solution was irradiated by Xenon lamp with continuous stirring. At the given intervals, 5 mL of the aliquots was sampled and analyzed by recording variations in the absorption band (664 nm) in the UV-vis spectra (UV2300II) of MB.
3. Results and discussion
3.1. Structure and morphology analysis
The XRD patterns of the samples are presented in Fig. 1. It is clear that the peak at 2θ = 10.96° is attributed to (002) plane of GO (Fig. 1a) and there is no peak of natural graphite at 2θ = 26.51°, which indicates the GO is synthesized.15 The interplanar spacing of GO can be calculated by Bragg equation: 2d![[thin space (1/6-em)]](https://www.rsc.org/images/entities/char_2009.gif) sin
sin![[thin space (1/6-em)]](https://www.rsc.org/images/entities/char_2009.gif) θ = nλ, where d is the interplanar spacing, λ is X-ray wavelength and θ is the diffraction angle. The interplanar spacing of GO (d = 0.85 nm) is obviously bigger than that of natural graphite (d = 0.334 nm), which indicates the intercalation of water molecules and generation of oxygenated functional groups such as epoxy and hydroxyl group between the inter-galleries of the graphite sheets during high oxidation.16 A broad peak at 2θ = 24.60° is observed and the peak of GO is vanished in Fig. 1b, which suggests the GO is reduced mostly by hydrazine hydrate and RGO is prepared successfully. As shown in Fig. 1c, the peaks at 2θ = 31.65°, 34.29°, 36.10°, 47.35°, 56.40°, 62.65°, 67.70° and 68.81° are corresponding to the (100), (002), (101), (102), (110), (103), (112), (201) and (202) lattice plane of ZnO. Meanwhile, the peaks at 2θ = 30.04°, 35.28°, 42.96° and 56.34° are corresponding to the (220), (311), (400) and (511) lattice plane of ZnFe2O4. Based on this, we can confirm that the Z/ZF composite is synthesized successfully by hydrothermal method. In Fig. 1d, characteristic peaks of Z/ZF can be seen, which indicates the existence of Z/ZF in RGO/Z/ZF-1. However, the peaks of RGO do not appear in the pattern. It may be attributed to the low contents of RGO in the ternary composite. So, some other characterization methods were utilized to confirm the existence of RGO in RGO/Z/ZF-1 composite.
θ = nλ, where d is the interplanar spacing, λ is X-ray wavelength and θ is the diffraction angle. The interplanar spacing of GO (d = 0.85 nm) is obviously bigger than that of natural graphite (d = 0.334 nm), which indicates the intercalation of water molecules and generation of oxygenated functional groups such as epoxy and hydroxyl group between the inter-galleries of the graphite sheets during high oxidation.16 A broad peak at 2θ = 24.60° is observed and the peak of GO is vanished in Fig. 1b, which suggests the GO is reduced mostly by hydrazine hydrate and RGO is prepared successfully. As shown in Fig. 1c, the peaks at 2θ = 31.65°, 34.29°, 36.10°, 47.35°, 56.40°, 62.65°, 67.70° and 68.81° are corresponding to the (100), (002), (101), (102), (110), (103), (112), (201) and (202) lattice plane of ZnO. Meanwhile, the peaks at 2θ = 30.04°, 35.28°, 42.96° and 56.34° are corresponding to the (220), (311), (400) and (511) lattice plane of ZnFe2O4. Based on this, we can confirm that the Z/ZF composite is synthesized successfully by hydrothermal method. In Fig. 1d, characteristic peaks of Z/ZF can be seen, which indicates the existence of Z/ZF in RGO/Z/ZF-1. However, the peaks of RGO do not appear in the pattern. It may be attributed to the low contents of RGO in the ternary composite. So, some other characterization methods were utilized to confirm the existence of RGO in RGO/Z/ZF-1 composite.
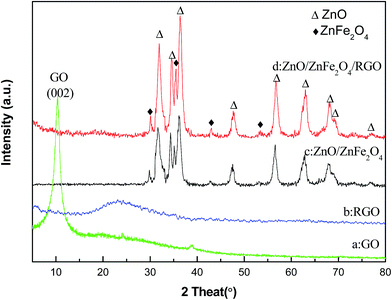 |
| | Fig. 1 XRD patterns of (a) GO, (b) RGO, (c) Z/ZF composite and (d) RGO/Z/ZF-1 composite. | |
The morphology and structure of the obtained samples were investigated by FESEM and TEM. Fig. 2a shows the representative SEM image of these ZnFe2O4, which suggests that samples contained uniform nanospheres with an average grain size of 400 nm. As shown in Fig. 2b and c, the Z/ZF displays spherical with uniform size and smooth surface. The transparent sheets with plenty of wrinkles are R-GO and the Z/ZF is covered by these flake-like R-GO sheets. More detailed structures of samples are given in TEM images. From Fig. 2d, we can observe that the Z/ZF has clear core–shell structure. The ZnFe2O4 was coated by ZnO with a thickness of 20 nm. According to the TEM image in Fig. 2e, the RGO/Z/ZF-1 composite can be seen more clearly, the tint parts were RGO and the dark parts were Z/ZF. Spherical core–shell Z/ZF particles were covered by transparent RGO sheets. Hence, results of FESEM and TEM confirm the existence of RGO and Z/ZF in the ternary composite, which agrees with the XRD analysis.
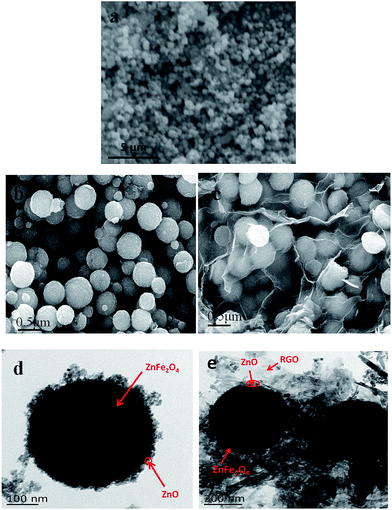 |
| | Fig. 2 SEM image of (a) Z/ZF composite, FESEM images of (b) Z/ZF composite and (c) RGO/Z/ZF-1 composite, TEM images of (d) Z/ZF composite and (e) RGO/Z/ZF-1 composite. | |
Fig. 3 shows the FT-IR spectra of the samples. The peaks of GO that appearing at 1730, 1611, 1420, 1225 and 1045 cm−1 are assigned to C![[double bond, length as m-dash]](https://www.rsc.org/images/entities/char_e001.gif) O stretching vibration of carbonyl and carbonyl groups, conjugate C
O stretching vibration of carbonyl and carbonyl groups, conjugate C![[double bond, length as m-dash]](https://www.rsc.org/images/entities/char_e001.gif) C skeletal stretching vibration of unoxidized graphite domains or the remaining sp2 carbon character of graphite, O–H stretching vibration of carbonyl, C–O stretching vibration of epoxide and C–O stretching vibration from alkoxy groups, respectively.17–21 For RGO, the absence of most bands related to the above oxygen-containing functional groups demonstrates that the GO was reduced mostly by hydrazine hydrate. The peak at 1580 cm−1 is attributed to the conjugate C
C skeletal stretching vibration of unoxidized graphite domains or the remaining sp2 carbon character of graphite, O–H stretching vibration of carbonyl, C–O stretching vibration of epoxide and C–O stretching vibration from alkoxy groups, respectively.17–21 For RGO, the absence of most bands related to the above oxygen-containing functional groups demonstrates that the GO was reduced mostly by hydrazine hydrate. The peak at 1580 cm−1 is attributed to the conjugate C![[double bond, length as m-dash]](https://www.rsc.org/images/entities/char_e001.gif) C skeletal stretching vibration of graphite. Comparing Z/ZF with RGO/Z/ZF-1, the peaks at 545 and 439 cm−1 are corresponding to the stretching vibrations of the Fe–O bonds in octahedral positions and the stretching vibrations of the Zn–O bonds in tetrahedral positions respectively,22 which suggest the existence of Z/ZF in ternary composite. Furthermore, a weak characteristic peak appearing at around 1580 cm−1 was due to the conjugate C
C skeletal stretching vibration of graphite. Comparing Z/ZF with RGO/Z/ZF-1, the peaks at 545 and 439 cm−1 are corresponding to the stretching vibrations of the Fe–O bonds in octahedral positions and the stretching vibrations of the Zn–O bonds in tetrahedral positions respectively,22 which suggest the existence of Z/ZF in ternary composite. Furthermore, a weak characteristic peak appearing at around 1580 cm−1 was due to the conjugate C![[double bond, length as m-dash]](https://www.rsc.org/images/entities/char_e001.gif) C skeletal stretching vibration of RGO in the RGO/Z/ZF-1 composite.
C skeletal stretching vibration of RGO in the RGO/Z/ZF-1 composite.
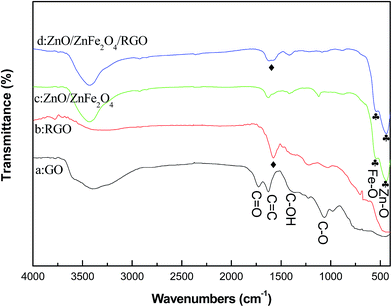 |
| | Fig. 3 FT-IR spectra of (a) GO, (b) RGO, (c) Z/ZF composite and (d) RGO/Z/ZF-1 composite. | |
The Raman spectra of the samples are given in Fig. 4. From the Fig. 4a and b, we can observe that there are two strong Raman peaks at around 1345 and 1600 cm−1 attributing to the D and G bands, respectively. The D band is assigned to the vibration of sp3 carbon atoms of disordered graphite,23 which corresponds to a first-order zone boundary phonon mode associated with defects in the graphene or graphene edge. The G band is mainly attributed to the in-plane vibration of sp2 carbon atoms in a 2D hexagonal lattice.24 Furthermore, the intensity ratio of D band to G band (ID/IG) is usually used to measure the graphitization degree of carbon materials.25 In this study, the ID/IG of GO and RGO are 0.95 and 1.11, respectively. The increase in value of ID/IG suggests that a decrease in the average size of the sp2 domains upon reduction of the GO and more defects has been generated.26 As shown in Fig. 4c, the peak at around 337, 664 and 443 cm−1 are regard as the Eg, A1g modes of ZnFe2O4 and characteristic peak of ZnO, respectively.27,28 From Fig. 4d, it is seen that the Raman spectrum of RGO/Z/ZF-1 composite contains the characteristic peaks of RGO, ZnO and ZnFe2O4, which indicates the successful synthesis of RGO/Z/ZF-1 composites.
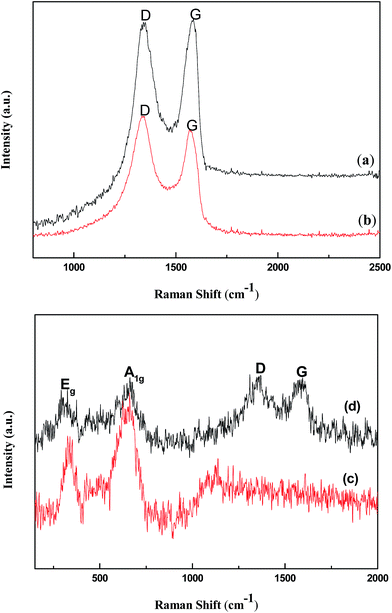 |
| | Fig. 4 Raman spectra of (a) GO, (b) RGO, (c) Z/ZF composite and (d) RGO/Z/ZF-1 composite. | |
The chemical states of elements in RGO/Z/ZF-1 are further investigated by XPS. The wide scan XPS spectrum of RGO/Z/ZF-1 in Fig. 5a shows photoelectron lines at a binding energy of about 286, 531, 710 and 1022 eV attributed to C 1s, O 1s, Fe 2p and Zn 2p, respectively. The peaks of Zn 2p1/2 and Zn 2p3/2 are located at 1044.9 and 1021.8 eV, which indicates that the chemical state of Zn is +2 in ternary composite.29 The Fe 2p1/2 appears at 724.8 eV and the peak at 711.7 eV is attributed to Fe 2p3/2 level. In addition, a satellite vibration peak is located at 718.1 eV. It demonstrates that Fe3+ exists in the RGO/Z/ZF-1.30 The peaks of O 1s appearing at 533.5, 531.9 and 530.3 eV were corresponding to C–O–C of graphene, hydrogen bond in absorbed water and the band of M–O (M represents metal) in Z/ZF.31–33 As shown in the high resolution XPS spectra of C 1s, the peaks at 288.5, 285.3 and 284.5 eV are due to the C in C![[double bond, length as m-dash]](https://www.rsc.org/images/entities/char_e001.gif) O, C–O and C
O, C–O and C![[double bond, length as m-dash]](https://www.rsc.org/images/entities/char_e001.gif) C/C–C. Meanwhile, it can be seen that the intensity of C
C/C–C. Meanwhile, it can be seen that the intensity of C![[double bond, length as m-dash]](https://www.rsc.org/images/entities/char_e001.gif) O and C–O are obviously lower than C–C and C
O and C–O are obviously lower than C–C and C![[double bond, length as m-dash]](https://www.rsc.org/images/entities/char_e001.gif) C, which indicates that containing oxygen functional groups in GO has been reduced by hydrazine hydrate.34 The result of XPS analysis further confirms the synthesis of RGO/Z/ZF-1.
C, which indicates that containing oxygen functional groups in GO has been reduced by hydrazine hydrate.34 The result of XPS analysis further confirms the synthesis of RGO/Z/ZF-1.
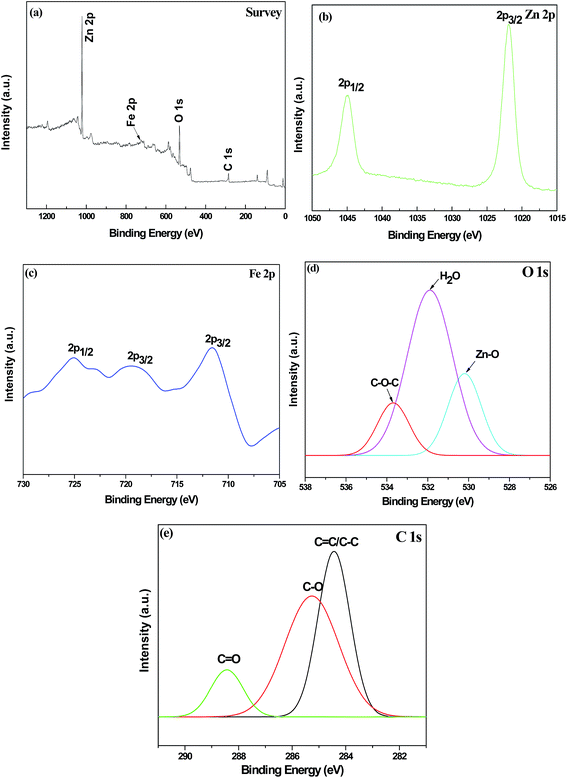 |
| | Fig. 5 XPS spectra of RGO/Z/ZF-1 (a) full spectrum, (b) Zn 2p, (c) Fe 2p, (d) O 1s and (e) C 1s. | |
3.2. Photocatalytic performance and mechanism analysis
To evaluate the photocatalytic activities of RGO/Z/ZF photocatalysts under the visible light irradiation, MB is employed as a model pollutant. As contrast, the photocatalytic activity of pure ZnO and Z/ZF photocatalysts are also carried out at the same conditions. Fig. 6 showed the photocatalytic degradation of MB under different samples at room temperature. There is nearly no degradation of MB without photocatalysts. The photocatalytic degradation of MB is very weaker only under the help of ZnO compared with that of Z/ZF. The possible reasons were: firstly, ZnO (energy gap = 3.37 eV) is only excited by UV light irradiation rather than visible light irradiation. ZnFe2O4 nanoparticles with bandgap of 1.8 eV are in principle a good visible light photocatalysts.35 Secondly, the Z/ZF has a core–shell structure which can provide a heterojunction structure. The heterojunction structure promotes the separation of photogenerated electrons and holes, improving the photocatalysis activity.36 After addition of RGO, the photocatalytic degradation effect of RGO/Z/ZF is better than that of pure ZnO and Z/ZF, the RGO/Z/ZF-3 presents the best photocatalytic activity (the final c/c0 is minimum). In the RGO/Z/ZF composite, the RGO plays a role to adsorb MB by the π–π stacking. The RGO with lower Fermi level can preferentially accept the photogenerated electrons, which can reduce the recombination of the photogenerated electrons and holes produced by Z/ZF.37 The synergistic effect of three components can markedly improve the photocatalytic activity of composite. The Fig. 7 gives the temporal evolution of the absorption spectra during the photo degradation of MB for RGO/Z/ZF-3. It can be seen that the intensity of the absorption peaks at 664 nm gradually decreased with irradiation time during MB degradation. It is observed that the peaks nearly completely disappear when the photocatalytic degradation process for MB is carried out for 60 min.
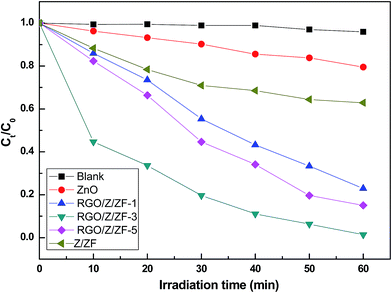 |
| | Fig. 6 Methylene blue decolourization of different photocatalysts. | |
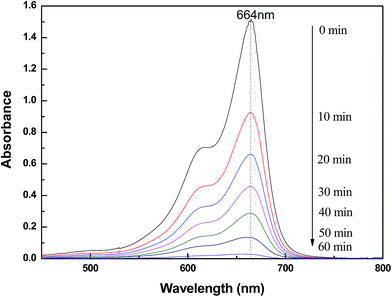 |
| | Fig. 7 Absorption spectra of MB taken at different photocatalytic degradation times with RGO/Z/ZF-3 as photocatalysts. | |
In order to make a further investigation on photocatalytic process, the kinetic behavior of photocatalytic degradation needs to be studied. Generally, the kinetic process of photocatalysis is described by pseudo-first-order reaction equation:38
| |
 | (1) |
where
C0 and
Ct (mg L
−1) are the concentration of MB at the
t = 0 and time
t (min), respectively.
K (min
−1) is the rate constants which has a positive correlation with the photocatalytic activity. The fitting results of photocatalytic degradation of MB are shown in
Fig. 8 and
Table 1. It can be seen from the results that the RGO/Z/ZF-3 has the fastest rate of rate constants (
K = 0.05652 min
−1) and better fitting correlation index (
R2 = 0.986), which indicates that the RGO/Z/ZF-3 has the best photocatalytic activity.
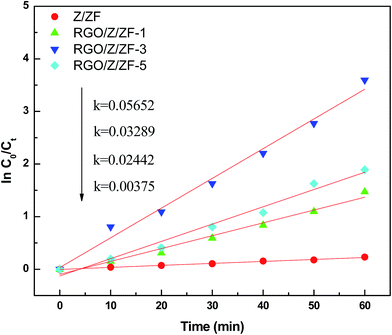 |
| | Fig. 8 Linear fitting curve of different photocatalytic degradation of methylene blue. | |
Table 1 The fitting results of first-order kinetic model for different samples
| Samples |
Liner fitting of first-order kinetics reaction |
| Equation |
R2 |
K (min−1) |
| Z/ZF |
ln(c0/ct) = 0.00375t |
0.9926 |
0.00375 |
| RGO/Z/ZF-1 |
ln(c0/ct) = 0.02442t |
0.9776 |
0.02442 |
| RGO/Z/ZF-3 |
ln(c0/ct) = 0.05652t |
0.986 |
0.05652 |
| RGO/Z/ZF-5 |
ln(c0/ct) = 0.03289t |
0.9763 |
0.03289 |
As we all known, if the energy of irradiate light is greater than the photoabsorption threshold value of photocatalyst, the photogenerated electron–hole pairs will be produced in photocatalyst. Then the generated electrons will combine with water-dissolved O2 to form superoxide radical anion (O2˙−), the generated holes will react with the surface-absorbed OH groups to form ˙OH radicals. These photoinduced O2˙− and ˙OH have strong oxidability which can effectively decompose the organic dye of MB to final harmless degradation products39,40 The reaction pathways as follows:
| | |
ZnFe2O4 + hν → ZnFe2O4 (e− + h+)
| (2) |
| | |
ZnFe2O4 (h+) + OH− → ZnFe2O4+ ˙OH
| (7) |
| | |
O2˙− + ˙OH + MB → degradation products
| (8) |
The possible mechanism of visible light photocatalysis can be illustrated by Fig. 9. It is known to us that the conduction band (CB = −1.54 V vs. NHE) and valance band (VB = 0.38 V vs. NHE)41 of ZnFe2O4 are both negative than the conduction band (CB = −0.1 V vs. NHE) and valance band (VB = 3.2 V vs. NHE)42 of ZnO, which leads to the type II band alignment of Z/ZF.43,44 Upon visible light irradiation, the partial photogenerated electrons from conduction band of ZnFe2O4 are transferred to the conduction band of ZnO, oppositely, the photogenerated holes lefted in the valance band of ZnFe2O4. The photogenerated electrons and holes can be effectively separated.45 The photogenerated electrons transferring into the conduction band of ZnO and holes left in the valance band of ZnFe2O4 can be captured by water-dissolved O2 and OH groups to form O2˙− and ˙OH respectively because of the more positive E(O2/O2˙−) (0.0 V vs. NHE)46 and E(OH/˙OH) (2.87 V vs. NHE),47 which can effectively decompose MB to final harmless small molecules. Further evidence is provided by adding CH3OH, which is a typical holes cavenger in aqueous solution.45 Fig. 10 shows degradation efficiency of RGO/ZnO/ZnFe2O4-3 with or without CH3OH when the photocatalytic degradation process is carried out for 60 min. Low degradation efficiency is observed after adding CH3OH. This result confirms that both electrons and holes can attribute to the degradation process. Meanwhile, RGO also plays an important role in ternary composite. Firstly, partial photogenerated electrons from conduction band of ZnFe2O4 are also readily transferred to the graphene nanosheets because of more positive conduction band (CB = −0.75 V vs. NHE)48 and more efficient electron transportation of graphene, which can prohibit the recombination of electron–hole pairs.37,41 Secondly, the unique structure of RGO provides the RGO/Z/ZF with a larger surface area (see Table 2) which can make photocatalyst absorb more light radiation and dyes.37 Thirdly, there are a lot of defects and few excited groups containing oxygen in the RGO surface because of reduction of GO, which can bring strong absorption capacity for the RGO/Z/ZF.49 At last, the conjugated π system of RGO can also hinder the recombination of electron–hole pairs.38 As a result, the RGO/Z/ZF has high photocatalytic activity.
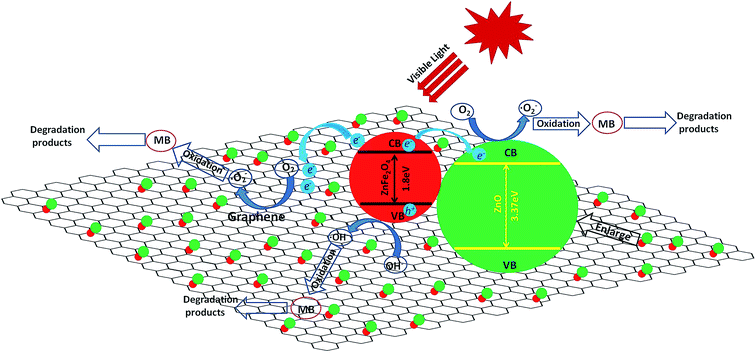 |
| | Fig. 9 Schematic diagram of possible photocatalytic mechanism of RGO/Z/ZF-3 composite under visible light irradiation. | |
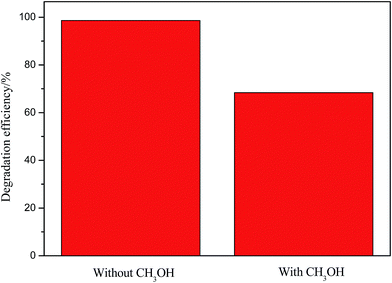 |
| | Fig. 10 Degradation efficiency of RGO/ZnO/ZnFe2O4-3 with or without CH3OH. | |
Table 2 BET surface area of the samples
| Samples |
BET surface area (m2 g−1) |
| Z |
92 |
| Z/ZF |
67 |
| RGO/Z/ZF-1 |
127 |
| RGO/Z/ZF-3 |
138 |
| RGO/Z/ZF-5 |
154 |
3.3. Reusability and stability of RGO/Z/ZF-3 composite
The Fig. 11 showed the hysteresis loops of pure ZnFe2O4 (ZF) and RGO/Z/ZF-3 composite. The narrow magnetic hysteresis loops of the samples indicate that the samples are magnetically soft with low coercivity. The saturation magnetization of RGO/Z/ZF-3 composite was clearly lower than that of single ZF, which may be due to the addition of nonmagnetic RGO and ZnO. However, the saturation magnetization of RGO/Z/ZF-3 composite is still enough to make it be separated from the degradation solution. The photograph of magnetic separation is shown in Fig. 12. The RGO/Z/ZF composite can be collected quickly by a magnet just for about 1 min. The result of repeated photocatalytic experiments on RGO/Z/ZF-3 is given in Fig. 13. It can be seen from Fig. 13 that the photocatalytic activity of composite still gets 82.41% after five recycles, which suggests the excellent photocatalytic stability of RGO/Z/ZF-3.
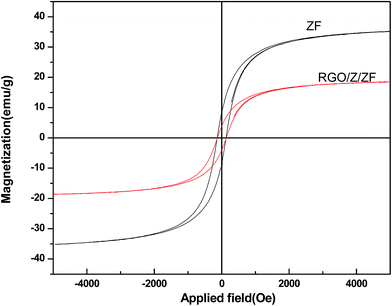 |
| | Fig. 11 The magnetization hysteresis loops of ZnFe2O4 (ZF) and RGO/Z/ZF-3 composite. | |
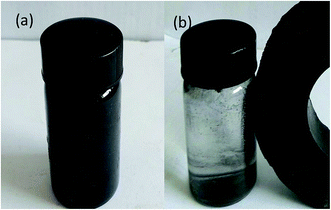 |
| | Fig. 12 Digital photographs of RGO/Z/ZF-3 collected by an external magnet (a) before separated; (b) after separated. | |
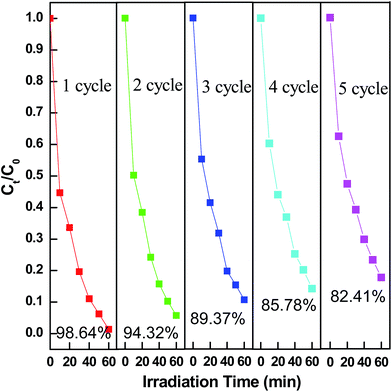 |
| | Fig. 13 Photocatalytic degradation of MB during five circulations using RGO/Z/ZF-3. | |
4. Conclusions
RGO/Z/ZF composites were synthesized by two steps method. Z/ZF composites with core–shell structure are coated by nearly transparent flake-like RGO. The composite shows excellent photocatalytic activity. RGO/Z/ZF-3 has not only the optimal photocatalytic activity because of its appropriate RGO content, heterojunction structure and special type II band alignment which can absorb more MB and improve the degradation of MB, respectively, the ratio of degradation of MB is 98.64% when it was under visible light for 60 min, but also enough stability to be reused.
Notes and references
- D. Zhang and F. Zeng, J. Mater. Sci., 2013, 47, 2155–2161 CrossRef.
- L. Zhang, L. Du, X. Yu, S. Tan, X. Cai, P. Yang, Y. Gu and W. Mai, ACS Appl. Mater. Interfaces, 2014, 6, 3623–3629 CAS.
- K. Kumar, M. Chitkara, I. S. Sandhu, D. Mehta and S. Kumar, J. Alloys Compd., 2014, 588, 681–689 CrossRef CAS.
- A. A. Ashkarran and B. Mohammadi, Appl. Surf. Sci., 2015, 342, 112–119 CrossRef CAS.
- R. Shao, L. Sun, L. Q. Tang and Z. D. Chen, Chem. Eng. J., 2013, 217, 185–191 CrossRef CAS.
- C. L. Wang, X. Tan, J. T. Yan, B. Chai, J. F. Li and S. Z. Chen, Appl. Surf. Sci., 2017, 396, 780–790 CrossRef CAS.
- F. Liu, Y. Xie, C. Yu, C. L. Yu, X. M. Liu, Y. H. Dai, L. J. Liu and Y. Ling, RSC Adv., 2015, 5, 24056–24063 RSC.
- Y. Xie, Y. Z. Li and X. J. Zhao, J. Mol. Catal. B: Enzym., 2007, 277, 119–126 CrossRef CAS.
- S. H. Xu, L. Fu, T. S. H. Pham, A. M. Yu, F. G. Han and L. Chen, Ceram. Int., 2015, 41, 4007–4013 CrossRef CAS.
- J. Y. Qu, L. Shi, C. H. He, F. Gao, B. B. Li, Q. Zhou, H. Hu, G. H. Shao, X. Z. Wang and J. S. Qiu, Carbon, 2014, 66, 485–492 CrossRef CAS.
- S. Wu, P. Wang, Y. Cai, D. Liang, Y. Ye, Z. Tian, J. Liu and C. Liang, RSC Adv., 2015, 5, 9069–9074 RSC.
- Z. Chen, N. Zhang and Y. J. Xu, CrystEngComm, 2013, 15, 3022–3030 RSC.
- Y. Fu and X. Wang, Ind. Eng. Chem. Res., 2011, 50, 7210–7218 CrossRef CAS.
- J. H. Luo, P. Sheng, W. Yao, C. F. Jiang and J. G. Xu, Nanoscale Res. Lett., 2016, 11, 141 CrossRef PubMed.
- Y. Xu, J. H. Luo, W. Yao, J. G Xu and T. Li, J. Alloys Compd., 2015, 636, 310–316 CrossRef CAS.
- K. Singh, A. Ohlan, V. H. Pham, R. Balasubramaniyan, S. Varshney, J. Jang, S. H. Hur, W. M. Choi, M. Kumar, S. K. Dhawan, B. S. Kong and J. S. Chung, Nanoscale, 2013, 5, 2411–2420 RSC.
- X. P. Shen, J. L. Wu, S. Bai and H. Zhou, J. Alloys Compd., 2010, 506, 136–140 CrossRef CAS.
- H. L. Guo, X. F. Wang, Q. Y. Qian, F. B. Wang and X. H. Xia, ACS Nano, 2009, 3, 2653–2659 CrossRef CAS PubMed.
- H. K. Jeong, Y. P. Lee, R. J. W. E. Lahaye, M. H. Park, K. H. An, I. J. Kim, C. W. Yang, C. Y. Park, R. S. Ruoff and Y. H. Lee, J. Am. Chem. Soc., 2008, 130, 1362–1366 CrossRef CAS PubMed.
- H. P. Cong, X. C. Ren, P. Wang and S. H. Yu, ACS Nano, 2012, 6, 2693–2703 CrossRef CAS PubMed.
- C. Z. Zhu, S. J. Guo, Y. X. Fang and S. J. Dong, ACS Nano, 2010, 4, 2429–2437 CrossRef CAS PubMed.
- P. Laokul, V. Amornkitbamrung, S. Seraphin and S. Maensiri, Curr. Appl. Phys., 2011, 11, 101–108 CrossRef.
- Z. Jin, J. Yao, C. Kittrell and J. M. Tour, ACS Nano, 2011, 5, 4114–4117 Search PubMed.
- W. F. Chen, S. R. Li, C. H. Chen and L. F. Yan, Adv. Mater., 2011, 23, 5679–5683 CrossRef CAS PubMed.
- Y. Z. Xue, B. Wu, L. Jiang, Y. L. Guo, L. P. Huang, J. J. Chen, J. H. Tan, D. C. Geng, B. R. Luo, W. P. Hu, G. Yu and Y. Q. Liu, J. Am. Chem. Soc., 2012, 134, 11060–11061 CrossRef CAS PubMed.
- D. Z. Chen, G. S. Wang, S. He, J. Liu, L. Guo and M. S. Cao, J. Mater. Chem. A, 2013, 1, 5996–6003 CAS.
- D. L. A. Faria, S. V. Silva and M. T. Oliveira, J. Raman Spectrosc., 1997, 28, 873–878 CrossRef.
- X. D. Guo, R. X. Li, Y. Hang, Z. Z. Xu, B. K. Yu, H. L. Ma and X. W. Sun, Mater. Lett., 2007, 61, 4583–4586 CrossRef CAS.
- L. B. Yang, Y. Zhang, W. D. Ruan, B. Zhao, W. Q. Xu and J. R. Lombardi, J. Raman Spectrosc., 2010, 41, 721–726 Search PubMed.
- X. Zhou, B. Wang, H. Sun, C. Wang, P. Sun, X. Li, X. Hua and G. Lu, Nanoscale, 2016, 8, 5446–5453 RSC.
- D. Andreeva, T. Tabakova, V. Idakiev, P. Christov and R. Giovanoli, Appl. Catal., A, 1998, 169, 9–14 CrossRef CAS.
- S. Wang, J. Zhang, J. Yang, X. Gao, H. Zhang, Y. Wang and Z. Zhu, RSC Adv., 2015, 5, 10048–10057 RSC.
- H. C. Schniepp, J. L. Li, M. J. McAllister, H. Sai, M. Herrera-Alonso, D. H. Adamson, R. K. Prud’homme, R. Car, D. A. Saville and I. A. Aksay, J. Phys. Chem. B, 2006, 110, 8535–8539 CrossRef CAS PubMed.
- D. C. Luo, G. X. Zhang, J. F. Liu and X. M. Sun, J. Phys. Chem. C, 2011, 115, 11327–11335 CAS.
- J. Jang, S. Hong, J. Lee, P. H. Borse, O. S. Jung, T. Hong, E. Jeong, M. Won and H. Kim, J. Korean Phys. Soc., 2009, 54, 204–208 CrossRef CAS.
- D. Hu, Y. Xie, L. Liu, P. P. Zhou, J. Zhao, J. W. Xu and Y. Ling, Appl. Catal., B, 2016, 188, 207–216 CrossRef CAS.
- L. Zhang, L. H. Du, X. Cai, X. Yu, D. D. Zhang, L. C. Liang, P. H. Yang, X. B. Xing, W. J. Mai, S. Z. Tan, Y. Gu and J. H. Song, Phys. E, 2013, 47, 279–284 CrossRef CAS.
- J. T. Feng, Y. H. Hou, X. Y. Wang, W. L. Quan, J. M. Zhang, Y. C. Wang and L. C. Li, J. Alloys Compd., 2016, 681, 157–166 CrossRef CAS.
- A. H. Mady, M. L. Baynosa, D. Tuma and J. J. Shim, Appl. Catal., B, 2017, 203, 416–427 CrossRef CAS.
- L. Sun, R. Shao, L. Q. Tang and Z. D. Chen, J. Alloys Compd., 2013, 564, 55–62 CrossRef CAS.
- X. Li, D. Tang, F. Tang, Y. Zhu, C. He, M. Liu, C. Lin and Y. Liu, Mater. Res. Bull., 2014, 56, 125–133 CrossRef CAS.
- M. Gratzel, Nature, 2001, 414, 338–344 CrossRef CAS PubMed.
- X. Y. Li, Y. Hou, Q. D. Zhao and G. H. Chen, Langmuir, 2011, 27, 3113–3120 CrossRef CAS PubMed.
- S. H. Cho, J. W. Jang, J. W. Kim, J. S. Lee, W. Y. Choi and K. H. Lee, Langmuir, 2011, 27, 10243–10250 CrossRef CAS PubMed.
- X. Guo, H. J. Zhu and Q. Li, Appl. Catal., B, 2014, 160–161, 408–414 CrossRef CAS.
- H. J. Zhang, G. H. Chen and D. W. Bahnemann, J. Mater. Chem., 2009, 19, 5089–5121 RSC.
- T. Ichino and R. W. Fessenden, J. Phys. Chem. A, 2007, 111, 2527–2541 CrossRef CAS PubMed.
- D. F. Xu, B. Cheng, S. W. Cao and J. G. Xu, Appl. Catal., B, 2015, 164, 380–388 CrossRef CAS.
- J. H. Shen, G. Ma, J. M. Zhang, W. L. Quan and L. C. Li, Appl. Surf. Sci., 2015, 359, 455–468 CrossRef CAS.
|
| This journal is © The Royal Society of Chemistry 2017 |
Click here to see how this site uses Cookies. View our privacy policy here.  Open Access Article
 *,
Zhu Yan,
Rongqi Liu,
Jianguang Xu and
Xu Wang
![[thin space (1/6-em)]](https://www.rsc.org/images/entities/char_2009.gif) :
:![[thin space (1/6-em)]](https://www.rsc.org/images/entities/char_2009.gif) 1) was added into the dispersion drop by drop and stirred for 1 h. The mixture was transferred to a Teflon-lined stainless steel autoclave and heated at 90 °C for 10 h. The product was washed by distilled water, ethanol several times and was dried at 60 °C in a vacuum oven. The obtained ZnO/ZnFe2O4 composite was marked as Z/ZF.
1) was added into the dispersion drop by drop and stirred for 1 h. The mixture was transferred to a Teflon-lined stainless steel autoclave and heated at 90 °C for 10 h. The product was washed by distilled water, ethanol several times and was dried at 60 °C in a vacuum oven. The obtained ZnO/ZnFe2O4 composite was marked as Z/ZF.
![[thin space (1/6-em)]](https://www.rsc.org/images/entities/char_2009.gif) sin
sin![[thin space (1/6-em)]](https://www.rsc.org/images/entities/char_2009.gif) θ = nλ, where d is the interplanar spacing, λ is X-ray wavelength and θ is the diffraction angle. The interplanar spacing of GO (d = 0.85 nm) is obviously bigger than that of natural graphite (d = 0.334 nm), which indicates the intercalation of water molecules and generation of oxygenated functional groups such as epoxy and hydroxyl group between the inter-galleries of the graphite sheets during high oxidation.16 A broad peak at 2θ = 24.60° is observed and the peak of GO is vanished in Fig. 1b, which suggests the GO is reduced mostly by hydrazine hydrate and RGO is prepared successfully. As shown in Fig. 1c, the peaks at 2θ = 31.65°, 34.29°, 36.10°, 47.35°, 56.40°, 62.65°, 67.70° and 68.81° are corresponding to the (100), (002), (101), (102), (110), (103), (112), (201) and (202) lattice plane of ZnO. Meanwhile, the peaks at 2θ = 30.04°, 35.28°, 42.96° and 56.34° are corresponding to the (220), (311), (400) and (511) lattice plane of ZnFe2O4. Based on this, we can confirm that the Z/ZF composite is synthesized successfully by hydrothermal method. In Fig. 1d, characteristic peaks of Z/ZF can be seen, which indicates the existence of Z/ZF in RGO/Z/ZF-1. However, the peaks of RGO do not appear in the pattern. It may be attributed to the low contents of RGO in the ternary composite. So, some other characterization methods were utilized to confirm the existence of RGO in RGO/Z/ZF-1 composite.
θ = nλ, where d is the interplanar spacing, λ is X-ray wavelength and θ is the diffraction angle. The interplanar spacing of GO (d = 0.85 nm) is obviously bigger than that of natural graphite (d = 0.334 nm), which indicates the intercalation of water molecules and generation of oxygenated functional groups such as epoxy and hydroxyl group between the inter-galleries of the graphite sheets during high oxidation.16 A broad peak at 2θ = 24.60° is observed and the peak of GO is vanished in Fig. 1b, which suggests the GO is reduced mostly by hydrazine hydrate and RGO is prepared successfully. As shown in Fig. 1c, the peaks at 2θ = 31.65°, 34.29°, 36.10°, 47.35°, 56.40°, 62.65°, 67.70° and 68.81° are corresponding to the (100), (002), (101), (102), (110), (103), (112), (201) and (202) lattice plane of ZnO. Meanwhile, the peaks at 2θ = 30.04°, 35.28°, 42.96° and 56.34° are corresponding to the (220), (311), (400) and (511) lattice plane of ZnFe2O4. Based on this, we can confirm that the Z/ZF composite is synthesized successfully by hydrothermal method. In Fig. 1d, characteristic peaks of Z/ZF can be seen, which indicates the existence of Z/ZF in RGO/Z/ZF-1. However, the peaks of RGO do not appear in the pattern. It may be attributed to the low contents of RGO in the ternary composite. So, some other characterization methods were utilized to confirm the existence of RGO in RGO/Z/ZF-1 composite.

![[double bond, length as m-dash]](https://www.rsc.org/images/entities/char_e001.gif) O stretching vibration of carbonyl and carbonyl groups, conjugate C
O stretching vibration of carbonyl and carbonyl groups, conjugate C![[double bond, length as m-dash]](https://www.rsc.org/images/entities/char_e001.gif) C skeletal stretching vibration of unoxidized graphite domains or the remaining sp2 carbon character of graphite, O–H stretching vibration of carbonyl, C–O stretching vibration of epoxide and C–O stretching vibration from alkoxy groups, respectively.17–21 For RGO, the absence of most bands related to the above oxygen-containing functional groups demonstrates that the GO was reduced mostly by hydrazine hydrate. The peak at 1580 cm−1 is attributed to the conjugate C
C skeletal stretching vibration of unoxidized graphite domains or the remaining sp2 carbon character of graphite, O–H stretching vibration of carbonyl, C–O stretching vibration of epoxide and C–O stretching vibration from alkoxy groups, respectively.17–21 For RGO, the absence of most bands related to the above oxygen-containing functional groups demonstrates that the GO was reduced mostly by hydrazine hydrate. The peak at 1580 cm−1 is attributed to the conjugate C![[double bond, length as m-dash]](https://www.rsc.org/images/entities/char_e001.gif) C skeletal stretching vibration of graphite. Comparing Z/ZF with RGO/Z/ZF-1, the peaks at 545 and 439 cm−1 are corresponding to the stretching vibrations of the Fe–O bonds in octahedral positions and the stretching vibrations of the Zn–O bonds in tetrahedral positions respectively,22 which suggest the existence of Z/ZF in ternary composite. Furthermore, a weak characteristic peak appearing at around 1580 cm−1 was due to the conjugate C
C skeletal stretching vibration of graphite. Comparing Z/ZF with RGO/Z/ZF-1, the peaks at 545 and 439 cm−1 are corresponding to the stretching vibrations of the Fe–O bonds in octahedral positions and the stretching vibrations of the Zn–O bonds in tetrahedral positions respectively,22 which suggest the existence of Z/ZF in ternary composite. Furthermore, a weak characteristic peak appearing at around 1580 cm−1 was due to the conjugate C![[double bond, length as m-dash]](https://www.rsc.org/images/entities/char_e001.gif) C skeletal stretching vibration of RGO in the RGO/Z/ZF-1 composite.
C skeletal stretching vibration of RGO in the RGO/Z/ZF-1 composite.![[double bond, length as m-dash]](https://www.rsc.org/images/entities/char_e001.gif) O, C–O and C
O, C–O and C![[double bond, length as m-dash]](https://www.rsc.org/images/entities/char_e001.gif) C/C–C. Meanwhile, it can be seen that the intensity of C
C/C–C. Meanwhile, it can be seen that the intensity of C![[double bond, length as m-dash]](https://www.rsc.org/images/entities/char_e001.gif) O and C–O are obviously lower than C–C and C
O and C–O are obviously lower than C–C and C![[double bond, length as m-dash]](https://www.rsc.org/images/entities/char_e001.gif) C, which indicates that containing oxygen functional groups in GO has been reduced by hydrazine hydrate.34 The result of XPS analysis further confirms the synthesis of RGO/Z/ZF-1.
C, which indicates that containing oxygen functional groups in GO has been reduced by hydrazine hydrate.34 The result of XPS analysis further confirms the synthesis of RGO/Z/ZF-1.


