 Open Access Article
Oxidation-resistant micron-sized Cu–Sn solid particles fabricated by a one-step and scalable method†
Yujia Liang a,
Su Cheun Oh
 a,
Xizheng Wangc,
Howard Glicksmanb,
Dongxia Liu
 a and
Sheryl Ehrman
 *a
*a
aDepartment of Chemical and Biomolecular Engineering, University of Maryland, College Park, Maryland 20742, USA. E-mail: sehrman@umd.edu
bDuPont Electronic Technologies, Research Triangle Park, North Carolina 27709, USA
cDepartment of Chemistry and Biochemistry, University of Maryland, College Park, Maryland 20742, USA
First published on 27th April 2017
Abstract
Micron-sized solid Cu–Sn particles have been considered as a replacement for more expensive materials (e.g., Ag, Pd, and Au) in conductive pastes used in printed electronics, solar cell metallization, and interference packaging. With the formation of a tin oxide layer, Cu–Sn particles could combine relatively low electrical resistivity with high oxidation resistance. However the oxidation behavior of this system is not well understood. Here, the oxidation of CuSny solid particles, fabricated by spray pyrolysis without direct addition of H2, was investigated. Our experimental results and theoretical analysis suggest that at a low oxidation temperature (300 °C), the migration of O2− through the oxide layer controls the oxidation. At high temperature (500 °C), the grain growth of the oxide layer is believed to be the rate-limiting step. Among the CuSny particles tested, CuSn0.1 powders exhibited the best particle structure (solid and spherical) and highest oxidation resistance.
Introduction
Metal particles have been widely applied in printed electronics,1,2 interference packaging,3,4 and solar cell metallization.5,6 Gold and silver are by far the most commonly used materials in these fields due to their high electrical conductivity and oxidation resistance.1–7 However, the high cost of these noble metals has increased interest in developing alternative cost-efficient materials such as copper (Cu)8–10 for these applications. Several challenges, such as the ease of oxidation of copper materials and the high mobility of copper in silicon (a common substrate in the electronics industry), have to be addressed before widespread application of copper-based powders.11–13 The oxidation behavior of Cu is known to be complex since many processes, including electron migration across the metal/oxide interface, recrystallization of the pseudomorphic oxide layer, external/internal diffusion of O2 gas, and chemical reactions, can happen simultaneously.14–17 Particle engineering with an oxidation-resistant layer on a Cu core has been proposed as an effective configuration. The oxidation-passivation layer can be metals (e.g., Ag, Zn, Ni, and Au) or organic compounds.9,18–24 Nevertheless, there is a need to explore other strategies from a comprehensive view of cost and electrical conductivity.Tin (Sn) has been reported as an effective protector against copper oxidation, since tin is more reactive towards oxygen than copper and tin oxides maintain relatively high conductivity.25,26 In addition, tin is a diffusion barrier between copper and silicon, which provides extra benefit for practical applications, in particular, in solar cell metallization.25,26 Recently, the electrical resistivity of CucoreSnshell nanowires fabricated by electroplating method was found to remain at the same order of magnitude after being oxidized for 25 h, while the resistivity of Cu nanowires increased by 107 in 15 min under the same oxidation conditions.27 However, rather than nanowires, micron-sized solid particles are favored by industry for applications such as conductive pastes and interference packaging.28,29 To address this issue, Cu–Sn binary powders with Sn-enriched surface layer have been produced by a scalable process, spray pyrolysis, without the direct addition of H2.13
As a next step, here, we present a detailed investigation of the oxidation behavior of CuSny (y is the atomic ratio of Sn/Cu in the product) solid particles fabricated by spray pyrolysis. A quantitative understanding of the phase evolution of CuSny particles during oxidation was obtained through Rietveld refinement analysis of the X-ray diffraction (XRD) patterns. To better understand the oxidation behavior of CuSny particles under high temperature, in situ XRD measurements were conducted in ambient air. Kinetics experiments were performed to determine the oxidation kinetics of CuSny particles and the oxidation mechanisms at different temperatures. Together, these results were used to identify the CuSny particle composition that has optimal oxidation resistance and spherical morphology.
Experimental
CuSny particle preparation
We synthesized the CuSny particles following procedures reported previously.13 In brief, a 150 mL aqueous precursor solution that contained 1 M Cu(NO3)2 (99.5%, STREM CHEMICALS), 0.1 M HNO3 (70%, SIGMA-ALDRICH), and 4.8 M ethylene glycol (EG, 98% SIGMA-ALDRICH) was firstly prepared. SnCl2 (≥98% FISHER SCIENTIFIC) was used as the tin source and then added to the aqueous precursor solution with a concentration based on the targeted Sn/Cu atomic ratio (from 0 to 1) in the product particles. The precursor solution was atomized by a 1.7 MHz ultrasonic generator into droplets with volume mean diameter of 5 μm, measured experimentally under similar experimental conditions.30 The droplets were carried by N2 (99.5%, AIRGAS) into a quartz tube reactor heated by two furnaces in series both set at 1000 °C. A polytetrafluoroethylene (PTFE) filter was used to collect the products at the end of the quartz tube after the powders were cooled down by N2 gas. The residence time of the process was estimated to be 1.2 s, measured and calculated by the same procedures reported previously.13CuSny powder characterization
Scanning electron microscopy (SEM, HITACHI SU-70) and transmission electron microscopy (TEM, JEOL 2100 FEG) with energy dispersive X-ray spectroscopy (EDS) were utilized to understand the particle morphology, structure, and elemental distributions. CuSny powders were suspended and sonicated in ethanol for 1 min before being added dropwise onto silicon wafers for SEM and TEM grids for TEM. X-ray photoelectron spectroscopy (XPS, Kratos Axis 165) was performed to understand the element distributions on the powder surface and sub-surface (sputtered in vacuum by argon ions for 20 min with the sputtering gun set at 4 kV and 5 mA).X-ray diffractometry (Bruker D8 advance) was used to obtain crystallographic information of the CuSny powders. Rietveld refinement was conducted by Topas-5 software from Bruker to determine the phase composition of the powders. In situ XRD (Bruker C2 Discover) was performed to continuously monitor the phase evolutions of the CuSny powders during oxidation. Powders were placed on a Pt plate and heated by a programmed hot stage in ambient air. When the powders reached the targeted temperature, the hot stage was kept at that temperature for 15 min for the XRD measurements. After the XRD measurements were completed, the temperature of the Pt plate was raised to the next target. Thermogravimetric (TG) and differential scanning calorimetry (DSC) results were measured by a SDT Q600 (TA Instruments) to understand the weight gain and heat flow during the oxidation. Alumina pans containing ∼2 mg CuSny powders were heated from room temperature to 600 °C at a rate of 5 °C min−1 under 100 mL min−1 of compressed O2 flow.
Oxidation kinetics investigation
The oxidation kinetics of CuSny particles was studied by performing the reaction in a U-shape tubular quartz reactor with a 10 mm inner diameter. Typically, 0.5 g of the particle powder was loaded into the quartz reactor, and the reactor was placed inside a furnace (National Electric Furnace FA120 type) controlled by a Watlow Controller (96 series). A K-type thermocouple was placed inside the furnace to monitor the particle temperature by attaching the tip of the thermocouple to the outer wall of the powder bed. The particle powder was heated to the desired temperature in He atmosphere (30 mL min−1) at a ramp rate of 5 °C min−1. Afterwards, O2 (1 mL min−1, 99.9993% purity, Airgas) diluted in N2 (as internal standard) (15 mL min−1, 99.95% purity, AIRGAS) and He (as balance gas) (35 mL min−1, 99.9993% purity, AIRGAS) was introduced to the reactor through heated transfer lines held at 70 °C. The O2 concentration in the reaction system was quantified using a gas chromatograph (Agilent Technologies, 6890N) equipped with a ShinCarbon ST packed column connected to a thermal conductivity detector (TCD). The volume percent of O2 in the feed stream was set to be 1.4% and 10%, respectively, by changing the flow rate of O2 and balancing the total flow using He.Results and discussion
1. CuSny particle preparation by spray pyrolysis
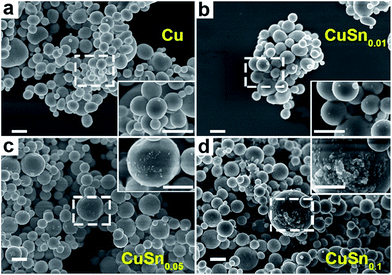
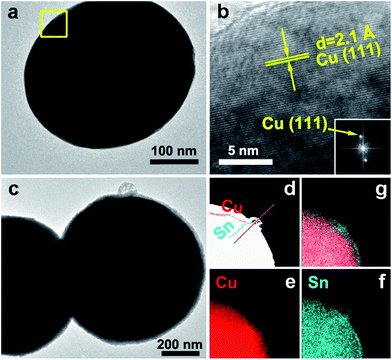
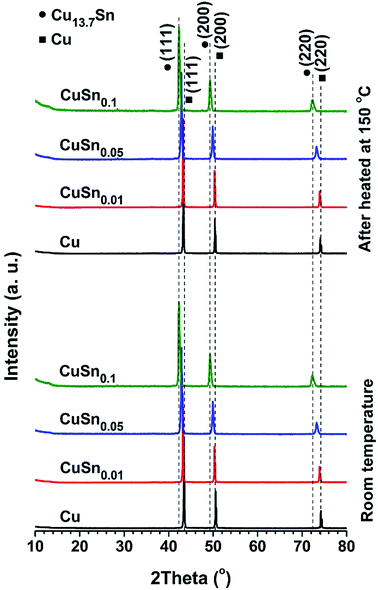
The CuSny particles were obtained by reducing the corresponding metal salts during spray pyrolysis. After the precursor was atomized into droplets, the droplets were transported by carrier gas into the quartz tube reactor. In the reactor, Cu(NO3)2 and SnCl2 were hydrolyzed into hydroxides. Subsequently, the hydroxides were decomposed into metal oxides, which were then reduced to metals by the reducing gases (H2 and CO) generated through the decomposition of EG.30,31 At the same time, a series of processes occurred, including solvent evaporation, solute precipitation, chemical reaction, nucleation, and crystal growth, leading to the formation of particles. Based on our previous findings, high temperatures and long residence times promote the formation of solid particles.13 Herein, the CuSny particles were produced at 1000 °C with a residence time of 1.2 s.Cu particles display solid and spherical structures with smooth surfaces, as demonstrated by SEM (Fig. 1a) and TEM (Fig. 2a) images. The lattice fringes in Fig. 2b represent the (111) plane of Cu (PDF no. 01-070-3038) with a d-spacing of 2.1 Å. The corresponding diffraction pattern attributed to the Cu(111) plane (inset of Fig. 2b) is obtained by performing fast Fourier transform (FFT), suggesting a high degree of crystallinity. This hypothesis is also validated by the pronounced Cu peaks in XRD spectrum (Fig. 3).
With increasing Sn concentration, the CuSny particles retain spherical and solid structure when y ≤ 0.1, as shown in SEM (Fig. 1b–d) and TEM (Fig. 2c, S2a and b†) images. The number mean diameter of the CuSny particles is 710 nm, same as our previous work.13 Small particles are observable on the surface of CuSny (y ≤ 0.1) sample. These small particles are mainly composed of Sn, validated by EDS mapping of Cu and Sn elements (Fig. 2e–g). We believe these small Sn particles originate from evaporation and gas-to-particle conversion. The vapor pressures of SnO and Sn at 1000 °C are 370 Pa and 1.5 × 10⁻² Pa, respectively.32,33 The evaporated SnO may be reduced to Sn by the reducing gases from EG decomposition and nucleate into small particles. With the increase of the relative concentration of Sn in the powder, Sn began to dissolve into Cu matrix to form a Cu–Sn solid solution, resulting in a blue shift of the Cu peaks to Cu13.7Sn (PDF no. 03-065-6821) peaks, as shown in Fig. 3. For the CuSn0.1 powders, the existence of Cu13.7Sn phase is attributed to (i) the similar crystal structure and same Fm![[3 with combining macron]](https://www.rsc.org/images/entities/char_0033_0304.gif) m point group symmetry of Cu and Cu13.7Sn;34 (ii) the lower Sn/Cu ratio (less than that of precursor = 0.1) in the particle center due to the Sn enrichment on the particle surface; (iii) stable phase of Cu13.7Sn when Sn/Cu atomic ratio is close to 0.1.35
m point group symmetry of Cu and Cu13.7Sn;34 (ii) the lower Sn/Cu ratio (less than that of precursor = 0.1) in the particle center due to the Sn enrichment on the particle surface; (iii) stable phase of Cu13.7Sn when Sn/Cu atomic ratio is close to 0.1.35
For CuSny (y ≥ 0.1) particles, the small Sn particles on the particle surface tend to coagulate into bigger structures (Fig. S1 and S2c–f†). Since the set points of the furnaces (1000 °C) are higher than the melting point of bulk Sn (230 °C),36 melted Sn may have formed the interconnection between adjacent particles when y = 0.2 and 0.4 (highlighted by dashed circles in Fig. S1a and b†) and even led to the coalescence of CuSn0.8 and CuSn particles at the surface into islands (Fig. S1c, d and S2e and f†). The melting points of Cu (1085 °C) and Cu–Sn solid solutions (from 1085 °C (Sn at% = 0) to 945 °C (Sn at% = 10%)) are much higher than that of Sn.34 Thus, the coalescence of the CuSny also indicates that a Sn-enriched layer is on the particle surface.
To test this hypothesis, XPS measurements and EDS line scan characterizations were performed on the particle samples. Based on the XPS results shown in Fig. 4, the Sn/Cu atomic ratio is significantly higher on the particle surface (before sputtering) than beneath the surface (after sputtering) or in the precursor. The EDS line scan also validates that hypothesis. The relative Sn/Cu atomic ratio is higher on the particle surface than in the core (Fig. 2d and S3†). This difference of Sn and Cu distribution along particle radius may stem from the different precipitation rates between the salts and subsequent mass diffusion.37 The reported diffusivities are DCu-in-Sn = 7.57 × 10⁻¹¹ m2 s−1, DSn-in-Cn = 5.09 × 10⁻²⁴ m2 s−1, and DCu-in-Cu = 6.22 × 10⁻²⁶ m2 s−1 at 220 °C.38 In spray pyrolysis, the components with lower solubility precipitate earlier than those with higher solubility during the evaporation of droplet solvent.37 With the evaporation of HNO3 during the solvent evaporation, the hydrolysis of SnCl2 may accelerate the precipitation of SnO, while Cu(NO3)2 still remains dissolved in the droplet solvent.13,39 Together with the aforementioned small Sn particles depositing on the surface of CuSny particles, attributed to gas-to-particle conversion, a Sn-enriched layer is formed on the particle surface. The fluctuations of Sn/Cu atomic ratio (before sputtering, Fig. 4) are possibly caused by the irregular structures as shown in Fig. S1–S3.† Based on the mass balance calculations between the precursors and the product particles (mean diameter: 710 nm), the CuSn0.1 particle is composed of a Cu13.7Sn core and a 3 nm-Sn layer as the shell.13 For CuSn0.05 particle, a 2.1 nm Sn-enriched layer is estimated on a Cu32Sn core. For CuSn0.01 particles, the Cu core is encapsulated by a 1.2 nm Sn-enriched layer. Although only for a single particle, the EDS mapping results are consistent with this calculated Sn shell thickness. A summary of the experimental conditions to obtain the spherical CuSny (y ≤ 0.1) particles and their particle configuration is shown in Table 1.
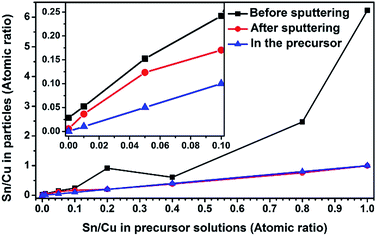 | ||
| Fig. 4 The Sn/Cu atomic ratios summarized from XPS results (Fig. S4†). The inset represents the regime where Sn/Cu ratio is below 0.1. Sputtering was conducted in vacuum by argon ions for 20 min. | ||
| Cu | CuSn0.01 | CuSn0.05 | CuSn0.1 | ||
| Particle configuration | Core | Cu | Cu | Cu32Sn | Cu13.7Sn |
| Shell | 1.2 nm Sn | 2.1 nm Sn | 3 nm Sn | ||
| [SnCl2] in precursor solution (mol L−1) | 0 | 0.01 | 0.05 | 0.1 | |
| [Cu(NO3)2] in precursor solution (mol L−1) | 1 | ||||
| Reaction temperature (°C) | 1000 | ||||
| Residence time (s) | 1.2 | ||||
The previously reported particle engineering methods mainly focus on the core–shell configuration to improve oxidation resistance.22,23,40–42 However, core–shell particle production may incorporate sophisticated operating procedures, restricting the future scale-up production. Our CuSny particles with Sn enrichment on surface, produced from one-step process, can protect Cu by forming a sacrificial oxide layer. As solid spherical particles are favored in the fields of solar cell metallization and interference packaging, the oxidation behavior of CuSny (y ≤ 0.1) powders was investigated next.
2. Oxidation behavior of CuSny particles
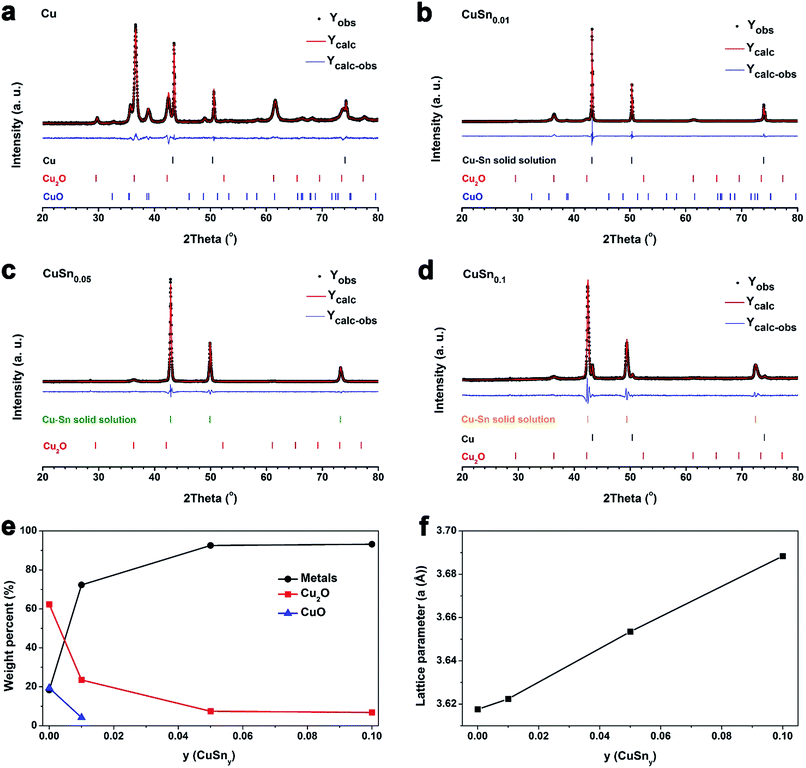
After the as-prepared CuSny (y ≤ 0.1) powders were oxidized at 150 °C for 10 min in ambient air, no detectable oxide peaks can be seen in the XRD patterns (Fig. 3). Since the low temperature oxidation normally results in the formation of amorphous oxides or oxide crystals with low crystallinity,11 peaks from the oxides are negligible, compared to those from metals. We also observed the oxide layers at the edges of both Cu and CuSn0.1 particles (Fig. S5†) after powder was oxidized at 100 °C for 60 min. However, the low degree of crystallinity of the oxide layer resulted in negligible peaks in the XRD spectrum.More pronounced peaks attributed to oxides began to appear in Cu particles, after the as-prepared powders were heated at 300 °C for 10 min in ambient air, while observable peaks belonging to Cu2O were exhibited in CuSn0.01, CuSn0.05, and CuSn0.1 particles (Fig. 5a–d). Therefore, Cu, CuSn0.01, CuSn0.05, and CuSn0.1 powders are oxidized more significantly at 300 °C than at 150 °C. To understand the phase composition in these powders, Rietveld refinement was applied to analyze the XRD patterns. The Cu particles exhibit the lowest oxidation resistance with only 18 wt% of post-oxidation powders remaining as Cu (Fig. 5e). CuSn0.01 powders display a sharp increase in the relative metallic amount (including Cu and Cu–Sn solid solution) in the post-oxidation products, from 18 wt% to 72 wt%, compared to that of Cu particles. However, CuO is still observable in the post-oxidation product of both Cu and CuSn0.01 powders. Further increase of the Sn loading in the particles led to a higher relative amount of metallic products after oxidation, namely 92 wt% in CuSn0.05 and 93 wt% in CuSn0.1 powders. The oxidation resistance of CuSn0.01 particles is close to that of Cu powders and significantly lower than CuSn0.05 and CuSn0.1 powders. This is possibly caused by the CuSn0.01 particles not having enough Sn compared to the CuSn0.05 and CuSn0.1 powders. As shown in Fig. 5f, the lattice parameter of Cu–Sn solid solution phases in the post-oxidation products of CuSn0.01, CuSn0.05, and CuSn0.1 particles increases with the relative amount of Sn in the as-prepared particles, and larger than the lattice parameter of Cu. This indicates the increasing Sn relative amount in the post-oxidation products, since dissolving Sn into Cu matrix can increase the lattice parameter of Cu–Sn solid solution,34 which is consistent with the results in Fig. 3. The lattice parameter of Cu–Sn solution in the post-oxidation product of CuSn0.01 powders is close to that of Cu phase in the post-oxidation product of Cu particles. This further verifies that the insufficient Sn loading in the as-prepared CuSn0.01 powders results in the similar oxidation resistance as that of Cu particles. Thus, the oxidation behavior of CuSn0.05 and CuSn0.1 particles was further investigated to find the optimal oxidation resistant composition, while Cu particles were utilized as the reference.
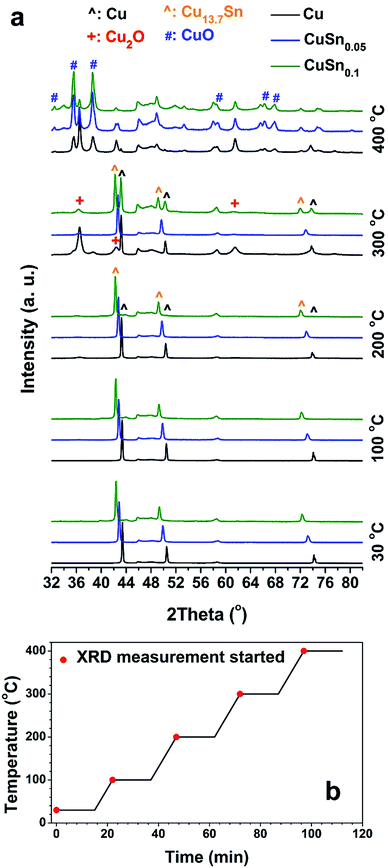
To further explore the phase evolution of the CuSny powders, in situ XRD measurements during oxidation were conducted with the temperature profile illustrated in Fig. 6b. When temperature is below 200 °C and the oxidation duration is 62 min, no significant oxide peaks can be seen in all XRD patterns of the CuSny (y = 0, 0.05, and 0.1) powders (Fig. 6a). Peaks attributed to Cu2O appear in all samples after being oxidized at 300 °C and the oxidation duration is 87 min. CuO phase is observed in CuSny powders when the temperature is increased to 400 °C and the oxidation duration is up to 112 min. Therefore, the onset temperature of significant oxidation of CuSny (y = 0, 0.05, and 0.1) powders is between 200 °C and 300 °C. To test this hypothesis, an oxidation experiment of long-time duration (up to 242 min) was conducted, keeping the temperature of powders at 200 °C during the in situ XRD measurements, as shown in Fig. S6.† The CuO phase does not appear even after the CuSny powders are heated for 227 min at 200 °C. Moreover, peaks of Cu2O are observed after the powders are heated for 17 min, though the intensities of its peaks were low. The continuous oxidation of Cu, CuSn0.05, and CuSn0.1 powders leads to the increasing intensities of Cu2O peaks. However, their intensities are still not comparable with those of metal peaks, even after being oxidized for 227 min, especially for the oxidation of CuSn0.05 and CuSn0.1. These results show that the CuSn0.05 and CuSn0.1 powders are more oxidation resistant than Cu particles.
3. Oxidation kinetics of CuSny powders
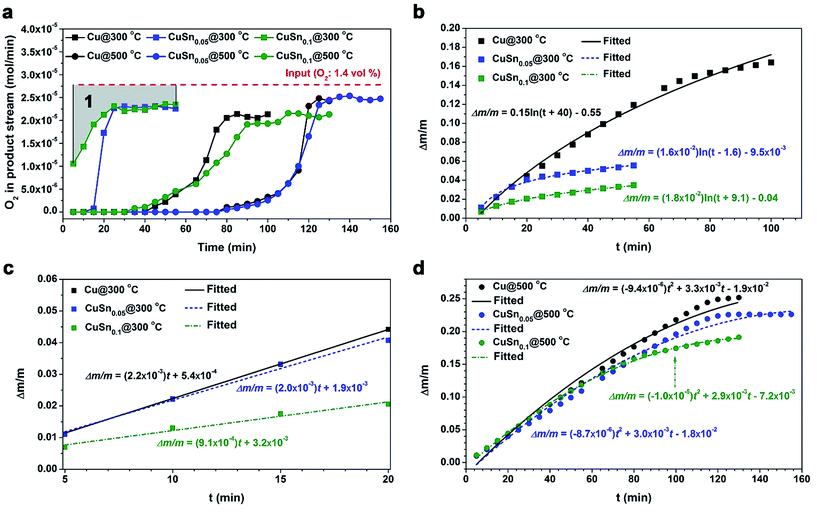
To quantitatively understand the oxidation kinetics of CuSny particles, the oxidation experiments were conducted in a packed-bed reactor by flowing a diluted O2 gas through the CuSny particles at different reaction temperatures. The difference of O2 flow rates between the feed and product streams represents the O2 gas consumption due to the oxidation of CuSny particles in the packed-bed reactor.The CuSny powders (y = 0, 0.05, and 0.1) were oxidized at 300 °C and 500 °C, respectively. Both oxidation temperatures were chosen based on the melting point of Sn (230 °C),36 onset temperature of significant oxidation of CuSny powders (200–300 °C, discussed in above), and the oxidation rate. The O2 partial pressure was measured in the product stream (Fig. S7†) and then converted into O2 gas flow rate (Fig. 7a). To better understand the oxidation extent of the powders with time, we assume all the consumption of O2 contributes to the weight gain of the powders. Therefore, the area enclosed by the line that represents the O2 flow rate in the feed stream at the top and the line which represents the O2 flow rate in the product stream at the bottom (Fig. 7a) is regarded as the consumption of O2 in the packed-bed or the weight gain of the powders. For example, the weight gain of CuSn0.1 particles being oxidized at 300 °C can be demonstrated by the area marked as “1” in Fig. 7a. By applying the trapezoidal rule, the relationships between the relative weight gain (Δm/m) and the oxidation time (t) at 300 °C and 500 °C are shown in Fig. 7b and d, respectively.
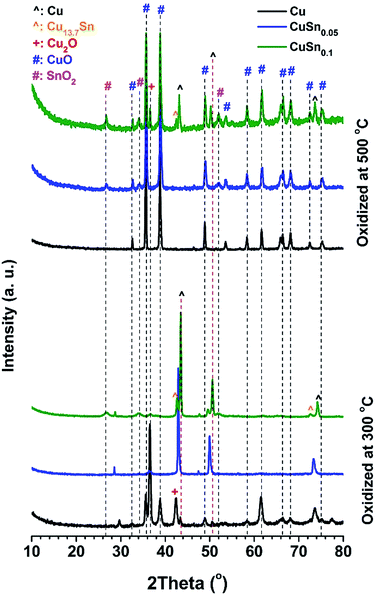 | ||
| Fig. 8 XRD patterns of powders after being oxidized in a packed-bed reactor at 300 °C (bottom) and 500 °C (top). The volume percent of O2 in the feed stream is 1.4%. | ||
The kinetic equations to describe the relative weight gains of Cu, CuSn0.05, and CuSn0.1 powders with the oxidation time are obtained by fitting the curves in Fig. 7b. CuSny (y = 0, 0.05, and 0.1) powders underwent rapid oxidation until 20 min. The rapidly formed oxide layer, consisting of both copper and tin oxides, may reduce the oxidation rates of these particles after 20 min. Thus, the relative weight gains with oxidation time can be described by logarithmic equations. The higher reactivity of Sn towards O2 than Cu causes the faster formation of oxide layer,25,26 which may lead to the relative weight gains of powders in the following sequence: Cu > CuSn0.05 > CuSn0.1.
As shown in Fig. 7c, in the first 20 min of oxidation, the oxidation rates of these particles are observed to obey the linear equations. The apparent rate constants of the oxidation rate in the initial 20 min can be obtained by:
 | (1) |
According to classic oxidation theory, the fast formation of the oxide layer in the initial oxidation step will set up a strong electric field in the oxide layer, creating an obstacle to diffusion of O2−, and resulting in the logarithmic growth of oxide layer.15 Therefore, we believe that the oxidation of Cu, CuSn0.05, and CuSn0.1 powders at 300 °C is controlled by the migration of absorbed O2− through the oxide layer.
Some researchers also claimed that the oxidation of Cu-based composite particles was controlled by the internal diffusion of O2 through the oxide ash layer on the particle surface by analyzing their experimental results using a shrinking-core model (SCM).45 As detailed in Section 3 of ESI,† SCM was used to analyze the experimental data in Fig. 7b. This model does not clearly explain the experimental observations for the following reasons: (1) the diffusivities of O2 through oxide ash layer either cannot be obtained (for Cu particles) or are 104 higher than reported values for the diffusion coefficients at the same temperature (for CuSn0.05 and CuSn0.1 particles), as shown in Fig. S13.† This phenomena may be attributed to the different experimental conditions between the reported work and ours. In the reported work, the oxidation of Cu–Al2O3 composite particles was conducted in a fluidized-bed,45 which has different mass transport phenomena than that in a packed-bed of CuSny solid particles. (2) The key assumption in the SCM of an oxide layer of uniform thickness16 may not be appropriate for CuSny powders, which have oxide layers that vary in thickness as shown in Fig. S8.† Therefore, we believe the O2− migration through the oxide layer instead of the internal diffusion of O2 through the oxide ash layer controls the oxidation of CuSny particles at 300 °C.
The kinetic equations to describe the weight gains of Cu, CuSn0.05, and CuSn0.1 powders with the oxidation time are obtained by fitting the plots in Fig. 7d. The relative weight gains of these particles with the oxidation time can be described by parabolic formula. The oxidation mechanism could change dramatically by elevating the oxidation temperature and this results in the change in oxidation behavior of the materials, as evidenced by the shifting of oxidation equations from logarithmic to parabolic or cubic.14,15,17
For CuSn0.1 particles, the sufficient Sn loading may greatly increase the their oxidation resistance by fast formation of a self-limiting oxide layer in the initial stage of oxidation, due to the higher activity of Sn towards O2 than Cu.14,15,25,26 The rapid growth of the SnO2 layer has been reported can block further incorporation of oxygen into the bulk,46 which can prevent further bulk oxidation. In addition, grain growth of oxides is observed in the post-oxidation powders of CuSn0.1 at 500 °C. The full width at half maximum (FWHM) of the SnO2 peak at 26.7° decreases from 1.056 (oxidized at 300 °C) to 0.441 (oxidized at 500 °C), as shown in Fig. 8. The FWHM of the Cu2O peak at 36.6° decreases from 0.611 (oxidized at 300 °C) to 0.254 (oxidized at 500 °C). The CuO phase does not appear in the post-oxidation sample at 300 °C. In the sample at 500 °C, the FWHM of the CuO peak at 35.8° is 0.312. Therefore, after being oxidized at 500 °C, the oxides in CuSn0.1 powders display a higher degree of crystallinity, because the smaller FWHM represents larger size of crystalline domains based on Scherrer equation. Therefore, the decrease of FWHM of XRD peaks implies the grain growth in the powders. Grain growth was also observed in the post-oxidation products of Cu and CuSn0.05 particles. The FWHMs of the CuO peak at 35.8° are 0.233 for CuSn0.05 particles and 0.308 for Cu particles at 500 °C. Furthermore, the TEM images of the post-oxidation products of 500 °C also display higher degree of crystallinity than at 300 °C (Fig. S9 and S8,† respectively). Thus, compared to the post-oxidation sample of 300 °C, results suggest the oxides undergo grain growth during the oxidation of 500 °C. The grain growth of the oxide may be the rate-limiting step for the oxidation of Cu, CuSn0.05, and CuSn0.1 particles at 500 °C, with the relative weight gain with oxidation time following a parabolic equation, which is consistent with similar phenomena observed by other researchers in Cu oxidation.17,47
The relative weight gain (Δm/m) of Cu particles also approaches the theoretical limit given by complete oxidation of Cu to CuO, which is 0.25. Based on the theoretical calculation, the weight gains of CuSny (y ≤ 0.1) particles given by complete oxidation to CuO and SnO2 are also 0.25. Therefore, the oxidation extent of CuSn0.1 particles within 100 min during the packed-bed reaction, which is 0.19 (Fig. 7d), is lower than the theoretical limit and the oxidation extent of Cu particles.
To further examine the oxidation resistance of CuSn0.1 powders, O2 concentration in the feed stream was increased from 1.4 vol% to 10 vol%. As shown in Fig S10,† even though the O2 concentration in the feed stream increases by ∼7 times, the relative weight gain of CuSn0.1 powders only increases by 1.6 times. This suggests that the O2 gas concentration may not be the possible rate-limiting step of the particle oxidation at 500 °C. The relative weight gain of CuSn0.1 powders during the oxidation under 10 vol% O2 is close to that of Cu particles during the oxidation under 1.4 vol% O2 at 500 °C. This also implies the existence of Sn-enriched layer on the CuSn0.1 particles greatly improves the oxidation resistance compared to Cu particles. In TGA measurements, significant weight gain can be observed from 133 °C for Cu particles, which is 44 °C lower than that of CuSn0.1 particles (Fig. S11†). In addition, the relative weight gain of Cu is 4% higher than that of CuSn0.1 at 233 °C.
As discussed, spherical solid CuSny particles are promoted when the Sn/Cu atom ratio is below 0.1. The thickness of the Sn-enriched layer on the spherical particle surface increases with Sn loading in the particles, which is supported by SEM (Fig. 1), TEM with elemental mappings (Fig. 2), XPS (Fig. 4), and mass balance calculations (Table 1). Our engineering of CuSny particles with a Sn-enriched layer on the surface has been validated can increase the oxidation resistance of powders, as shown in the XRD with refinement (Fig. 5), in situ XRD (Fig. 6), and packed-bed oxidation (Fig. 7). Furthermore CuSn0.1 particles exhibited highest oxidation resistance among all the CuSny (y ≤ 0.1) particles with desired spherical morphology at both 300 °C and 500 °C.
Conclusions
Spray pyrolysis has been utilized to fabricated CuSny products with Sn/Cu atomic ratio ranging from 0 to 1. Spherical micron-sized CuSny solid particles are promoted when the Sn/Cu atomic ratio is below 0.1. CuSny (y ≤ 0.1) particles with a Sn-enriched layer on the particle surface exhibited better oxidation resistance than Cu particles, as confirmed by XRD with Rietveld refinement analysis, in situ XRD, and oxidation kinetics studies. Based on theoretical analysis of the oxidation, the migration of O2− through the oxide layer is a possible rate-limiting step when CuSny powders are oxidized at 300 °C. For oxidation at 500 °C, grain growth of the oxide likely controls the oxidation process.Micron-sized solid powders with high oxidation resistance and conductivity are a promising alternative material to replace noble metal-based conductive powders, such as Ag and Au, in the fields of printed electronics, interference packaging, and solar cells metallization. CuSn0.1 powders displayed the highest oxidation resistance with best spherical morphology among the CuSny powders. In addition, the scalable particle fabrication process provides an extra benefit for industrial-scale manufacturing. However, to evaluate the utility of these powders for applications requires high conductivity. Further characterization of their electrical properties is still demanded, and is the subject of ongoing investigation in our group.
Acknowledgements
This work was supported by National Science Foundation (CBET-1336581) and by the DuPont Company. The authors acknowledge the support of the Maryland NanoCenter and its AIMLab. The authors gratefully acknowledge the assistance of Dr Sz-Chian Liou (AIMLab) for TEM, Dr Peter Zavalij for XRD, and Dr Karen Gaskell for XPS (Department of Chemistry & Biochemistry, University of Maryland).Notes and references
- B. Comiskey, J. D. Albert, H. Yoshizawa and J. Jacobson, Nature, 1998, 394, 253–255 CrossRef CAS.
- Y. Li, Y. Wu and B. S. Ong, J. Am. Chem. Soc., 2005, 127, 3266–3267 CrossRef CAS PubMed.
- R. Faddoul, N. Reverdy-Bruas and A. Blayo, Mater. Sci. Eng., B, 2012, 177, 1053–1066 CrossRef CAS.
- T. Wang, X. Chen, G.-Q. Lu and G.-Y. Lei, J. Electron. Mater., 2007, 36, 1333–1340 CrossRef CAS.
- S. Mokkapati, F. J. Beck, A. Polman and K. R. Catchpole, Appl. Phys. Lett., 2009, 95, 053115 CrossRef.
- T. L. Temple and D. M. Bagnall, J. Appl. Phys., 2011, 109, 084343 CrossRef.
- R. Venkata Krishna Rao, K. Venkata Abhinav, P. S. Karthik and S. P. Singh, RSC Adv., 2015, 5, 77760–77790 RSC.
- T. Yonezawa, Y. Uchida and H. Tsukamoto, Phys. Chem. Chem. Phys., 2015, 17, 32511–32516 RSC.
- T. Yonezawa, H. Tsukamoto and M. Matsubara, RSC Adv., 2015, 5, 61290–61297 RSC.
- K. Venkata Abhinav, R. Venkata Krishna Rao, P. S. Karthik and S. P. Singh, RSC Adv., 2015, 5, 63985–64030 RSC.
- J. H. Kim, S. H. Ehrman and T. A. Germer, Appl. Phys. Lett., 2004, 84, 1278–1280 CrossRef CAS.
- A. A. Istratov, C. Flink, H. Hieslmair, S. A. McHugo and E. R. Weber, Mater. Sci. Eng., B, 2000, 72, 99–104 CrossRef.
- Y. Liang, R. Felix, H. Glicksman and S. Ehrman, Aerosol Sci. Technol., 2017, 51, 430–442 CrossRef CAS.
- Z. Feng, C. R. Marks and A. Barkatt, Oxid. Met., 2003, 60, 393–408 CrossRef CAS.
- N. Cabrera and N. F. Mott, Rep. Prog. Phys., 1949, 12, 163–184 CAS.
- O. Levenspiel, Chemical Reaction Engineering, John Wiley & Sons, 3rd edn, 1999 Search PubMed.
- K. Fujita, D. Ando, M. Uchikoshi, K. Mimura and M. Isshiki, Appl. Surf. Sci., 2013, 276, 347–358 CrossRef CAS.
- L. Yuan, C. Wang, R. Cai, Y. Wang and G. Zhou, J. Appl. Phys., 2013, 114, 023512 CrossRef.
- Z. Xu, E. Lai, Y. Shao-Horn and K. Hamad-Schifferli, Chem. Commun., 2012, 48, 5626–5628 RSC.
- J. Li, Y. Li, Z. Wang, H. Bian, Y. Hou, F. Wang, G. Xu, B. Liu and Y. Liu, Sci. Rep., 2016, 6, 39650 CrossRef CAS PubMed.
- D. S. Jung, H. M. Lee, Y. C. Kang and S. B. Park, J. Colloid Interface Sci., 2011, 364, 574–581 CrossRef CAS PubMed.
- Y. Jianfeng, Z. Guisheng, H. Anming and Y. N. Zhou, J. Mater. Chem., 2011, 21, 15981–15986 RSC.
- I. Kim, Y. Kim, K. Woo, E.-H. Ryu, K.-Y. Yon, G. Cao and J. Moon, RSC Adv., 2013, 3, 15169–15177 RSC.
- M. K. Sharma, D. Qi, R. D. Buchner, W. J. Scharmach, V. Papavassiliou and M. T. Swihart, ACS Appl. Mater. Interfaces, 2014, 6, 13542–13551 CAS.
- W. L. Liu, W. J. Chen, T. K. Tsai, S. H. Hsieh and C. M. Liu, Appl. Surf. Sci., 2007, 253, 5516–5520 CrossRef CAS.
- C. M. Liu, W. L. Liu, W. J. Chen, S. H. Hsieh, T. K. Tsai and L. C. Yang, J. Electrochem. Soc., 2005, 152, G234–G239 CrossRef CAS.
- Z. Chen, S. Ye, I. E. Stewart and B. J. Wiley, ACS Nano, 2014, 8, 9673–9679 CrossRef CAS PubMed.
- S. P. Wu, R. Y. Gao and L. H. Xu, J. Mater. Process. Technol., 2009, 209, 1129–1133 CrossRef CAS.
- V. Deshpande, A. Kshirsagar, S. Rane, T. Seth, G. J. Phatak, U. P. Mulik and D. P. Amalnerkar, Mater. Chem. Phys., 2005, 93, 320–324 CrossRef CAS.
- K. Zhong, G. Peabody, H. Glicksman and S. Ehrman, J. Mater. Res., 2012, 27, 2540–2550 CrossRef CAS.
- H. Yue, Y. Zhao, X. Ma and J. Gong, Chem. Soc. Rev., 2012, 41, 4218–4244 RSC.
- J. C. Platteeuw and G. Meyer, Trans. Faraday Soc., 1956, 52, 1066–1073 RSC.
- W. F. Gale and T. C. Totemeier, Smithells Metals Reference Book, Butterworth-Heinemann, 2003 Search PubMed.
- N. Saunders and A. P. Miodownik, Bull. Alloy Phase Diagrams, 1990, 11, 278–287 CrossRef CAS.
- S. Chatterjee and M. Gupta, J. Appl. Crystallogr., 1975, 8, 492–493 CrossRef.
- Y. Ju, T. Tasaka, H. Yamauchi and T. Nakagawa, Microsyst. Technol., 2015, 21, 1849–1854 CrossRef CAS.
- A. Gurav, T. Kodas, T. Pluym and Y. Xiong, Aerosol Sci. Technol., 1993, 19, 411–452 CrossRef CAS.
- Z. Mei, A. J. Sunwoo and J. W. Morris, Metall. Trans. A, 1992, 23, 857–864 CrossRef.
- D. L. Perry, Handbook of Inorganic Compounds, CRC press, 2011 Search PubMed.
- M. Grouchko, A. Kamyshny and S. Magdassi, J. Mater. Chem., 2009, 19, 3057–3062 RSC.
- T. Yamauchi, Y. Tsukahara, T. Sakata, H. Mori, T. Yanagida, T. Kawai and Y. Wada, Nanoscale, 2010, 2, 515–523 RSC.
- Y. Kobayashi and T. Sakuraba, Colloids Surf., A, 2008, 317, 756–759 CrossRef CAS.
- Z. R. Dai, Z. W. Pan and Z. L. Wang, J. Am. Chem. Soc., 2002, 124, 8673–8680 CrossRef CAS PubMed.
- Y. Duan, Phys. Rev. B: Condens. Matter Mater. Phys., 2008, 77, 045332 CrossRef.
- S. Y. Chuang, J. S. Dennis, A. N. Hayhurst and S. A. Scott, Energy Fuels, 2010, 24, 3917–3927 CrossRef CAS.
- C. Korber, A. Wachau, P. Agoston, K. Albe and A. Klein, Phys. Chem. Chem. Phys., 2011, 13, 3223–3226 RSC.
- S. Matsnnaga and T. Homma, Oxid. Met., 1976, 10, 361–376 CrossRef.
Footnote |
| † Electronic supplementary information (ESI) available: Additional morphology and structure characterization of CuSny particles (Section 1); additional results of oxidation behavior of CuSny particles (Section 2); detailed simulation procedures of shrinking-core model (Section 3). See DOI: 10.1039/c7ra02080e |
| This journal is © The Royal Society of Chemistry 2017 |

