 Open Access Article
Creative Commons Attribution 3.0 Unported Licence
Improvement of the selectivity to aniline in benzene amination over Cu/TS-1 by potassium†
Mi Nan,
Yuecheng Luo,
Guiying Li* and
Changwei Hu *
*
Key Laboratory of Green Chemistry and Technology, Ministry of Education, College of Chemistry, Sichuan University, 29 Wangjiang Road, Chengdu, Sichuan 610064, China. E-mail: changweihu@scu.edu.cn; gchem@scu.edu.cn; Fax: +86 28 85411105; Tel: +86 28 85411105
First published on 19th April 2017
Abstract
Two different methods of introducing potassium into Cu/TS-1 were conducted and the catalysts obtained showed a rather different catalytic activity in the ammoxidation of benzene to aniline. K could enter the Cu/TS-1 catalyst under reaction conditions, and the resultant catalyst exhibited acceptable selectivity of 99.5% to aniline. However, the catalyst with potassium introduced by wet impregnation exhibited undesirable selectivity (<40%). X-ray photoelectron spectroscopy showed that Ti–O–K formed when potassium was introduced by wet impregnation while K–O–Si formed when K was introduced under reaction conditions. In the latter case, K showed no influence on the Ti site of TS-1, and the formation of K–O–Si species weakened the Brönsted acidity and enhanced the Lewis acid strength, providing active centers for easy adsorption of ammonia, which was considered to be one of the reasons for the high selectivity.
1 Introduction
Titanium silicalite-1 (TS-1) has attracted much attention for its excellent catalytic properties in many oxidation reactions, especially with the use of aqueous H2O2 as an oxidant.1–5 Ti–O–O–H peroxo species were considered to be the active intermediates formed by the interaction of H2O2 molecules with the tetrahedral Ti sites.6,7 The TS-1/H2O2 system has been applied in the epoxidation of olefins,8 hydroxylation of benzene,9 oxidation of alkanes10 and phenol,11 desulfurization of liquid fuels,12 and ammoxidation of ketones.13 To improve the catalytic activity and selectivity of TS-1, a lot of methods including post-synthesis, such as the hydrothermal process, acid or basic treatment, secondary impregnation and calcination,14–20 have been exploited. B. Wang18 et al. reported the post-modification of hierarchical TS-1 with TPAOH and NH3·H2O to obtain relatively high crystallinity, grooves on the surface and intracrystalline voids. S. Du et al. synthesized TS-1 zeolites with secondary macropores by using two different fluoride-containing chemical etching post-treated routes, which showed remarkably enhanced catalytic activity in oxidative desulfurization reactions.19 While post-synthesis helped to improve the catalyst performance, most processes were complex and not environmentally friendly. Therefore, a more economical route is desirable.Among the variety of strategies in the post-synthesis of TS-1, many researches on doping by alkali metal, especially potassium, were reported.21–23 It had been commonly considered that the better catalytic performance was due to the formation of SiO–M+ (M+ = Li+, Na+, K+).24,25 Y. Kuwahara et al. introduced alkali metal cations into microporous titanosilicate molecular sieves, obtaining a significant enhancement of the oxidation of cyclohexene and styrene. They attributed the increased activity to the cation–π interaction with the C![[double bond, length as m-dash]](https://www.rsc.org/images/entities/char_e001.gif) C bonds in alkenes.26 T. Tatsumi et al. found that potassium present in the silanol group (Si–O–K) in the vicinity of titanium in TS-1 had a much higher activity than potassium present as a charge-compensating cation in zeolite.25
C bonds in alkenes.26 T. Tatsumi et al. found that potassium present in the silanol group (Si–O–K) in the vicinity of titanium in TS-1 had a much higher activity than potassium present as a charge-compensating cation in zeolite.25
In the last two decades, Cu-based catalysts had been found to exhibit excellent catalytic activity on C–H bond functionalizations.27–29 In our previous work, the catalysts with typical MFI structure were greatly improved by the addition of copper for the C–H bond activation of benzene and its derivatives. B. Guo et al. obtained 1% yield and 88% selectivity to aniline in the direct oxyamination of benzene to aniline over Cu/TS-1 catalyst, and proposed that Ti–O–Cu species may provide specific chemisorption sites on which ammonia could be selectively activated.32 T. Yu et al. improved the reaction by reactive distillation method and obtained 12.4% yield and 84.7% selectivity to aniline, and proposed that NH2OH was the reaction intermediate.31 However, in these previous work, the simultaneous formation of phenols or nitrobenzene made the selectivity to aniline not satisfactory. L. Xu et al.24 reported that introducing K into titanium–silica zeolite did not suppress the decomposition of hydroxylamine, but enhanced the catalytic activity of hydroxylamine formation. Moreover, there was a certain amount of hydroxyl on TS-1 which could combine with ammonia, and less ammonia was accessible to Ti–O–Cu. Above all, introducing K into Cu/TS-1 may form Si–O–K species and reduce the number of hydroxyl groups, which made more ammonia activated by Ti–O–Cu and was beneficial to NH2OH. Under the above considerations, we studied the effect of potassium addition on the selectivity to aniline.
2 Experimental
2.1 Catalyst preparation
TS-1 was synthesized following the procedure reported by T. Yu et al.31 Briefly, 40 g of isopropanol (≥95 wt%) and 40 g of DI water were slowly added to a beaker containing 91 g of TEOS (tetraethyl orthosilicate, ≥28 wt%), then, 160 g of TPAOH aqueous solution (20 wt%) was added dropwise to the mixture under stirring. After stirred for 0.5 h, the mixture of 5 g titanium trichloride solution (≥15 wt%) dissolved in 20 g DI water was dropped into the solution. After that, the resulted solution was heated in a water bath keeping at 55 °C for 1 h to remove isopropanol and at 85 °C for about 6 h to promote the hydrolysis of TEOS. In this step, the volume of solution was kept by adding small amount of water at about 1.0 mL min−1. The precursor was transferred to a 0.5 L Teflon-lined steel autoclave and heated to 175 °C for 7 days under autogenous pressure. After crystallization, the product was separated by filtration and washed with distilled water, then dried at 100 °C overnight and calcined at 550 °C for 10 h in air.Cu/TS-1 catalyst was prepared by wet impregnation method under negative pressure. In brief, the TS-1 support was placed on a tube with a branch pipe linked with circulating water vacuum pump to get rid of the gas in pores. After 0.5 h, aqueous solution with desired concentration of Cu(NO3)2 was dropped onto TS-1 from a separatory funnel connected to the tube under negative pressure. The mixture was dried at 80 °C after being kept for 24 h at room temperature, then dried at 100 °C overnight and calcined at 550 °C for 10 h in air. In the present work, the controlled Cu content was 2.5 wt% in Cu/TS-1.
2.2 Catalyst characterization
The X-ray powder diffraction (XRD) was performed on a LTD DX-1000 CSC diffractometer using Cu-Kα radiation (λ = 1.5405 Å) from 5 to 75°. The data were collected using a voltage of 40 kV and current setting of 30 mA.IR spectra were collected by using a FT-IR spectrometer (VERTEX 70) equipped with a MCT detector at 40 scans and 4 cm−1 resolution in the region of 4000–400 cm−1. IR study with NH3 as a probe molecule was also conducted. The mixed powder of catalyst and potassium bromide were added in IR cell, purged with N2 at 300 °C for 1 h. After cooling to room temperature, the gas was switched to NH3 with a flow rate of 30 mL min−1 for 30 min. Physically adsorbed NH3 was removed by nitrogen purging for 30 min with a flow rate of 30 mL min−1.
The amount of K was quantified by inductively coupled plasma method (ICP) on a Thermo E.IRIS atomic emission spectrometer. Catalysts were dissolved by 1 M H2SO4 at 60 °C for 1 h then transferred to a 50 mL volumetric flask and diluted with DI water to volume to prepare samples for ICP analysis.
The N2 adsorption and desorption isotherms were measured on a Micromeritics Tristar 3020 analyser, using conventional BET and BJH methods to quantify the value of surface areas and pore volumes of zeolite samples. Prior to analysis, the samples were degassed at 120 °C for 2 h and 300 °C for 2 h.
Ultraviolet-visible diffuse reflectance (DR UV-vis) spectra were recorded on a TU-1901 spectrometer with BaSO4 as standard at the scan range from 200 to 800 nm.
X-ray photoelectron spectroscopy (XPS) was performed with an AXIS Ultra DLD (KRATOS) spectrometer equipped with a monochromatic Al-Kα X-ray source (excitation energy = 1468.6 eV). The binding energies were referenced to the internal C 1s (284.8 eV) standard. Spectrum curve fitting was carried out using the XPS Peakfit software with the smart background correction.
2.3 Measurements of catalytic activity
The amination of benzene to aniline over 2.5 wt% Cu/TS-1 was carried out in a 50 mL round bottom flask equipped with a reflux condenser. The catalyst and benzene was added to the flask, and the reactant mixture of H2O, NH3·H2O, H2O2 and KNO3 kept at 0 °C was dropped into the flask at 0.20 L min−1 by peristaltic pump with stirring vigorously at 333 K for 4 h. The addition of H2O to dilute H2O2 was to prevent nitrobenzene formation.31,32 Moreover, there was a competition between amination and hydroxylation of benzene in the reaction system, it might be more advantageous to the hydroxylation of benzene to phenol when increased the molar ratio of H2O2 to benzene.30 After cooling to room temperature, the liquid mixture was separated from the catalyst by filtration. Then, the liquid phase was qualitatively analysed with GC-MS (Agilent, 5973 Nework6890N) and quantified by HPLC (Agilent 1200) equipped with a ZORBAX Eclipse XDB-C18 column and an UV detector. Due to some losses of benzene and no ring opened products detected in the process,30 the yield of products, selectivity to aniline, and conversion of benzene were calculated by the following:| Yield (mol%) = mole amount of product/mole of initial benzene added. |
| Selectivity to aniline (%) = mole of aniline/the total mole of products |
| Conversion of benzene (%) = yield of aniline + yield of phenol |
The reported value of yield was the average of the data at least three parallel tests, and the error of aniline yield was less than 0.05 mol%, detailed data was shown in Table S1.† The effect of benzene loading on the amination reaction have also been investigated (Table S2†) with no obvious variation on the yield.
3 Results and discussion
3.1 Catalytic amination of benzene
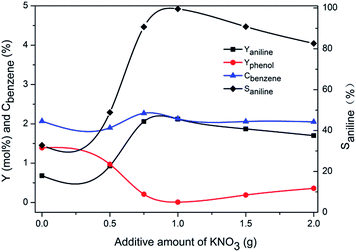
Further increasing potassium content would decrease the selectivity to aniline. To probe the reason for decreased selectivity, a control experiment was carried out to assertion the amount of dissolved ammonia with increased amount of KNO3 added. The results of acid base titration with methyl red as indicator was shown in Table 1. It proved that the solubility of ammonia decreased in potassium nitrate solution with increase amount of KNO3. Therefore, the reduced solubility of ammonia in the solution containing excess potassium nitrate might be the reason for the decreased selectivity.
| Amount of K (g) | Ammonia concentration (mol L−1) |
|---|---|
| a Measuring conditions: 0.5 g catalyst, 1 g KNO3, 40 mL H2O, 10 mL NH3·H2O, 2.5 mL H2O2, 60 °C, 4 h. | |
| 0 | 2.79 |
| 0.5 | 2.75 |
| 1 | 2.72 |
| 1.5 | 2.59 |
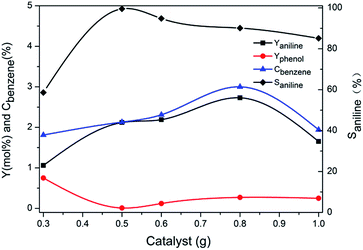
Fig. 2 illustrated the influence of the quantities of catalyst on the reaction. With increase amount of catalyst, the yield of aniline, conversion of benzene went up initially, reaching the maximum of 2.7%, 3.0% respectively with 0.8 g catalyst used and then decreased, whereas the maximum selectivity to aniline was 99.5% with 0.5 g catalyst used and decreased to 90.0% when 0.8 g catalyst was added. With further increase of the catalyst from 0.8 g to 1.0 g, the conversion of benzene dropped from 3.0% to 1.9%. It was indicated that the excessive amount of catalyst might also accelerate the decomposition of hydrogen peroxide and decrease the desired catalytic performance as what has been reported.33
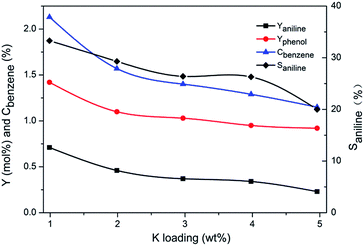
For comparison, Cu/TS-1–xK synthesized by impregnation method was tested under similar conditions in the absence of KNO3. The results were shown in Fig. 3. This series of catalysts exhibited a rather different catalytic performance. The selectivity to aniline was less than 40% on Cu/TS-1–1.0K, which was much lower than 99.5% over the corresponding one with the same K content (1.0K–Cu/TS-1). Besides, with the increase of K loading, the yield of aniline, conversion of benzene and selectivity to aniline decreased monotonically.
Since the highest selectivity to aniline was obtained with 0.5 g catalyst used, catalyst recycling experiments were performed with repeated uses of Cu/TS-1 with 0.5 g catalyst added under the same reaction conditions. In the repeated runs, no potassium nitrate was added in the reaction mixture solution. It can be seen from Table 2, the yield of aniline decreased slightly from 2.12 to 1.64% after being used in the first run and then remained almost unchanged with further runs. The declined activity during the recycling test may be caused by the leaching of Cu. Another control experiment using TS-1 as the catalyst in the presence of KNO3 was also carried out to test the effect of Cu. It found that TS-1 showed poor catalytic performance (the detail data was shown in Table S3†) and Cu was essential for the amination. The ICP results indicated that the Cu loading of the catalyst decreased slightly from 2.49 to 2.12% after being used for four runs and then remained stable, which accorded with the catalyst activity. Moreover, it demonstrated that the high selectivity of benzene to aniline was not due to the potassium ion in solution, while the potassium might be incorporated into Cu/TS-1, and the thus formed catalysts were rather stable with high selectivity to aniline.
| Recycling number | Yield (mol%) | Conversion of benzene (%) | Selectivity of aniline (%) | Cuc (wt%) | |
|---|---|---|---|---|---|
| Aniline | Phenol | ||||
| a Reaction conditions: a: 0.5 g 1.0K–Cu/TS-1, 40 mL H2O, 0.25 mL benzene, 10 mL NH3·H2O and 2.5 mL H2O2, reaction temperature 60 °C, reaction time 4 h.b 0.5 g Cu/TS-1, 40 mL H2O, 0.25 mL benzene, 10 mL NH3·H2O, 2.5 mL H2O2 and 1.0 g KNO3, reaction temperature 60 °C, reaction time 4 h.c Cu loading determined by ICP. | |||||
| 0b | 2.12 | 0.01 | 2.13 | 99.5 | 2.49 |
| 1 | 1.64 | 0.005 | 1.65 | 99.4 | 2.26 |
| 2 | 1.60 | 0.006 | 1.61 | 99.4 | 2.14 |
| 3 | 1.58 | 0.005 | 1.59 | 99.4 | 2.12 |
| 4 | 1.57 | 0.005 | 1.58 | 99.4 | 2.12 |
3.2 Catalyst characterization
| Entry | The total concentration of potassium nitrate (ppm) | The amount of potassium in solution (ppm) | The amount of potassium in catalyst (wt%) |
|---|---|---|---|
| a The reaction conditions.b 0.5 g catalyst, 50 mL H2O, 2.5 mL H2O2, 60 °C, 4 h.c The preparation method Cu/TS-1–xK. | |||
| 1 | 3.12 | 2.96 | 0.52 |
| 2 | 4.80 | 4.61 | 0.69 |
| 3 | 6.39 | 6.13 | 1.02 |
| 4 | 11.34 | 10.91 | 1.96 |
| 5 | 6.39 | 6.34b | 0.39b |
| 6 | — | — | 0.99c |
| 7 | — | — | 1.99c |
| 8 | — | — | 2.97c |
| 9 | — | — | 3.98c |
| 10 | — | — | 4.96 |
Entry 6–10 measured the potassium content in Cu/TS-1–xK used in activity experiment. The controlled potassium loading was 1.0, 2.0, 3.0, 4.0 and 5.0 wt% respectively. The result showed that more than 99% of potassium entered in Cu/TS-1. However, the catalyst showed lower performance compared to the catalyst with K introduced under reaction conditions.
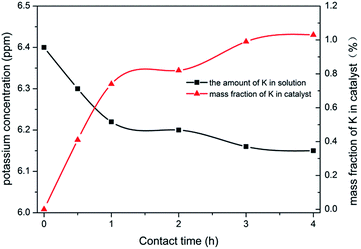
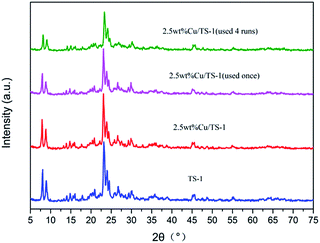
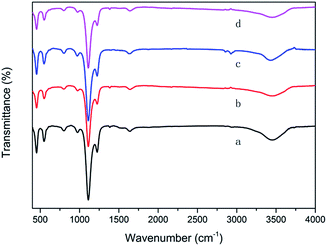
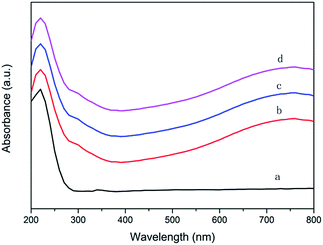
The above data showed that the potassium incorporated into Cu/TS-1 under NH3·H2O might be critical for promoting the selectivity to aniline. To prove the effect of NH3·H2O, the introduction of potassium into Cu/TS-1 in the presence of NH3·H2O was carried out. Since the highest selectivity was obtained when 1.0 g KNO3 was added according to Fig. 1, 0.5 g Cu/TS-1 was mixed with 1.0 g KNO3 under NH3·H2O at 60 °C with different contact time, and the thus obtained catalysts were tested with no KNO3 added. The result shown in Fig. 4 indicated that after K being introduced in the presence of NH3·H2O, the catalysts exhibited desirable selectivity to aniline just as xK–Cu/TS-1. With increasing contact time, the selectivity to aniline augmented continuously and reached the maximum of 99.3%, and then kept stable after 3 hours (the corresponding sample was named catalyst 1). Fig. 5 showed the concentration distribution of K in Cu/TS-1. It indicated that more potassium shifted from solution to Cu/TS-1 with time increasing then stabilized after 3 hours, which was consistent with the catalytic activity results. From the above data, the introduction of potassium in the presence of NH3·H2O was a critical factor for the increase of selectivity, while the potassium concentration and suitable contact time were beneficial to the transfer of K into Cu/TS-1, resulting in amination more advantageous in the competition with hydroxylation of benzene.25 The characterization of catalyst 1 indicated that the features of the sample (as shown in ESI†) were almost the same as those of 1.0K–Cu/TS-1 in BET surface area, XRD, FT-IR, XPS and NH3-IR.
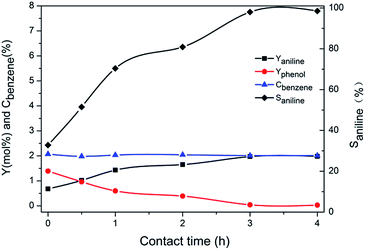 | ||
| Fig. 4 The effect of contact time between catalyst and KNO3 on the performance of the catalyst. Reaction conditions: 40 mL H2O, 0.25 mL benzene, 10 mL NH3·H2O and 2.5 mL H2O2, 60 °C, 4 h. | ||
| Samples | SBETa (m2 g−1) | VPb (cm3 g−1) | ΦPc (Å) |
|---|---|---|---|
| a Specific surface area calculated by BET method.b Total pore volume obtained at P/P0 of 0.99.c Adsorption average pore width. | |||
| 2.5 wt% Cu/TS-1 | 402 | 0.31 | 25.0 |
| 1.0K–Cu/TS-1 | 397 | 0.29 | 26.1 |
| Cu/TS-1–1.0K | 385 | 0.26 | 26.6 |
| Cu/TS-1–2.0K | 344 | 0.24 | 27.4 |
| Cu/TS-1–3.0K | 300 | 0.20 | 27.9 |
| Cu/TS-1–4.0K | 276 | 0.19 | 28.6 |
| Cu/TS-1–5.0K | 232 | 0.17 | 30.0 |
| 1.0K–Cu/TS-1 (used once) | 382 | 0.32 | 27.9 |
| 1.0K–Cu/TS-1 (used twice) | 373 | 0.29 | 26.6 |
| 1.0K–Cu/TS-1 (used third) | 370 | 0.27 | 26.2 |
| Catalyst 1 | 395 | 0.30 | 25.9 |
| Catalyst 2 | 388 | 0.25 | 27.0 |
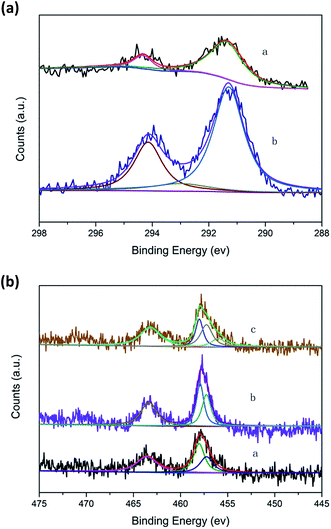 | ||
| Fig. 6 (a) K2p spectra of catalysts. (a) 1.0K–Cu/TS-1; (b) Cu/TS-1–1.0K. (b) Ti2p spectra of catalysts. (a) Cu/TS-1; (b) 1.0K–Cu/TS-1; (c) Cu/TS-1–1.0K. | ||
The Ti2p electron spectra of the catalysts were shown in Fig. 6b. Curve fitting of the Ti2p3/2 core level of Cu/TS-1 and 1.0K–Cu/TS-1 to two components showed that the higher binding energy peak at 458.5 eV could be attributed to the Ti species in the form of Ti–O–Cu,37 while the lower binding energy peak at 456.5 eV was usually assigned to titanium in tetrahedral coordination.29 Moreover, another peak at 455.6 eV was obtained in Cu/TS-1–1.0K, suggesting a new environmental chemistry of Ti formed after K was introduced by wet impregnation. We tentatively assigned it to Ti–O–K species because the K2p2/3 also showed the existence of K–O groups on the samples. It showed that different introducing methods of K could cause different state of K in Cu/TS-1. The introduction of K under reaction conditions would not influence the Ti site of Cu/TS-1 catalyst but Ti–O–K species would form when potassium was introduced by wet impregnation method.
3.3 Discussion
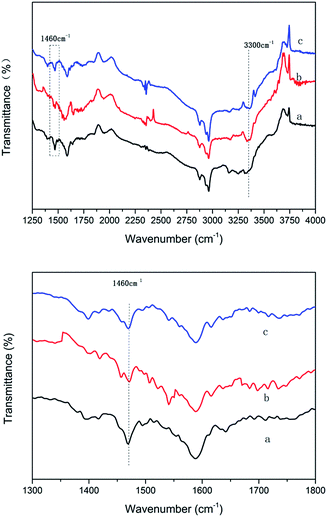
From the above data, the different introducing method of K would cause differences in content of potassium and the site occupied by potassium in Cu/TS-1, resulting in a rather different catalytic performance. The wet impregnation made almost all K into catalyst interacting with Ti then forming Ti–O–K species. The effect on Ti site might be harmful for the formation of the Ti–O–O–H peroxo species which was considered to be the active intermediates in TS-1/H2O2 system, resulting in a lower selectivity and conversion, which was in sympathy with previous report.25 By contrast, introducing potassium under reaction conditions, potassium entered Cu/TS-1 and formed xK–Cu/TS-1 catalyst, where the potassium would only exchange with SiO–H due to the faintly acidity of silanol and just formed Si–O–K species, which showed higher selectivity and good recyclability.According to NH3-IR result, the formation of Si–O–K species could weaken the Brönsted acid strength and enhance the Lewis acid strength of the catalyst. Z. Zhuo et al. reported that higher Lewis acidic strength of Ti active sites could promote the formation of NH2OH,47 and NH2OH was thought as the reaction intermediate in ammoxidation benzene to aniline.31,32,48 The formation of Ti–O–K might have negative impact on Ti site then the formation of NH2OH. If potassium was introduced firstly (the sample was named catalyst 2), the yield of aniline was only 0.14% with an extremely low selectivity of 9.7%, the XPS data of this sample indicated the formation of Ti–O–K species (data of characterisation of the catalyst were depicted in ESI†). It also illustrated that the K introduced by wet impregnation inclined to impact on the Ti site and exhibited undesirable catalytic performance. The XPS peak area ratios of Ti species for several typical samples were shown in Table S4.† In 1.0K–Cu/TS-1, there was no poison effect on Ti active sites, and the reduced Brönsted acid site could make more ammonia accessible to active site, and the formation of metal-N bond was considered as the critical step in amination.49 Therefore, Si–O–K species can be considered to be responsible for the high selectivity of benzene to aniline in 1.0K–Cu/TS-1 catalyst.
4 Conclusions
Introducing potassium under reaction conditions into Cu/TS-1 could form Si–O–K species which weakened the Brönsted acidity and enhanced the Lewis acidity thus improve the selectivity of benzene to aniline significantly, moreover, potassium exerted no poisoning effect on Ti active sites, and almost had no influence on SBET and VP, then the catalyst obtained was rather stable. The alkaline condition, the treatment time and the concentration of potassium nitrate were critical factors. Excessive amounts of potassium nitrate would reduce ammonia solubility and lessen the selectivity of amination. Introducing potassium by wet impregnation would form Ti–O–K and was harmful for the formation of NH2OH, resulted in undesirable catalyst performance. Further work is underway to enhance the conversion of benzene on Cu/TS-1 catalyst.Acknowledgements
Financial support from the NSFC (no. 21172157, no. 21372167 and no. 201321061) of China, and technical support from the Analytical and Testing Centre of Sichuan University are cordially acknowledged.Notes and references
- A. Bhaumik, P. Kumar and R. Kumar, Catal. Lett., 1996, 40, 47–50 CrossRef CAS.
- S. B. Shin, D.-W. Lee and D. Chadwick, J. Mol. Catal. A: Chem., 2016, 423, 478–488 CrossRef CAS.
- W. Cheng, X. Wang, G. Li, X. Guo and S. Zhang, J. Catal., 2008, 255, 343–346 CrossRef CAS.
- W. Fan, R.-G. Duan, T. Yokoi, P. Wu, Y. Kubota and T. Tatsumi, J. Am. Chem. Soc., 2008, 130, 10150–10164 CrossRef CAS PubMed.
- A. C. Alba-Rubio, J. L. G. Fierro, L. León-Reina, R. Mariscal, J. A. Dumesic and M. López Granados, Appl. Catal., B, 2017, 202, 269–280 CrossRef CAS.
- F. Bonino, A. Damin, G. Ricchiardi, M. Ricci, G. Spanò, R. D'Aloisio, A. Zecchina, C. Lamberti, C. Prestipino and S. Bordiga, J. Phys. Chem. B, 2004, 108, 3573–3583 CrossRef CAS.
- S. Kwon, N. M. Schweitzer, S. Park, P. C. Stair and R. Q. Snurr, J. Catal., 2015, 326, 107–115 CrossRef CAS.
- S. C. Laha and R. Kumar, J. Catal., 2002, 208, 339–344 CrossRef CAS.
- L. Balducci, D. Bianchi, R. Bortolo, R. D'Aloisio, M. Ricci, R. Tassinari and R. Ungarelli, Angew. Chem., 2003, 115, 5087–5090 CrossRef.
- T. Zhang, Y. Zuo, M. Liu, C. Song and X. Guo, ACS Omega, 2016, 1, 1034–1040 CrossRef CAS.
- G. Wu, J. Xiao, L. Zhang, W. Wang, Y. Hong, H. Huang, Y. Jiang, L. Li and C. Wang, RSC Adv., 2016, 6, 101071–101078 RSC.
- G. G. Zeelani, A. Ashrafi, A. Dhakad, G. Gupta and S. L. Pal, International Research Journal of Engineering and Technology, 2016, 3, 331–336 Search PubMed.
- M. Wu, X. Liu, Y. Wang, Y. Guo, Y. Guo and G. Lu, J. Mater. Sci., 2014, 49, 4341–4348 CrossRef CAS.
- B. Wang, M. Lin, B. Zhu, X. Peng, G. Xu and X. Shu, Catal. Commun., 2016, 75, 69–73 CrossRef CAS.
- A. Silvestre-Albero, A. Grau-Atienza, E. Serrano, J. García-Martínez and J. Silvestre-Albero, Catal. Commun., 2014, 44, 35–39 CrossRef CAS.
- P.-Y. Chao, S.-T. Tsai, T.-C. Tsai, J. Mao and X.-W. Guo, Top. Catal., 2009, 52, 185–192 CrossRef CAS.
- T. Liu, P. Hacarlioglu, S. T. Oyama, M.-F. Luo, X.-R. Pan and J.-Q. Lu, J. Catal., 2009, 267, 202–206 CrossRef CAS.
- B. Wang, M. Lin, X. Peng, B. Zhu and X. Shu, RSC Adv., 2016, 6, 44963–44971 RSC.
- S. Du, X. Chen, Q. Sun, N. Wang, M. Jia, V. Valtchev and J. Yu, Chem. Commun., 2016, 52, 3580–3583 RSC.
- Y. Zhou, Y. Jin, M. Wang, W. Zhang, J. Xie, J. Gu, H. Wen, J. Wang and L. Peng, Chemistry, 2015, 21, 15412–15420 CrossRef CAS PubMed.
- T. Tatsumi, K. A. Koyano and Y. Shimizu, Appl. Catal., A, 2000, 200, 125–134 CrossRef CAS.
- M. Capel-Sanchez, Appl. Catal., A, 2003, 246, 69–77 CrossRef CAS.
- C. V. Rode, U. N. Nehete and M. K. Dongare, Catal. Commun., 2003, 4, 365–369 CrossRef CAS.
- L. Xu, J. Ding, Y. Yang and P. Wu, J. Catal., 2014, 309, 1–10 CrossRef CAS.
- T. Tatsumi, Y. Watanabe and K. Koyano, Chem. Commun., 1996, 2281–2282 RSC.
- Y. Kuwahara, K. Nishizawa, T. Nakajima, T. Kamegawa, K. Mori and H. Yamashita, J. Am. Chem. Soc., 2011, 133, 12462–12465 CrossRef CAS PubMed.
- Z. Chen, B. Wang, J. Zhang, W. Yu, Z. Liu and Y. Zhang, Org. Chem. Front., 2015, 2, 1107–1295 RSC.
- B. Venu, B. Vishali, G. Naresh, V. V. Kumar, M. Sudhakar, R. Kishore, J. Beltramini, M. Konarova and A. Venugopal, Catal. Sci. Technol., 2016, 6, 8055–8062 CAS.
- W. Zhang, J. Xie, W. Hou, Y. Liu, Y. Zhou and J. Wang, ACS Appl. Mater. Interfaces, 2016, 8, 23122–23132 CAS.
- T. Yu, R. Yang, S. Xia, G. Li and C. Hu, Catal. Sci. Technol., 2014, 4, 3159 CAS.
- T. Yu, Q. Zhang, S. Xia, G. Li and C. Hu, Catal. Sci. Technol., 2014, 4, 639–647 CAS.
- B. Guo, Q. Zhang, G. Li, J. Yao and C. Hu, Green Chem., 2012, 14, 1880 RSC.
- V. V. Ishtchenko, K. D. Huddersman and R. F. Vitkovskaya, Appl. Catal., A, 2003, 242, 123–137 CrossRef CAS.
- C. Xia, L. Long, B. Zhu, M. Lin and X. Shu, Catal. Commun., 2016, 80, 49–52 CrossRef CAS.
- A. Miyakoshi, A. Ueno and M. Ichikawa, Appl. Catal., A, 2001, 219, 249–258 CrossRef CAS.
- R. Sawyer, H. Nesbitt and R. Secco, J. Non-Cryst. Solids, 2012, 358, 290–302 CrossRef CAS.
- M. C. Capel-Sanchez, J. M. Campos-Martin, J. L. G. Fierro, M. P. de Frutos and A. P. Polo, Chem. Commun., 2000, 855–856, 10.1039/b000929f.
- X. Feng, D. Chen and X. G. Zhou, RSC Adv., 2016, 6, 44050–44056 RSC.
- S. Payra, A. Saha, S. Guchhait and S. Banerjee, RSC Adv., 2016, 6, 33462–33467 RSC.
- M. Tian, W. Liang, G. Rao, L. Zhang and C. Guo, Compos. Sci. Technol., 2005, 65, 1129–1138 CrossRef CAS.
- G. Zou, D. Jing, W. Zhong, F. Zhao, L. Mao, Q. Xu, J. Xiao and D. Yin, RSC Adv., 2016, 6, 3729–3734 RSC.
- M. Camblor, A. Corma and J. Perez-Pariente, J. Chem. Soc., Chem. Commun., 1993, 557–559 RSC.
- X. Feng, X. Duan, H. Cheng, G. Qian, D. Chen, W. Yuan and X. Zhou, J. Catal., 2015, 325, 128–135 CrossRef CAS.
- J. Zhou, Z. Hua, X. Cui, Z. Ye, F. Cui and J. Shi, Chem. Commun., 2010, 46, 4994–4996 RSC.
- F. Yin, A. Blumenfeld, V. Gruver and J. Fripiat, J. Phys. Chem. B, 1997, 101, 1824–1830 CrossRef CAS.
- A. Zecchina, L. Marchese, S. Bordiga, C. Paze and E. Gianotti, J. Phys. Chem. B, 1997, 101, 10128–10135 CrossRef CAS.
- Z. Zhuo, L. Wu, L. Wang, Y. Ding, X. Zhang, Y. Liu and M. He, RSC Adv., 2014, 4, 55685–55688 RSC.
- L. Zhu, B. Guo, D. Tang, X. Hu, G. Li and C. Hu, J. Catal., 2007, 245, 446–455 CrossRef CAS.
- G. Kovács, A. Lledós and G. Ujaque, Angew. Chem., 2011, 123, 11343–11347 CrossRef.
Footnote |
| † Electronic supplementary information (ESI) available. See DOI: 10.1039/c7ra02074k |
| This journal is © The Royal Society of Chemistry 2017 |

