
 Open Access Article
 This Open Access Article is licensed under a Creative Commons Attribution-Non Commercial 3.0 Unported Licence
Metabonomic analysis of metastatic lung tissue in breast cancer mice by an integrated NMR-based metabonomics approach†
Yongxia Yangab,
Jingli Zhangab,
Ying Liub,
Binglin Liab,
Jiangchao Lib,
Lingyun Zhenga and
Lijing Wang *b
*b
aSchool of Basic Course, Guangdong Pharmaceutical University, Guangzhou, 510006, PR China
bVascular Biology Research Institute, Guangdong Pharmaceutical University, Guangzhou, 510006, PR China. E-mail: ljwang2017@163.com; Fax: +86-0-20-3935-2126; Tel: +86-0-20-3935-2126
First published on 26th May 2017
Abstract
Breast cancer metastases have been crucial for treatment and prognosis of breast cancer, therefore, the early diagnosis of metastases is of great significance to improve the patient's survival. The lung is one of the most common metastatic sites of breast cancer. Although there are many techniques used for lung metastasis diagnosis, they have difficulty in detecting lung metastases at an early and resectable stage when metastatic nodules are small or specially located. In this study, we used 1H NMR based metabonomics in conjunction with multivariate analysis to determine the metabolic phenotypes of lung tissues at different metastatic stages, and identify the common potential biomarkers for early metastasis in both MMTV-PyMT and 4T1 breast cancer lung metastasis models. Multivariate analysis results showed that the increased levels in lactate, alanine, glutamate and creatine were the potential biomarkers at early metastatic stage. With the severity of metastasis, the emerging changes of up-regulated GPC/PC and myo-inositol, together with down-regulated valine were metabolic profiles at late metastatic stage. These findings give a metabonomic overview of breast cancer metastatic lung tissues characterized by a series of changed biochemical pathways including energy metabolism (glycolysis and creatine metabolism), amino acids and phospholipids metabolism, demonstrating metabonomics as a useful approach for identifying biomarkers for tumor metastasis.
Introduction
An estimated 1.7 million breast cancer cases and 521![[thin space (1/6-em)]](https://www.rsc.org/images/entities/char_2009.gif) 900 deaths occurred in 2012, approximately 25% of total cancer cases and 15% of all cancer deaths among females worldwide.1 The lung is one of the most common metastatic sites of breast cancer,2 and reports from 50 years of autopsies in breast cancer showed lung or pleura metastases were as high as 80.7%.3 Chest X-rays could make a relatively definite diagnosis on the lung metastatic location and size. However, it easily missed the metastatic nodules with small size and the ones without clear boundaries from the surrounding normal tissues. Low-dose CT scanning has been demonstrated to be a more sensitive tool than chest radiography for the detection of lung metastases, but it has difficulty in detecting lung metastases at early and resectable stage. Therefore, identifying new methods for early diagnosis of breast cancer lung metastases is important to improve the survival rates of patients.
900 deaths occurred in 2012, approximately 25% of total cancer cases and 15% of all cancer deaths among females worldwide.1 The lung is one of the most common metastatic sites of breast cancer,2 and reports from 50 years of autopsies in breast cancer showed lung or pleura metastases were as high as 80.7%.3 Chest X-rays could make a relatively definite diagnosis on the lung metastatic location and size. However, it easily missed the metastatic nodules with small size and the ones without clear boundaries from the surrounding normal tissues. Low-dose CT scanning has been demonstrated to be a more sensitive tool than chest radiography for the detection of lung metastases, but it has difficulty in detecting lung metastases at early and resectable stage. Therefore, identifying new methods for early diagnosis of breast cancer lung metastases is important to improve the survival rates of patients.
Metabolic profiling (metabonomics/metabolomics) is widely used to investigate the metabolic compositions of cells, tissues, and biofluids.4–7 It offers a comprehensive and quantitative method for monitoring the biochemical changes induced by factors of physiology and environment.8,9 NMR-based metabonomics together with multivariate data analysis has been widely applied in many diseases,10,11 and it has been also applied for tumor research in recent years, such as chronic lymphocytic leukaemia12 and pancreatic islet β cell tumor.13
Metabonomics had also been adopted in tumor metastases. A study about serum metabolic profiles of metastatic colorectal cancer patients revealed metabonomics could be applied in survival predicting.14 Sreekumar A. et al. revealed sarcosine as a potential urinary biomarker for differentiating clinically localized prostate cancer from metastatic prostate cancer.15 In metastatic breast cancer, Jobard E. et al. reported that serum histidine, acetoacetate, glycerol, pyruvate, glycoproteins (N-acetyl), mannose, glutamate and phenylalanine were statistically significant metabolites in advanced metastatic breast cancer patients.16 It was also reported that serum metabolomics was useful for assessing micro metastasis in breast cancer patients.17 These researches proved that metabonomics could be an effective method to find early metabolic changes in breast cancer metastases. Thus we applied metabonomics method to study lung metabolic profiles in order to detect the metastatic progression and find the early biomarkers for lung metastases in breast cancer.
MMTV-PyMT mouse is a commonly used breast cancer spontaneous tumor model, which was induced by transfer of polyoma virus middle T oncoprotein into the promoter of the oncogene.18 In this transgenic mouse model, the histopathological progression of breast cancer includes four stages, i.e. hyperplasia (4 weeks), adenoma (7 to 9 weeks), early carcinoma (9 to 12 weeks) and late carcinoma (15 weeks). At 12 weeks, all of the mice presented the micrometastases to the lung,19 which was identified as the early breast cancer metastases. At 15 weeks, the lung metastases became serious and the mice began to die.19 Therefore, MMTV-PyMT mice were used in this study to research the progression of lung metastases in breast cancer. In addition, a highly metastatic 4T1 murine mammary carcinoma cell transplantation model was also established for the further study of lung metastases. When these cells were injected into BALB/c mice, it could develop metastases in lung, liver, and bone.20,21 We can observe early lung metastases at 10 days, and then the lung metastases became serious at about 14 days.
In this study, we presented a 1H NMR-based metabonomics study to reveal the lung metabolic changes in both MMTV-PyMT spontaneous and 4T1-transplanted breast cancer models, in order to search the metabolic phenotypes for characterizing the lung metastatic progression and screening out the early biomarkers for lung metastases.
Materials and methods
Cell culture
4T1 murine mammary carcinoma cell line was obtained from the cell bank of Chinese Academy of Sciences (Shanghai, China). These cells were cultured in high glucose Dulbecco's Modified Eagle's Medium (DMEM, GIBCO), supplemented with 10% fetal bovine serum (FBS) and incubated at 37 °C in a humidified atmosphere containing 5% CO2.Animal studies
MMTV-PyMT mice on the FVB genetic background were obtained from the Jackson Laboratory (Bar. Harbor, Maine). The FVB mice crossed with MMTV-PyMT mice and offspring were genotyped by PCR to identify MMTV-PyMT-positive females at approximately 3 weeks of age. The MMTV-PyMT mice were sacrificed at 9, 12, 15 weeks of age (n = 8 per group), and lung tissues were collected. The background FVB mice were regarded as control group, and were sacrificed at 9 weeks for normal lung tissue.Female BALB/c mice (8–10 weeks old) were purchased from Animal Center of Guangdong province (Guangzhou, China). 4T1 (3 × 10⁵) tumor cells in 200 μL of PBS (phosphate buffer saline, 0.1 M, pH = 7.4) were injected in female BALB/c mice via the tail vein to establish lung metastases model. These mice were assigned to four groups (n = 8 per group), one group served as control group just injected with PBS (0.1 M, pH = 7.4), and other three groups received 4T1 cells via the tail vein. The transplanted mice were sacrificed at 7 days, 10 days and 14 days, respectively, and the lung tissues were collected. The normal lung tissues were removed at 10 days from control group. Animals were maintained in accordance with the guidelines for Ethical Review of Animal Welfare, China, and approved by the institutional ethical committee of Guangdong Pharmaceutical University.
HE staining
A portion of fresh lung tissue was fixed in 10% neutral formalin solution for 18 hours and followed by dehydration for 9 hours. After paraffin embedding, the paraffin sections (4 μm) were stained with hematoxylin & eosin (H&E).Sample preparation
The remaining lung tissue was cut and weighed. Approximately 80 mg of each sample was extracted twice with 1 mL 50% aqueous acetonitrile using porcelain mortars. After centrifugation at 15000 rpm for 10 min, the combined supernatants were then lyophilized immediately, and residues were stored at −80 °C.
Before analysis, the lung tissues extracts were dissolved with 350 μL of D2O containing 0.05% TSP (sodium 3-trimethylsilyl-(2,2,3,3-2H4)-1-propionate) and 200 μL of PBS (0.2 M, pH = 7.4). After vortex for 1 min, these extracts were centrifuged at 15000 rpm for 10 min. The supernatant (500 μL) was then pipetted into 5 mm NMR tubes.
1H NMR spectroscopy
1H NMR spectra of lung extracts were collected at 298 K on a Bruker Avance 500 MHz spectrometer (Bruker Biospec, Erlangen, Germany). 1H spectra were obtained by one-dimensional NOESYPR1D pulse sequence (recycle delay-90°-t1-90°-tm-90°-acquisition). Free induction decays adopted a spectral width of 10 kHz with a mixing time of 100 ms and pulse delay time of 2 s, and they were collected with 64 transients into 32 k data points. The t1 was set to be 3 μs. An exponential function with a line-broadening factor of 0.3 Hz multiplied to all free-induction decays before Fourier transformation.Pattern recognition and statistical analysis
TOPSPIN 2.0 was used to correct the phase and baseline of all the spectra, and chemical shifts of spectra were referenced to the TSP at δ 0.00. Each 1H NMR spectrum was segmented into regions of 0.004 ppm. The region of δ 4.7–5.2 was discarded to eliminate effects of water suppression. The integral of these buckets at δ 0.5–9.0 were normalized to the total sum of the spectral integral.Pattern recognition analysis was performed using the software Simca-P+ 12.0 (Umetrics, Sweden). Principal component analysis (PCA) observed all the NMR spectra data with an unsupervised pattern. Then Orthogonal single collection Partial Least Squares Discriminant Analysis (OPLS-DA) was adopted to establish the group separation for biomarkers screening. The results of pattern recognition analysis were showed by scores and loadings plots, in which groupings pattern and metabolites differences were visually displayed. MATLAB programme colored the variables in loadings plots with the correlation coefficients from OPLS-DA. Statistical analyses were further tested by a simple Student's test (SPSS 19.0).
Results
Histopathological examination in lung
Fig. 1 showed the lung histopathological changes in MMTV-PyMT and 4T1 transplantation models, which revealed the progression of lung metastases. We can see normal lung tissues structure in FVB mice (background mice) and MMTV-PyMT mice at 9 weeks. It was found that micrometastases emerged at about 12 weeks with the allotypic nucleus compared to the morphological features at 9 weeks (Fig. 1A3). At 15 weeks, metastases commonly appeared in features of obvious atypia, in which pulmonary metastases loci were increased and aggravated. Most of the mice began to die at 16 weeks caused by pulmonary metastases, so the mice at 15 weeks were selected as the final pulmonary metastases model. For 4T1 model, it was found the normal lung tissues structure at 7 days. Micrometastases were found just at 10 days, similar with the MMTV-PyMT mice at 12 weeks. Up to 14 days, all mice presented serious metastases. Most mice began to die at 18–20 days because of serious metastases, so the mice at 14 days were selected as the model for late stage of pulmonary metastases.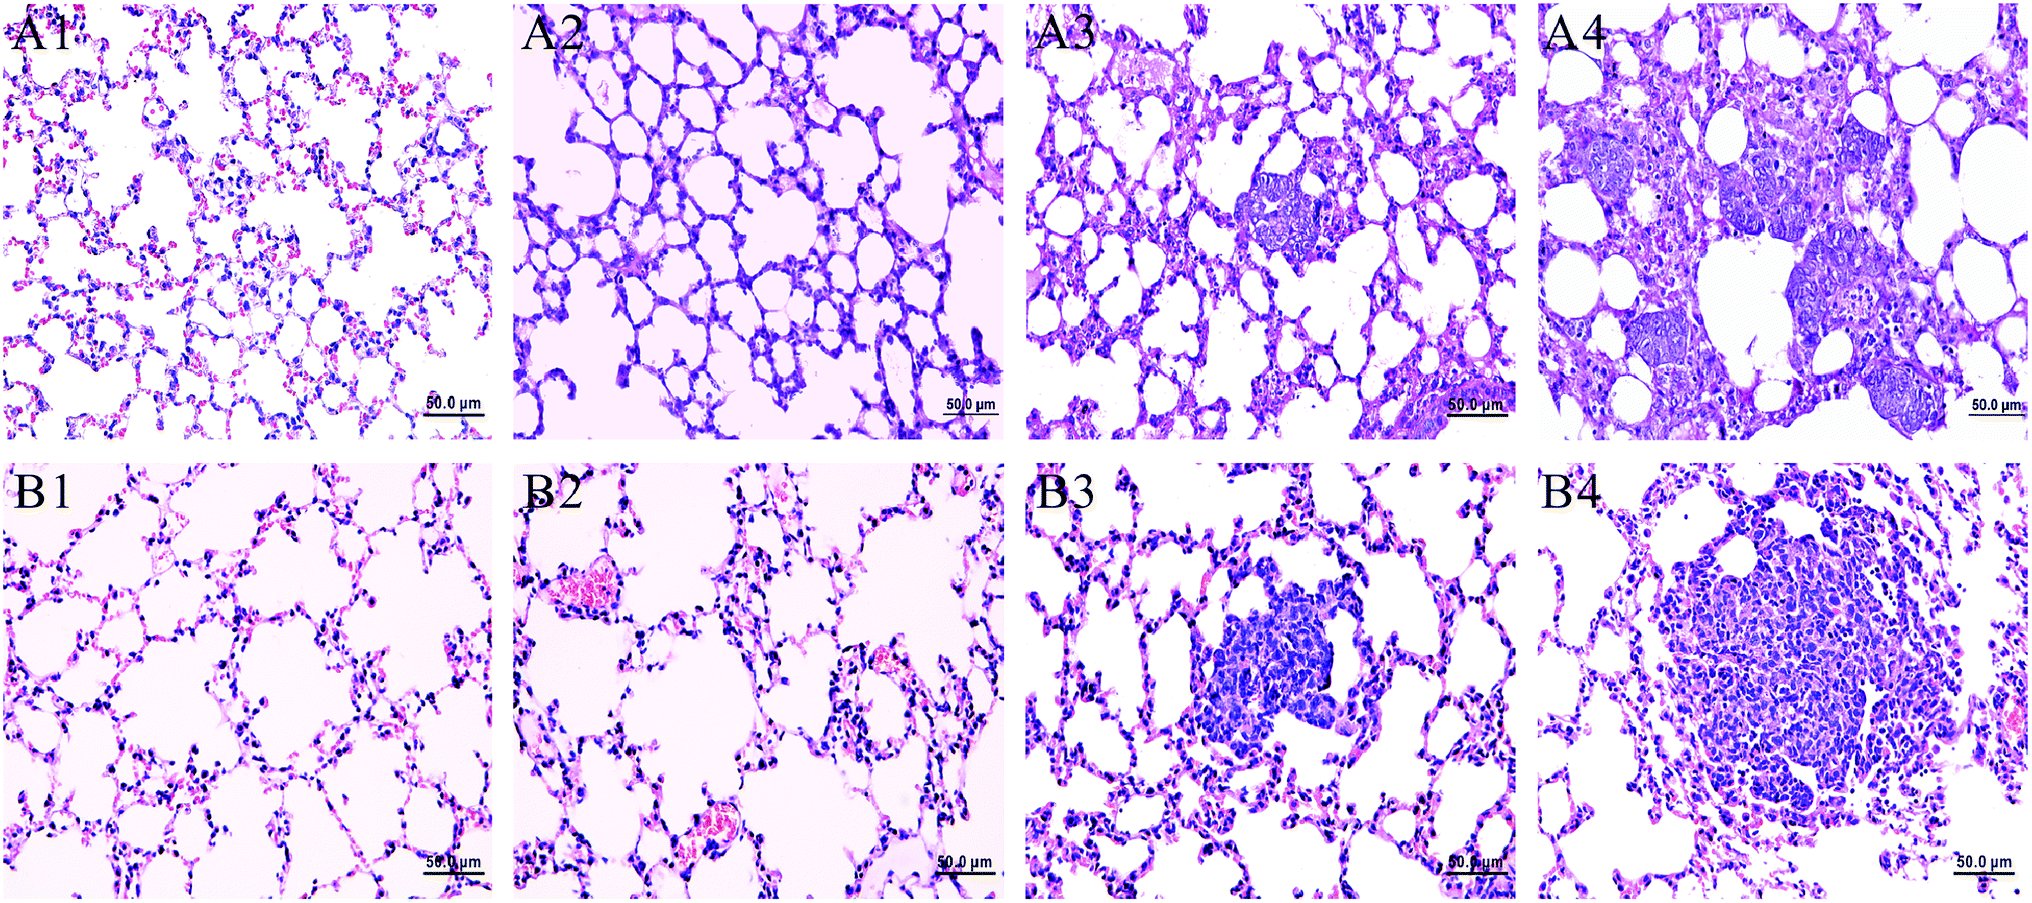 | ||
| Fig. 1 Histological examination of hematoxylin and eosin stained sections of lung tissue in MMTV-PyMT and 4T1 model mice at different stages. ((A1) FVB 9 weeks; (A2–A4) MMTV-PyMT 9, 12, 15 weeks; (B1) controls, (B2–B4) 4T1 model 7, 10, 14 days). | ||
Metabolite profiling of lung
Typical lung tissues 1D 1H NOESY spectra from FVB (9 weeks), MMTV-PyMT (9 weeks, 12 weeks, 15 weeks) mice and 4T1 model (controls, 14 days) mice were shown in Fig. 2, respectively. Metabolites in the 1H NMR spectra were referred to the literatures6,22 and confirmed by 2D spectroscopy. Thus, a series of glucose, amino acids, lipids and metabolic intermediates could be observed. It was obviously found that lactate increased with lung metastatic progression in MMTV-PyMT mice. The increased lactate was also found in the 4T1 model mice at 14 days compared to control group. To obtain meaningful metabolites closely correlated with lung metastases in these two models, all 1H spectra were analyzed through multivariate data analysis.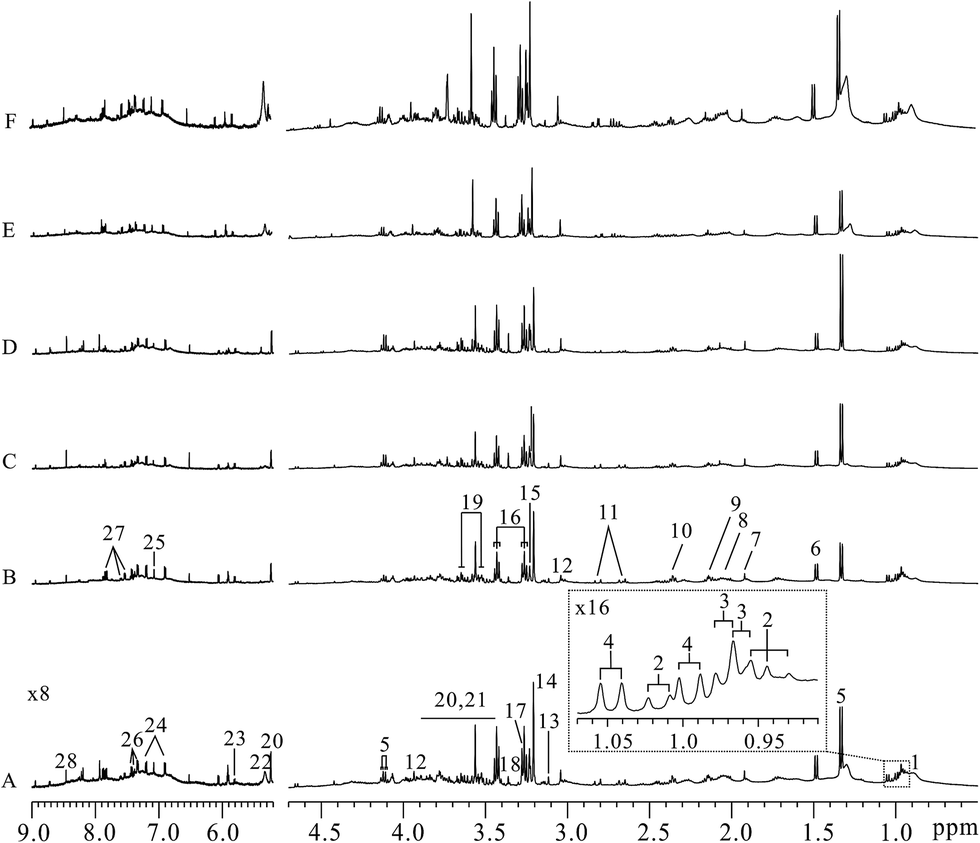 | ||
| Fig. 2 Representative lung tissue 1H NMR spectra of MMTV-PyMT and 4T1 model mice. ((A) FVB 9 weeks; (B–D) MMTV-PyMT 9, 12, 15 weeks; (E) controls, (F) 4T1 model 14 days). Keys: (1) lipid; (2) isoleucine; (3) leucine; (4) valine; (5) lactate; (6) alanine; (7) acetate; (8) N-acetyl-glycoprotein; (9) methionine; (10) glutamate; (11) aspartate; (12) creatine/creatinine; (13) histidine; (14) choline; (15) GPC/PC; (16) taurine; (17) TMAO; (18) proline; (19) myo-inositol; (20) α-glucose; (21) β-glucose; (22) unsaturated lipid; (23) uracil; (24) tyrosine; (25) 1-methylhistidine; (26) phenylalanine; (27) hippurate; (28) formate. | ||
Metabolic variations associated with tumor progression
PCA was firstly performed to classify the lung samples at different stages in MMTV-PyMT and 4T1 models, respectively. Fig. 3A shows the PCA scores plot in MMTV-PyMT mice, presenting the distribution for all the lung samples including FVB mice at 9 weeks and MMTV-PyMT mice at 9 weeks, 12 weeks and 15 weeks. With the pathological progression, the distribution of the samples moved from the left to the right side along the t1 dimension as the arrow denoted, which suggested that the metabolic characteristics changed with the tumor metastases. 4T1 model also showed an obvious distribution among the three groups at 7 days, 10 days and 14 days. The PCA results revealed that the lung metabolic variations in MMTV-PyMT and 4T1 models were closely correlated with the lung metastatic progression.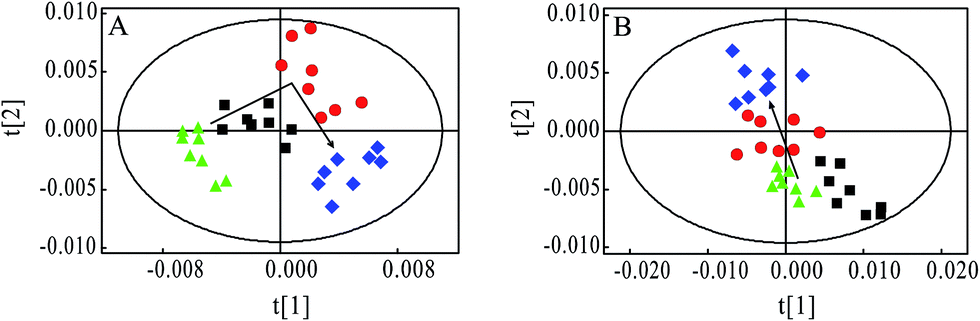 | ||
Fig. 3 Principal component analysis results of lung tissue 1H spectra data in MMTV-PyMT (R2X = 87.2%, Q2 = 51.9%) and 4T1 models (R2X = 96.5%, Q2 = 77.4%) at different histopathological stages. (A) FVB 9 weeks ( ), MMTV-PyMT 9 weeks ( ), MMTV-PyMT 9 weeks ( ), 12 weeks ( ), 12 weeks ( ), 15 weeks ( ), 15 weeks ( ); (B) 4T1 model controls ( ); (B) 4T1 model controls ( ), 4T1 model 7 days ( ), 4T1 model 7 days ( ), 10 days ( ), 10 days ( ), 14 days ( ), 14 days ( ). ). | ||
In this study, OPLS-DA models were established respectively to classify samples at different pathological stages to screen potential biomarkers for lung metastases. Fig. 4A1 shows the obvious classification between samples of MMTV-PyMT mice at 9 weeks and 12 weeks. From the coefficient coded-loadings plot (Fig. 4B1), the levels of lactate, alanine, N-acetyl-glycoprotein, glutamate, creatine, proline and myo-inositol increased, while the valine decreased. The same OPLS-DA strategy was applied to the samples of MMTV-PyMT mice between 9 weeks and 15 weeks (Fig. 4A2). The trends of the metabolic variations were generally consistent with the changes in Fig. 4B1. Additionally, glycerophosphocholine/phosphocholine (GPC/PC) was up-regulated, while glutamate showed no change. It was also found that the levels of lactate and GPC/PC increased, and valine, acetate and glutamate were down-regulated at 15 weeks compared with 12 weeks (Fig. 4B3).
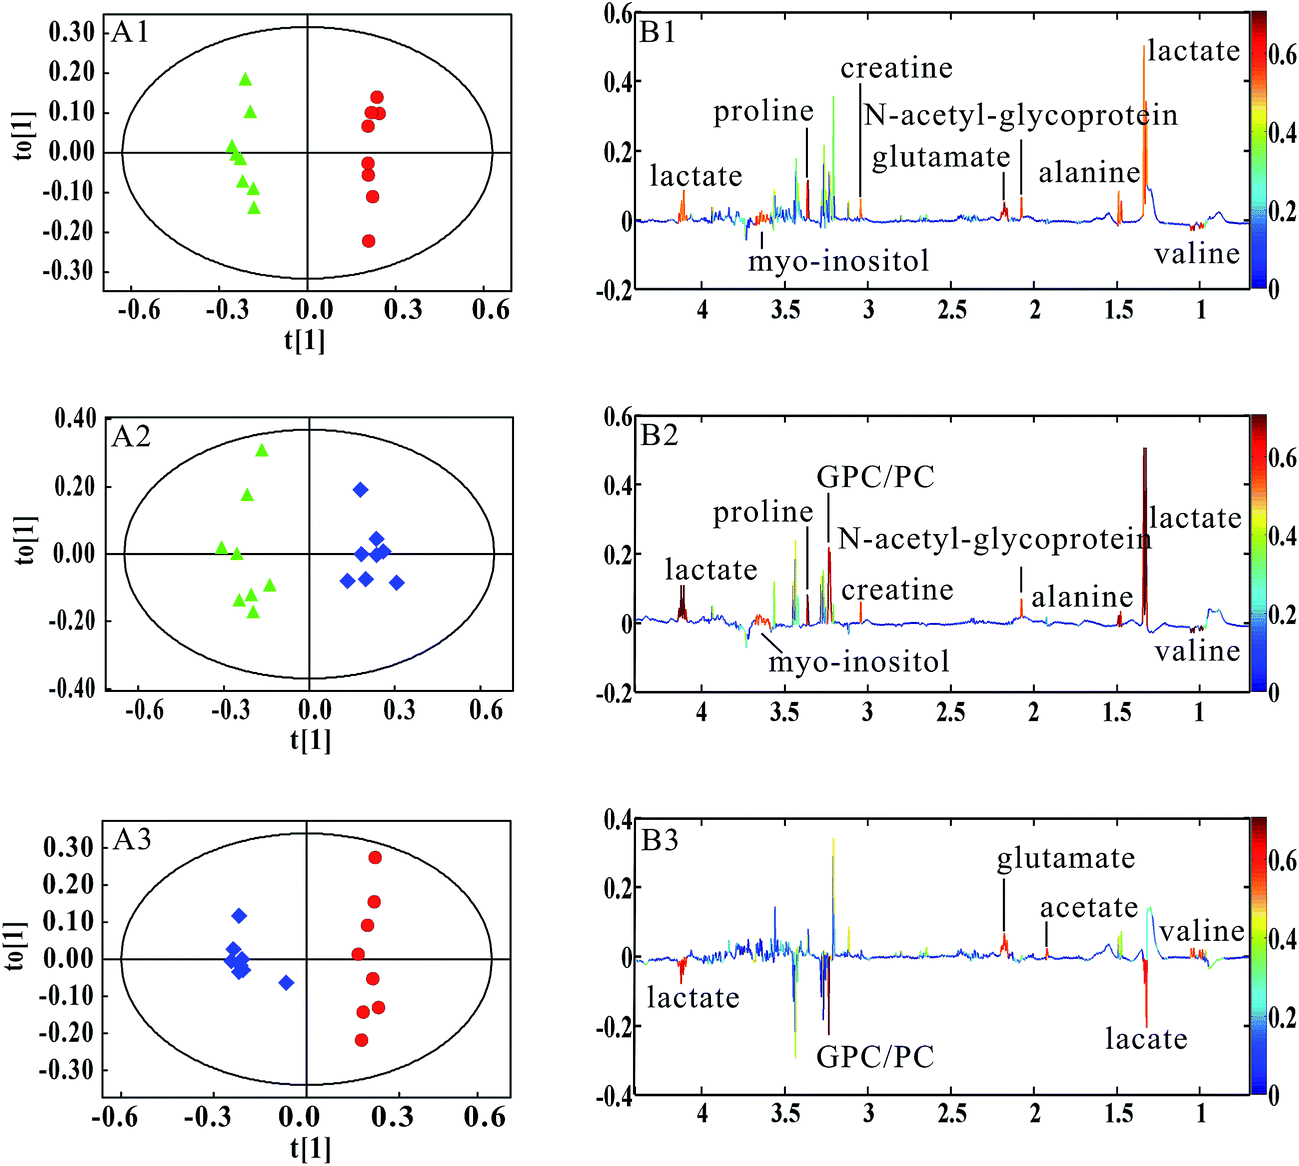 | ||
Fig. 4 OPLS-DA results of lung tissue 1H NMR spectra in MMTV-PyMT mice. MMTV-PyMT 9 weeks ( ), 12 weeks ( ), 12 weeks ( ), 15 weeks ( ), 15 weeks ( ). (A1 and B1) 9 weeks vs. 12 weeks, R2X = 52.8%, Q2Y = 99.2%; (A2 and B2) 9 weeks vs. 15 weeks, R2X = 53.4%, Q2Y = 94.9%; (A3 and B3) 12 weeks vs. 15 weeks, R2X = 58.7%, Q2Y = 96.1%. ). (A1 and B1) 9 weeks vs. 12 weeks, R2X = 52.8%, Q2Y = 99.2%; (A2 and B2) 9 weeks vs. 15 weeks, R2X = 53.4%, Q2Y = 94.9%; (A3 and B3) 12 weeks vs. 15 weeks, R2X = 58.7%, Q2Y = 96.1%. | ||
Table 1 summarized the statistical analysis results of the metabolites screened out in Fig. 4. We could see that the valine, lactate, alanine, N-acetyl-glycoprotein, glutamate, creatine, proline and myo-inositol had statistical significance at 12 weeks, when lung micrometastases occurred. Therefore, these metabolites had potential as early biomarkers for breast cancer lung metastases. With the metastatic progression at 15 weeks, in addition to the continued decrease of valine and increase of lactate, alanine, N-acetyl-glycoprotein, creatine, proline and myo-inositol, the up-regulated GPC/PC had statistical significance.
| Metabolites | δ 1H (ppm) | 12 weeks vs. 9 weeks | 15 weeks vs. 9 weeks | 15 weeks vs. 12 weeks |
|---|---|---|---|---|
| a Note: ↑, the increase; ↓, the decrease; —, no statistical change. *P < 0.05, **p < 0.01, ***p < 0.001. | ||||
| Valine | 0.97, 1.02 | ↓** | ↓*** | ↓* |
| Lactate | 1.33, 4.11 | ↑* | ↑*** | ↑** |
| Alanine | 1.46 | ↑* | ↑** | — |
| Acetate | 1.91 | — | — | ↓* |
| N-Acetyl-glycoprotein | 2.04 | ↑* | ↑* | — |
| Glutamate | 2.14 | ↑** | — | ↓** |
| Creatine | 3.03 | ↑* | ↑* | — |
| GPC/PC | 3.24 | — | ↑** | ↑*** |
| Proline | 3.34 | ↑** | ↑*** | — |
| myo-Inositol | 3.56, 3.64 | ↑* | ↑* | — |
Furthermore, to verify the significance for lung metastases of above-mentioned metabolites in MMTV-PyMT mice, we performed the multivariate analysis in 4T1 model. According to the histopathological changes in lung tissues (Fig. 1), the pathological processes of 4T1 model were in accordance with the MMTV-PyMT mice. Fig. 5 showed the clear classification between the 4T1 model samples at 7 days and 10 days (Fig. 5A1), 7 days and 14 days (Fig. 5A2), 10 days and 14 days (Fig. 5A3), respectively. It was found that lactate, alanine, glutamate and creatine were up-regulated at 10 days, same as the changes in MMTV-PyMT mice (Fig. 4B1). Fig. 5B2 presented the variation tendency of valine, lactate, alanine, creatine, GPC/PC and myo-inositol at 14 days, which were consistent with those changes at 15 weeks in MMTV-PyMT mice, except for the decreased aspartate and increased taurine. In Fig. 5B3, the metabolites of valine, lactate, acetate, glutamate and GPC/PC have similar changes with those in MMTV-PyMT mice (Fig. 4B3). Creatine, taurine and myo-inositol were of high levels and aspartate was decreased at 14 days in comparison with 10 days.
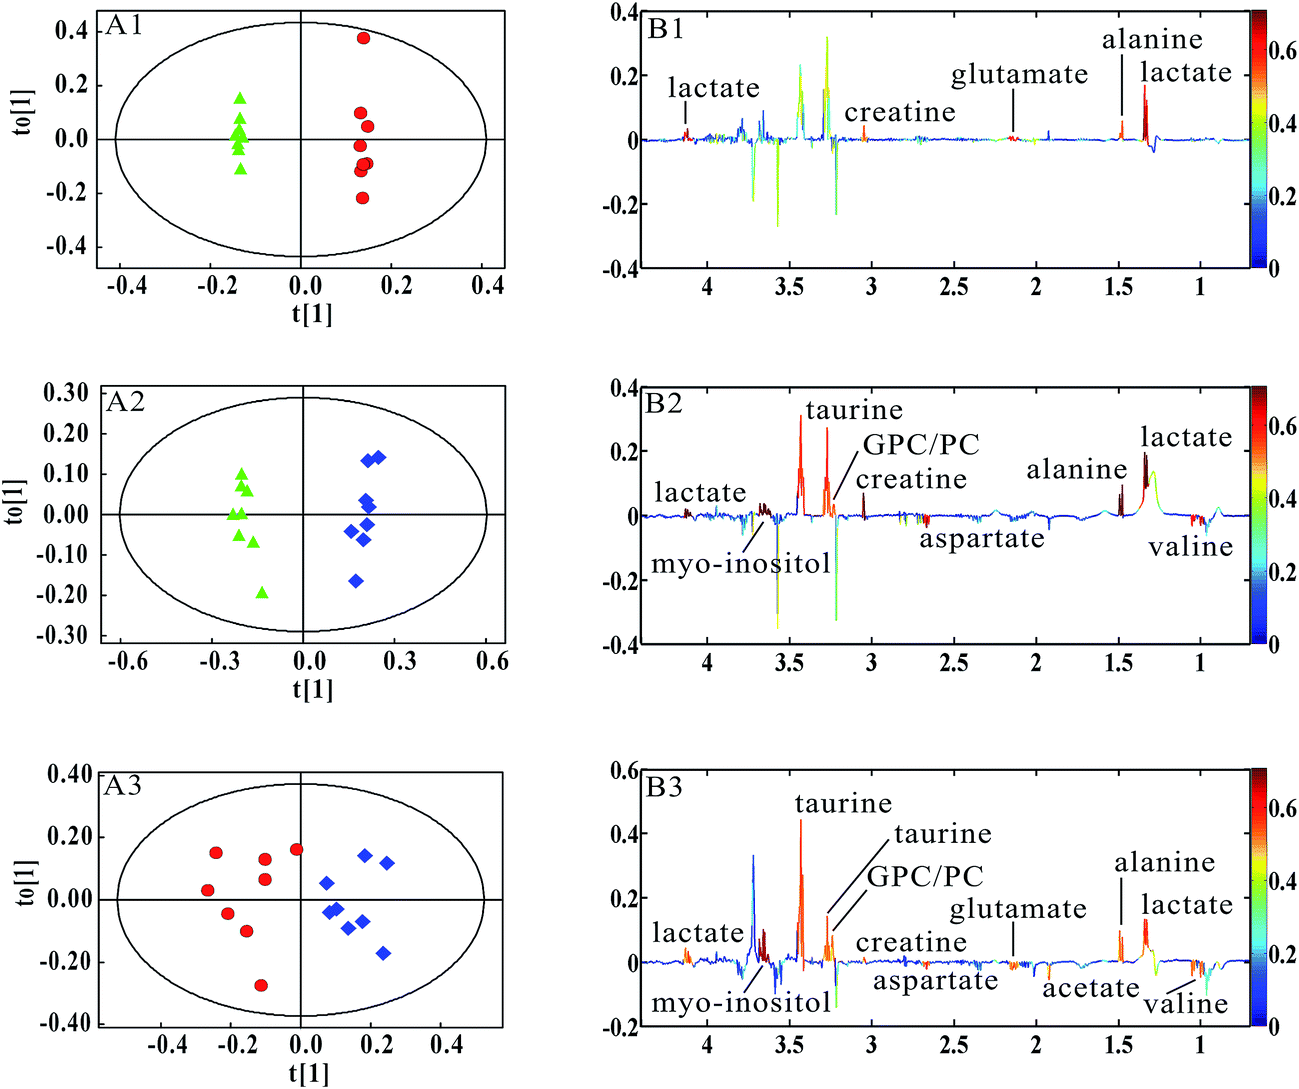 | ||
Fig. 5 OPLS-DA results of lung tissue 1H NMR spectra in 4T1 model mice. (4T1 model 7 days ( ), 4T1 model 10 days ( ), 4T1 model 10 days ( ), 4T1 model 14 days ( ), 4T1 model 14 days ( )) (A1 and B1) 7 days vs. 10 days, R2X = 83.0%, Q2Y = 99.9%; (A2 and B2) 7 days vs. 14 days, R2X = 45.5%, Q2Y = 98.3%; (A3 and B3) 10 days vs. 14 days, R2X = 48.3%, Q2Y = 81.5%. )) (A1 and B1) 7 days vs. 10 days, R2X = 83.0%, Q2Y = 99.9%; (A2 and B2) 7 days vs. 14 days, R2X = 45.5%, Q2Y = 98.3%; (A3 and B3) 10 days vs. 14 days, R2X = 48.3%, Q2Y = 81.5%. | ||
Table 2 gives statistical analysis results of metabolites screened out from Fig. 5. When micrometastases occurred in MMTV-PyMT mice (12 weeks) and 4T1 model (10 days), the common metabolites with statistical changes were lactate, alanine, glutamate and creatine, which possibly were potential biomarkers for early lung metastases of breast cancer. It was also found that the increased GPC/PC and myo-inositol, and decrease of valine were closely correlated with the serious metastases.
| Metabolites | δ 1H (ppm) | 10 d vs. 7 d | 14 d vs. 7 d | 14 d vs. 10 d |
|---|---|---|---|---|
| a Note: ↑, the increase; ↓, the decrease; —, no statistical change. *P < 0.05, **p < 0.01, ***p < 0.001. | ||||
| Valine | 0.97, 1.02 | — | ↓** | ↓* |
| Lactate | 1.33, 4.11 | ↑** | ↑*** | ↑* |
| Alanine | 1.46 | ↑* | ↑*** | ↑* |
| Acetate | 1.91 | — | — | ↓* |
| Glutamate | 2.14 | ↑** | — | ↓* |
| Aspartate | 2.68 | — | ↓** | ↓* |
| Creatine | 3.03 | ↑* | ↑*** | ↑* |
| GPC/PC | 3.22 | — | ↑* | ↑* |
| Taurine | 3.25, 3.41 | — | ↑* | ↑* |
| myo-Inositol | 3.56, 3.64 | — | ↑*** | ↑*** |
Discussion
Breast cancer metastases were challenge in treatment and prognosis of breast cancer; therefore, searching early biomarkers of breast cancer metastases was of great significance to improve the patient's survival. In this study, we explore the association between lung metastases progression and metabonomic profiles in lung tissue of both MMTV-PyMT and 4T1 models, in order to find the biochemical markers for the early diagnosis of breast cancer lung metastases.From the histopathological characteristics showed in Fig. 1, we could find the noticeable development of lung metastases from early to serious metastases. Fig. 3 demonstrated the metabolites' progression trajectory of lung tissues in MMTV-PyMT mice and 4T1 model mice respectively, which revealed that the lung tissues metabolites' changes were closely correlated with the lung metastases stages. At early lung metastasis stage, it was found that lactate, alanine, N-acetyl-glycoprotein, glutamate, creatine, proline, and myo-inositol increased, while valine was down-regulated in the lung tissues in MMTV-PyMT mice at 12 weeks. With the progress of lung metastases, additionally increased GPC/PC was found at 15 weeks, while glutamate showed no difference. In 4T1 model mice, the levels in lactate, alanine, glutamate and creatine were up-regulated at 10 days. Moreover, a series of new metabolites changes appeared at 14 days, including valine, aspartate, GPC/PC, taurine and myo-inositol. Therefore, it was concluded from the two breast cancer lung metastases models that the increased lactate, alanine, glutamate and creatine could be the common biomarkers for early lung metastases, while the increased GPC/PC and myo-inositol, and the decreased valine were correlated with the severity of lung metastases. These metabolites were involved in the energy metabolism (glycolysis and creatine metabolism), amino acids and phospholipids metabolism. A general metabolic pathway was drawn according to these changed metabolites (Fig. 6).
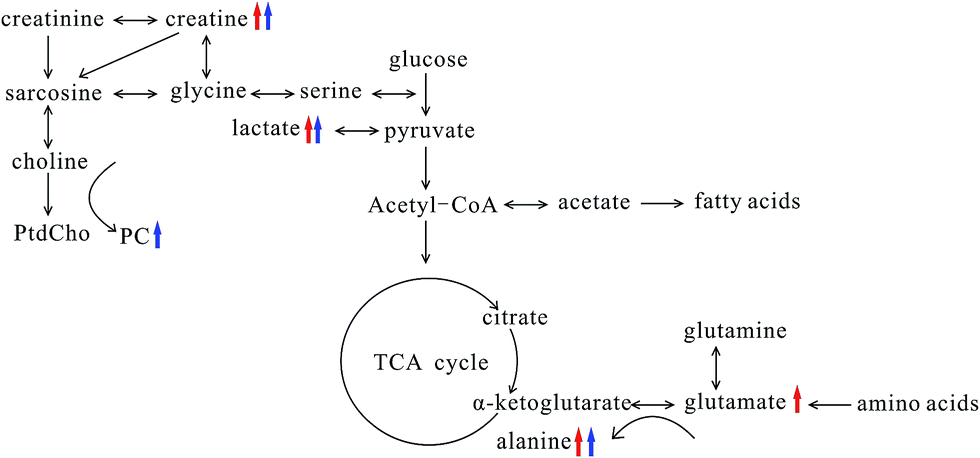 | ||
| Fig. 6 Summary of the biochemical pathway changes in metastatic lung tissue during the pathological progression of MMTV-PyMT and 4T1 model mice. Red arrows represent the common changes in both models at early metastasis stage; blue represents the common changes in both models at serious metastasis stage. | ||
Tumor progression needs great energy consumption, which was closely related to glucose metabolism. The elevated lactate involved in glycolysis was observed in MMTV-PyMT and 4T1 model mice at early metastases stage, which revealed the activated Warburg effect23 in lung tissues when metastases appeared. Meanwhile, the level of lactate increased with the lung metastatic progress, which indicated the time-dependent activation of anaerobic glycolysis, providing more energy to meet the energy requirement of the tumor growth. The elevated lactate was also found in estrogen receptor negative breast cancer24 and gastric cancer metastasis,25 showing the change of lactate had a close connection with the progression of tumor and metastases. The level of glucose showed decrease at the early stage of metastasis, and it also presented the tendency of reducing with the increase of lung metastasis. However, the decrease of glucose didn't have statistical significance, possibly caused by the interference of other signals when integration at δ 3.4–3.9 and the individual difference among the samples. We would increase the number of mice to further evaluate the change of glucose in order to elucidate the glucose metabolism. Acetate was down-regulated in both models at serious metastases stage comparing to early metastases stage. It is possibly correlated with the switch from acetate to ATP for supporting fatty acid and lipid biosynthesis under tumor-like tissue culture conditions.26 This result was also found in adenocarcinoma.27 Creatine was observably increased in both tumor types at the early and serious metastases stages, which was correlated with the altered energy transfer processes,28,29 and it had been found to increase in adenocarcinoma (AdC) and squamous cell carcinoma (SqCC) lung tumors.27 Additionally, the up-regulated creatine may reflect decreased activity of creatine kinase (CK), which catalyses the reversible transphosphorylation reaction between ATP and creatine.30,31
The changed amino acids have been observed during the tumor proliferation. Glutamate and alanine were increased significantly at early metastases stage. Glutamate, produced from hydrolysis of glutamine by glutaminase, has been considered to be an important source of energy and medium for tumor cell growth.32,33 The increase of glutamate at early metastases stage in both models possibly implies an increased activity of the glutaminase. Many studies have found high level of glutamate in various types of cancer.34,35 However, it was noted that an obvious decrease in glutamate at serious metastases stage was found. Wang J. et al. found the level of glutamine was elevated in early primary hepatocellular carcinoma stage and decreased in the late metastatic stage.36 Combined with this study, we can suppose that the glutamine and glutamate metabolism has different metabolic patterns at early and severe metastatic stages. The transamination of glutamate is catalyzed by alanine transaminase and produces alanine and α-ketoglutarate, and then α-ketoglutarate enters the tricarboxylic acid cycle for energy generation.27 Therefore, the increased alanine possibly suggested the activated transamination, which was also found in prostate cancer and head and neck cancer.37,38
Valine, one of the branched-chain amino acids, was down-regulated in both models at serious lung metastatic stage. In human lung cancer, valine is also significantly decreased,39 which may be a result from disordered activity of a series of synthases during the tumor growth. Aspartate was one of the most important intermediates in glutamine oxidation, and its decrease in 4T1 model mice at 14 days may also imply the energy metabolism change.40 A study proved aspartate metabolism is significantly enriched in hepatocellular carcinoma compared to non-tumor tissue.41 However, Chen et al. showed aspartate had a significant elevation in lung cancer tissues,39 which is contrary to our results. The reason may come from the different cancer types and developing stage. The elevation of proline in MMTV-PyMT mice presumably correlated with the degradation of collagen. And it was also reported that the significant increase of proline is highly correlated with cancer metastases, such as gastric cancer metastasis.25
Taurine and myo-inositol increased at serious metastasis stage, which was also reported in adenocarcinoma compared to squamous cell carcinoma.27 Taurine and myo-inositol were known to play a role in cellular osmoprotection, so the increase of myo-inositol and taurine possibly suggests a disorder in the regulation of osmotic pressure. Additionally, elevated taurine could be a result of an endogenous defense mechanism against tumor proliferation.28 N-Acetyl glycoproteins are acute-phase glycoproteins, increasing in MMTV-PyMT mice at 12 weeks, and it was considered to be important in prognosis of patients with tissue damage42. It was found that the increased PC and GPC were correlated with the severity of lung metastasis. PC is produced from anabolic and catabolic transformations of phosphatidylcholine (PtdCho), the major cell membrane phospholipid, while GPC is a product of PtdCho degradation.27 The increases of PC and GPC reflected the disorders phospholipid metabolism, which was also found in adenocarcinoma.27
Conclusion
In summary, we applied the NMR-based metabonomics to identify metabolic patterns for characterizing the lung metastatic progression of breast cancer and search the biomarkers for early lung metastases in MMTV-PyMT and 4T1 models. It was found that lactate, alanine, glutamate and creatine were potential biomarkers of early lung metastasis. With the severity of metastases, the down-regulated valine, and up-regulated GPC/PC and myo-inositol could be correlated with the late metastatic stage. All the changed metabolites are correlated with energy metabolism (glycolysis and creatine metabolism), amino acids and phospholipids metabolism.Conflict of interest
The authors declare that there are no conflicts of interest.Acknowledgements
We acknowledge the financial supports from the Science and Technology Planning Projects of Guangdong Province (no. 2014B020212012, 2015A020211033, 2016A030303062) and the National Natural Science Foundation of China (31471290).References
- L. A. Torre, F. Bray, R. L. Siegel, J. Ferlay, J. Lortet-Tieulent and A. Jemal, Ca-Cancer J. Clin., 2015, 65, 87–108 CrossRef PubMed.
- E. A. Diaz-Canton, V. Valero, Z. Rahman, E. Rodriguez-Monge, D. Frye, T. Smith, A. U. Buzdar and G. N. Hortobagyi, Ann. Oncol., 1998, 9, 413–418 CrossRef CAS PubMed.
- M. C. Cummings, P. T. Simpson, L. E. Reid, J. Jayanthan, J. Skerman, S. Song, A. E. McCartReed, J. R. Kutasovic, A. L. Morey, L. Marquart, P. O'Rourke and S. R. Lakhani, J. Pathol., 2014, 232, 23–31 CrossRef CAS PubMed.
- O. Beckonert, H. C. Keun, T. M. Ebbels, J. Bundy, E. Holmes, J. C. Lindon and J. K. Nicholson, Nat. Protoc., 2007, 2, 2692–2703 CrossRef CAS PubMed.
- F. F. Brown, I. D. Campbell, P. W. Kuchel and D. C. Rabenstein, FEBS Lett., 1977, 82, 12–16 CrossRef CAS PubMed.
- J. K. Nicholson, P. J. Foxall, M. Spraul, R. D. Farrant and J. C. Lindon, Anal. Chem., 1995, 67, 793–811 CrossRef CAS PubMed.
- J. K. Nicholson and I. D. Wilson, Prog. Nucl. Magn. Reson. Spectrosc., 1989, 21, 449–501 CrossRef CAS.
- J. K. Nicholson, J. C. Lindon and E. Holmes, Xenobiotica, 1999, 29, 1181–1189 CrossRef CAS PubMed.
- L. Tenori, C. Oakman, W. M. Claudino, P. Bernini, S. Cappadona, S. Nepi, L. Biganzoli, M. C. Arbushites, C. Luchinat, I. Bertini and A. Di Leo, Mol. Oncol., 2012, 6, 437–444 CrossRef CAS PubMed.
- J. Trygg, E. Holmes and T. Lundstedt, J. Proteome Res., 2007, 6, 469–479 CrossRef CAS PubMed.
- J. K. Nicholson and J. C. Lindon, Nature, 2008, 455, 1054–1056 CrossRef CAS PubMed.
- D. A. MacIntyre, B. Jiménez, E. J. Lewintre, C. R. Martin, H. Schäfer, C. G. Ballesteros, J. R. Mayans, M. Spraul, J. Garcia-Conde and A. Pineda-Lucena, Leukemia, 2010, 24, 788–797 CrossRef CAS PubMed.
- Y. Yang, Y. Liu, L. Zheng, Q. Zhang, Q. Gu, L. Wang and L. Wang, Int. J. Biol. Sci., 2015, 11, 595–603 CrossRef CAS PubMed.
- I. Bertini, S. Cacciatore, B. V. Jensen, J. V. Schou, J. S. Johansen, M. Kruhøffer, C. Luchinat, D. L. Nielsen and P. Turano, Cancer Res., 2012, 72, 356–364 CrossRef CAS PubMed.
- A. Sreekumar, L. M. Poisson, T. M. Rajendiran, A. P. Khan, Q. Cao, J. Yu, B. Laxman, R. Mehra, R. J. Lonigro, Y. Li, M. K. Nyati, A. Ahsan, S. Kalyana-Sundaram, B. Han, X. Cao, J. Byun, G. S. Omenn, D. Ghosh, S. Pennathur, D. C. Alexander, A. Berger, J. R. Shuster, J. T. Wei, S. Varambally, C. Beecher and A. M. Chinnaiyan, Nature, 2009, 457, 910–914 CrossRef CAS PubMed.
- E. Jobard, C. Pontoizeau, B. J. Blaise, T. Bachelot, B. Elena-Herrmann and O. Trédan, Cancer Lett., 2014, 343, 33–41 CrossRef CAS PubMed.
- C. Oakman, L. Tenori, W. M. Claudino, S. Cappadona, S. Nepi, A. Battaglia, P. Bernini, E. Zafarana, E. Saccenti, M. Fornier, P. G. Morris, L. Biganzoli, C. Luchinat, I. Bertini and A. Di Leo, Ann. Oncol., 2011, 22, 1295–1301 CrossRef CAS PubMed.
- B. Grum-Schwensen, J. Klingelhöfer, M. Grigorian, K. Almholt, B. S. Nielsen, E. Lukanidin and N. Ambartsumian, Cancer Res., 2010, 70, 936–947 CrossRef CAS PubMed.
- J. She, C. Qi, Y. Yang, M. Zhang, F. Tang, X. Wu, X. Zhang, J. Wang and L. Wang, J. Guangdong Pharm. Coll., 2011, 27, 178–182 CAS.
- T. Yoneda, T. Michigami, B. Yi, P. J. Williams, M. Niewolna and T. Hiraga, Cancer, 2000, 88, 2979–2988 CrossRef CAS PubMed.
- B. L. Eckhardt, B. S. Parker, R. K. van Laar, C. M. Restall, A. L. Natoli, M. D. Tavaria, K. L. Stanley, E. K. Sloan, J. M. Moseley and R. L. Anderson, Mol. Cancer Res., 2005, 3, 1–13 CAS.
- D. Li, L. Zhang, F. Dong, Y. Liu, N. Li, H. Li, H. Lei, F. Hao, Y. Wang, Y. Zhu and H. Tang, J. Proteome Res., 2015, 14, 2237–2254 CrossRef CAS PubMed.
- R. A. Gatenby and R. J. Gillies, Nat. Rev. Cancer, 2004, 4, 891–899 CrossRef CAS PubMed.
- X. Tang, C. C. Lin, I. Spasojevic, E. S. Iversen, J. T. Chi and J. R. Marks, Breast Cancer Res., 2014, 16, 415 CrossRef PubMed.
- J. L. Chen, H. Q. Tang, J. D. Hu, J. Fan, J. Hong and J. Z. Gu, World J. Gastroenterol., 2010, 16, 5874–5880 CrossRef CAS PubMed.
- Z. T. Schug, B. Peck, D. T. Jones, Q. Zhang, S. Grosskurth, I. S. Alam, L. M. Goodwin, E. Smethurst, S. Mason, K. Blyth, L. McGarry, D. James, E. Shanks, G. Kalna, R. E. Saunders, M. Jiang, M. Howell, F. Lassailly, M. Z. Thin, B. Spencer-Dene, G. Stamp, N. J. van den Broek, G. Mackay, V. Bulusu, J. J. Kamphorst, S. Tardito, D. Strachan, A. L. Harris, E. O. Aboagye, S. E. Critchlow, M. J. Wakelam, A. Schulze and E. Gottlieb, Cancer Cell, 2015, 27, 57–71 CrossRef CAS PubMed.
- C. M. Rocha, A. S. Barros, B. J. Goodfellow, I. M. Careira, A. Gomes, V. Sousa, J. Bernardo, L. Carvalho, A. M. Gil and I. F. Duarte, Carcinogenesis, 2015, 36, 68–75 CrossRef CAS PubMed.
- B. S. Somashekar, P. Kamarajan, T. Danciu, Y. L. Kapila, A. M. Chinnaiyan, T. M. Rajendiran and A. Ramamoorthy, J. Proteome Res., 2011, 10, 5232–5241 CrossRef CAS PubMed.
- Y. Yang, L. Wang, S. Wang, S. Liang, A. Chen, H. Tang, L. Chen and F. Deng, Anal. Bioanal. Chem., 2013, 405, 3381–3389 CrossRef CAS PubMed.
- J. Joseph, A. Cardesa and J. Carreras, Br. J. Cancer, 1997, 76, 600–605 CrossRef CAS PubMed.
- S. P. Bessman and C. L. Carpenter, Annu. Rev. Biochem., 1985, 54, 831–862 CrossRef CAS PubMed.
- D. R. Wise, R. J. DeBerardinis, A. Mancuso, N. Sayed, X. Y. Zhang, H. K. Pfeiffer, I. Nissim, E. Daikhin, M. Yudkoff, S. B. McMahon and C. B. Thompson, Proc. Natl. Acad. Sci. U. S. A., 2008, 105, 18782–18787 CrossRef CAS PubMed.
- A. Mohamed, X. Deng, F. R. Khuri and T. K. Owonikoko, Clin. Lung Cancer, 2014, 15, 7–15 CrossRef CAS PubMed.
- J. Budczies, C. Denkert, B. M. Müller, S. F. Brockmöller, F. Klauschen, B. Györffy, M. Dietel, C. Richter-Ehrenstein, U. Marten, R. M. Salek, J. L. Griffin, M. Hilvo, M. Orešič, G. Wohlgemuth and O. Fiehn, BMC Genomics, 2012, 13, 334 CrossRef CAS PubMed.
- T. W. Fan, A. N. Lane, R. M. Higashi, M. A. Farag, H. Gao, M. Bousamra and D. M. Miller, Mol. Cancer, 2009, 8, 41 CrossRef PubMed.
- J. Wang, S. Zhang, Z. Li, J. Yang, C. Huang, R. Liang, Z. Liu and R. Zhou, Tumor Biol., 2011, 32, 223–231 CrossRef PubMed.
- R. Thapar and M. A. Titus, Curr. Metabolomics, 2014, 2, 53–69 CrossRef CAS PubMed.
- K. Yonezawa, S. Nishiumi, J. Kitamoto-Matsuda, T. Fujita, K. Morimoto, D. Yamashita, M. Saito, N. Otsuki, Y. Irino, M. Shinohara, M. Yoshida and K. Nibu, Cancer Genomics Proteomics, 2013, 10, 233–238 CAS.
- W. Chen, Y. Zu, Q. Huang, F. Chen, G. Wang, W. Lan, C. Bai, S. Lu, Y. Yue and F. Deng, Magn. Reson. Med., 2011, 66, 1531–1540 CrossRef PubMed.
- Z. Kovacević, J. Popović, O. Brkljac and S. Lelas, Biochem. J., 1987, 247, 47–51 CrossRef.
- M. M. Darpolor, S. S. Basu, A. Worth, D. S. Nelson, R. H. Clarke-Katzenberg, J. D. Glickson, D. E. Kaplan and I. A. Blair, NMR Biomed., 2014, 27, 381–389 CrossRef CAS PubMed.
- J. D. Bell, J. C. Brown, J. K. Nicholson and P. J. Sadler, FEBS Lett., 1987, 215, 311–315 CrossRef CAS PubMed.
Footnote |
| † Electronic supplementary information (ESI) available. See DOI: 10.1039/c7ra02069d |
| This journal is © The Royal Society of Chemistry 2017 |