 Open Access Article
Creative Commons Attribution 3.0 Unported Licence
Improved porosity and ionic sorption capacity of carbon particles prepared by spray pyrolysis from an aqueous sucrose/NaHCO3/TEOS solution†
Byeong Ho Min and
Kyeong Youl Jung *
*
Department of Chemical Engineering, Kongju National University, 1223-4 Cheonan-Daero, Seobuk-gu, Cheonan, Chungnam 331-717, Republic of Korea. E-mail: kyjung@kongju.ac.kr; Fax: +82-41-554-2640; Tel: +82-41-521-9365
First published on 18th April 2017
Abstract
Porous carbon spheres were synthesized by spray pyrolysis from an aqueous solution containing sucrose and sodium bicarbonate. Tetraethyl orthosilicate (TEOS) was tested as a porogen agent, and the microstructure and the porosity of carbon particles were investigated with changing TEOS content. According to the TEM and element mapping analysis, Si elements are uniformly distributed throughout the carbon matrix, and most of them are easily removed by ultrasonic washing with purified water. As a result, the surface area was increased by introducing TEOS into the spray solution. In particular, the external surface area of carbon can be largely increased by using TEOS, about 2.4 times larger than that of carbon produced without TEOS. The microstructure of carbon spheres was also influenced by the use of TEOS, which was discussed based on TEM, element mapping and XRD analysis. According to the evaluation of the electrochemical properties, the carbon prepared using TEOS exhibited enhanced specific capacitance, mainly due to an increase of the external surface area. The ion-sorption capacitance or the ion diffusion coefficient of carbon prepared by changing the TEOS content was found to have a linear relationship with the external surface area. These results demonstrate experimentally that adding TEOS to the precursor solution in the spray pyrolysis is a simple and effective way of producing highly mesoporous carbon spheres with improved electrochemical properties.
1. Introduction
Carbon materials such as activated carbon (AC),1,2 carbon aerogels,3,4 carbon nanotubes (CNTs),5–7 mesoporous carbon8,9 and graphene10–12 have been studied widely as important base materials in many applications due to their excellent electrical and physical properties. Porous carbon materials (PCMs) have gained much attention in the research areas of energy storage devices,13–15 catalysts,16–18 and adsorptive separation19–22 due to their unique properties including excellent electrical conductivity, large specific surface area and chemical stability. The required properties of PCMs are different depending on their application area. Thus, a lot of efforts have been dedicated to developing a new synthetic method of PCMs to meet the requirements in application areas.Mesoporous carbons have been prepared by various methods such as sol–gel,23 hydrothermal synthesis,24 template-based carbonization,25–27 chemical/physical activation,28–30 and spray pyrolysis.31–37 Among those, the spray pyrolysis is considered as a potential technique for the preparation of porous carbon because it has several advantages including continuous operation, one-step synthesis in a short time less than several seconds, spherical morphology and relatively narrow particle size distribution. When carbons are prepared by the spray pyrolysis, the microstructure and porosity can be easily controlled by the selection of the carbon source or by changing the additive and its concentration. The carbon sources frequently used in the spray pyrolysis are sucrose,36–38 phenolic resin,34,39 alkali benzoates32 and alkali propiolates (HC![[triple bond, length as m-dash]](https://www.rsc.org/images/entities/char_e002.gif) CCO2M, M = Li, Na and K).31,33 Also, surfactants or colloidal particles can be used as an additive to control the pore size.40,41 A general overview for the synthesis of carbon materials via spray pyrolysis was highlighted in the ref. 42.
CCO2M, M = Li, Na and K).31,33 Also, surfactants or colloidal particles can be used as an additive to control the pore size.40,41 A general overview for the synthesis of carbon materials via spray pyrolysis was highlighted in the ref. 42.
PCMs with high porosity and controlled-microstructure can be produced by the carbonization of RF resin and block copolymers or the decomposition of alkali carboxylates, but these precursors are too expensive, considering the practical application of PCMs prepared by the spray pyrolysis. Carbonization using hard templates including colloidal silica, mesoporous silica and zeolite makes it possible to yield PCMs with well-defined pores and high surface area. Hampsey et al. introduced a spray-pyrolysis approach for the synthesis of hierarchical porous carbons particles using sucrose as a carbon source and silicate templates.41 When the similar hard-templating method is carried out in the spray pyrolysis to prepare PCMs, the additional etching process using excess HF, KOH or NaOH is needed to remove the template. Then, the synthetic process becomes expensive and inefficient. Thus, the development of a novel and relatively inexpensive synthetic method is a challenging work when PCMs are prepared by the spray pyrolysis.
Fortunato et al. reported a facile synthesis of PCM using ultrasonic spray pyrolysis without a sacrificial template.38 They used sucrose as the carbon source and sodium bicarbonate (or sodium carbonate) as a base catalyst for the decomposition of sucrose. The sodium bicarbonate also plays a role as porogens since the gaseous products from the decomposition can create high porosity. In addition, the salts nanoparticles produced in carbon matrix can be easily removed by a simple washing using water. The porosity and microstructure of spherical carbon particles were reported to be easily controlled by changing the concentration or the kinds of the base catalyst.38 Given this, the use of sucrose and sodium bicarbonate in spray pyrolysis for the preparation of PCMs is a good approach, but the resulting carbon particles have mostly micropores and hollow structure. In this work, the spray pyrolysis using sucrose and sodium bicarbonate was applied to prepare porous carbon particles. To control the surface area, mesoporosity and microstructure of carbon particles, a small amount of TEOS was added to the spray solution. Then, TEOS-derived intermediates can be easily removed by a simple ultrasonic washing without using any high-concentration basic chemicals. Resultantly, the porosity and microstructure of carbon spheres was controlled by changing the TEOS content. The electrochemical properties of the porous carbons prepared were evaluated by using cyclic voltammetry and electrochemical impedance spectroscopy. Finally, the use of TEOS with sodium bicarbonate was found to an effective way to produce porous carbon with large mesopores and enhanced ion sorption capacitance.
2. Experimental
2.1 Materials and synthesis of porous carbon spheres
Sucrose, sodium bicarbonate (NaHCO3, Aldrich) and tetraethyl orthosilicate (TEOS, Aldrich, 98%) were used as the starting materials, respectively. An ultrasonic spray pyrolysis process was applied to synthesize mesoporous carbon powders. The used spray pyrolysis apparatus (Fig. S1†) consists of an ultrasonic aerosol generator with 6 vibrators of 1.7 MHz, a quartz tube (55 mm in diameter and 1200 mm in length), and a Teflon bag filter. To prepare the spray solution, the precursors were dissolved in purified water of 500 mL containing nitric acid of 10 mL. The concentrations of sucrose and NaHCO3 were 0.5 M (85.6 g) and 0.5 M (21.0 g), respectively. The TEOS content was changed from 0.05 to 0.15 in the mole ratio with respect to sucrose.The prepared precursor solution was atomized by the ultrasonic aerosol generator, and the formed droplets were carried into the quartz reactor of 800 °C by N2 (10 L min−1). The generated powders were withdrawn by the Teflon bag filter installed at the end of the quartz tube. Finally, the as-prepared carbon powders were washed several times using purified water in order to remove alkali salts. The carbon powder prepared without the use of TEOS was denoted as SPC00. The carbons prepared at 0.05, 0.10 and 0.15 in the mole ratio of TEOS to sucrose were named as SPC05, SPC10 and SPC15, respectively.
2.2 Characterization
The crystal structures and the microstructure of the prepared carbon samples were characterized by using X-ray diffraction (XRD, Rigaku, MiniFlex600), field-emission scanning electron microscopy (FE-SEM, Hitachi S4800) and field-emission transmission electron microscopy (FE-TEM, JEOL-2100F) at the Suncheon center of Korea basic science institute (KBSI). The specific surface area was calculated using a Brunauer–Emmett–Teller (BET) method from nitrogen adsorption isotherm data.The electrochemical properties of carbon spheres were investigated by the cyclic voltammetry (CV) and electrical impedance spectroscopy (EIS) measurements in a typical three-electrode system. A carbon paste to make working electrodes was prepared by mixing the prepared carbon powder (1.5 g) with 0.2 g of polyvinylidene fluoride (PVdF, Mw = 530![[thin space (1/6-em)]](https://www.rsc.org/images/entities/char_2009.gif) 000) and 5.8 g of di-methylacetamide (DMAc) using a planetary centrifugal mixer (Thinky mixer, ARE-310). A carbon film was formed on a graphite sheet (Dong-bang Carbon Co., Korea) via a doctor-blade method and tested as the working electrode (2.54 cm2 in area) in 0.5 M KCl solution through the CV and EIS measurements. In the used three-electrode system, a carbon-coated platinum rode and an Ag/AgCl electrode were used as a counter and a reference electrode, respectively. Cyclic voltammetry was performed using a potentiostat (AutoLab PGST30) in the potential range from −0.5 V to 0.5 V (vs. Ag/AgCl) at a scan rate of 10 mV s−1. The EIS analysis was measured by the potentiostat connected with a frequency response analyser (FRA) at a frequencies range from 20 mHz to 100 Hz.
000) and 5.8 g of di-methylacetamide (DMAc) using a planetary centrifugal mixer (Thinky mixer, ARE-310). A carbon film was formed on a graphite sheet (Dong-bang Carbon Co., Korea) via a doctor-blade method and tested as the working electrode (2.54 cm2 in area) in 0.5 M KCl solution through the CV and EIS measurements. In the used three-electrode system, a carbon-coated platinum rode and an Ag/AgCl electrode were used as a counter and a reference electrode, respectively. Cyclic voltammetry was performed using a potentiostat (AutoLab PGST30) in the potential range from −0.5 V to 0.5 V (vs. Ag/AgCl) at a scan rate of 10 mV s−1. The EIS analysis was measured by the potentiostat connected with a frequency response analyser (FRA) at a frequencies range from 20 mHz to 100 Hz.
3. Results and discussion
3.1 Porosity evaluation
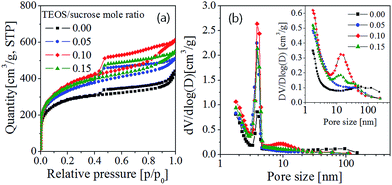
Fig. 1 shows the N2 adsorption/desorption isotherms and the pore size distributions of the prepared carbon particles which were synthesized by changing the molar ratio of TEOS to sucrose in the precursor solution. The observed isotherms correspond to the type IV of IUPAC classification, which is a typical characteristic of mesoporous materials. The prepared carbons have distinctive hysteresis curves at relative pressures (P/P0) of 0.45–1.0. The carbon prepared without using TEOS has a H3 hysteresis loop which does not have a plateau at high P/P0 values. This H3 type indicates there is no well-defined mesopores. On the contrary, the carbon powders prepared with using TEOS have the hysteresis loops which are close to the H2 type which is observed in typical mesoporous materials having interconnected pores of different size or shape. According to the pore size distribution (Fig. 1(b)) derived from the desorption branch, it is clear that the carbon powders prepared from the precursor solution containing TEOS have much more mesopores (3–5 nm) compared with the carbon prepared without TEOS. The texture properties of all prepared carbons were summarized in Table 1.The carbons (SPC05, SPC10, and SPC15) prepared by using TEOS have the BET surface area of 1067–1180 m2 g−1, and the carbon (SPC00) prepared without using TEOS has the BET surface area of 921 m2 g−1. Clearly, the TEOS addition to the spray solution makes it possible to enlarge the specific surface area. The largest BET surface area was achieved when the mole ratio of TEOS to sucrose was 0.1, and it is about 1.3 times larger than the carbon powder (SPC00) prepared without TEOS. The increase of the surface area is attributed to the increment in both micropores (Smicro) area and external surface area (Sext). Fig. 2 shows the total surface area and pore volume for the carbon samples. Micropores are generated by small gas molecules evolved by pyrolysis of sucrose or TEOS. The external surface area is mostly due to mesopores which is formed by the removal of salt nanoparticles remained in the as-prepared carbon powder. All the changes observed in the surface area or the pore volume are attributed to the added TEOS because the NaHCO3 and sucrose contents are fixed. The increase of the TEOS content generates more gaseous elements by the pyrolysis so that the micropore surface area increases slightly with increasing the TEOS content. The external surface area is also increased by the use of TEOS, but it does not monotonically increase with increasing the TEOS content and shows a maximum value when the ratio of TEOS to sucrose is 0.1. The external surface area of the SPC00 carbon is about 8.0% of the total BET area. When the carbon particles were prepared by adding TEOS, the percentage of the external surface was 9.0% (SPC05), 15.2% (SPC10) and 11.2% (SPC15) higher than that of the SPC00 carbon. That is, the use of TEOS produces more mesopores. The SPC10 carbon has the largest external surface of 179 m2 g−1, approximately 2.4 times larger than the SPC00 carbon (74 m2 g−1) prepared without TEOS. The change in pore volume with varying the TEOS content is similar to the behavior of the surface area. The micropore volume of SPC05 carbon (0.462 cm3 g−1) is larger than that of the SPC00 carbon (0.360 cm3 g−1), but the mesopore volume (Vtotal − Vmicro) of the two carbons is approximately the same: 0.207 cm3 g−1 (SPC00) and 0.191 cm3 g−1 (SPC05). In the SPC10 sample, however, the mesopore volume (0.318 cm3 g−1) is about 1.5 times larger than that of the SPC00. BJH desorption pore sizes are 3.9, 3.2, 3.4, 3.3 nm for the SPC00, SPC05, SPC10 and SPC15 carbons, respectively. That is, the added TEOS did not significantly change the average pore size calculated from the desorption isotherm.
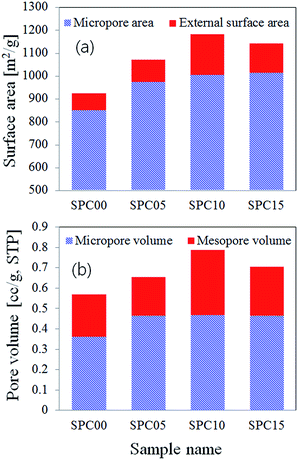 | ||
| Fig. 2 Total surface area (a) and pore volume (b) of carbon particles synthesized by changing the TEOS/sucrose mole ratio via spray pyrolysis. | ||
In interconnected pore systems with a hysteresis loop, the pore size distribution (PSD) is affected by the pore network effects. The sudden desorption in the P/P0 range of 0.4–0.5 is caused by the evaporation of metastable pore liquid, which is referred to as the tensile strength effect (TSE).43 Given this, the PSD based on the desorption branch reveals an artificial peak and do not reflect the real pore size distribution. Instead, the PSD derived from the adsorption branch does not exhibit artificial peaks and makes it possible to explain more realistic pore size. The inset of Fig. 1(b) is the PSD derived from the adsorption isotherm. The SPC00 carbon does not have any peak in the region of 10–50 nm, but there is a broad distribution in macropore regions (>50 nm). The SPC05 carbon shows a weak peak at about 40 nm. The SPC10 carbon has a sharp distribution centered about 15 nm. For SPC15 carbon, there are two peaks, one observed around 15 nm and the other observed around 40 nm. From the pore size distribution derived from the adsorption branch, it is clear that many mesopores larger than 10 nm are generated by preparing carbon powders with using TEOS. From the results achieved so far, it has been found that the use of TEOS is an effective way for increasing the specific surface area. In particular, adding TEOS to the spray solution makes it possible to increase the mesopores surface. In terms of the surface area and the pore volume, the optimal TEOS content was determined as 0.1 in mole ratio with respect to sucrose.
3.2 Microstructure analysis
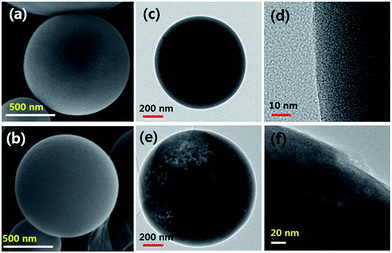
Fig. 3 shows SEM and TEM images of carbon spheres (SPC00 and SPC10) obtained after the ultrasonic washing of as-prepared particles. Both samples, SPC00 and SPC10 have spherical morphology, but they show different microstructure. For the case of the SPC 00 carbon prepared without the use of TEOS, large pores are observed inside the carbon particles. As shown in the inset of Fig. 1(b), a broad peak around 100 nm in the pore size distribution is in good agreement with the formation of large pores observed in the TEM image of Fig. 3(c). On the other hand, the carbon particles (SPC10) prepared using TEOS have not hollow- but filled-morphology. Many mesopores are observed in the entire region of particles. According to the high-resolved TEM images for the surface region (Fig. 1(d) and (f)), the SPC00 carbon has nanoporous structure and the SPC10 carbon has mesopores (10–20 nm) that can be identified with the naked eyes. In the inset of Fig. 1(b), the SPC10 carbon showed a sharp peak around 15 nm, which is in good agreement with the pores observed from TEM measurements.The washing of as-prepared carbon particles was carried out only using purified water. Thus, NaHCO3 and TEOS should exist as a water-soluble form in carbon matrix. Fig. 4 shows XRD patterns before and after the washing for the SPC00 and SPC10 carbons. For the SPC00 carbon obtained before the washing, two hydrated crystal peaks were observed. One is Na2CO3–H2O (JCPDS no. 008-0448) and the other is Na3H(CO3)2–2H2O (JCPDS no. 029-1447). For the SPC10 carbon before the washing, the observed peaks are well indexed to Na3H(CO3)2–2H2O crystals. There is no crystal form related to silicon oxide. The formed Na2CO3–H2O or Na3H(CO3)2–2H2O salts are highly soluble in water. Thus, they can be easily removed from the carbon matrix via a simple water-based washing process, which was confirmed by the XRD results for the carbon powder obtained after the washing.
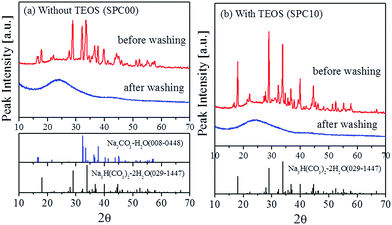 | ||
| Fig. 4 XRD patterns of carbon particles before and after the ultrasonic washing using purified water. | ||
For the SPC10 carbon particles, it is surmised that amorphous silicon oxide is formed from the pyrolysis of TEOS. To identify that silicon oxides can be extracted by the ultrasonic washing, the element mapping analysis was carried out. Fig. 5 shows TEM and element mapping results for the SPC10 carbon before and after the washing. Before the washing, the Si elements exist in the whole region of carbon matrix without any phase separation. After the washing, the quantity of Si elements was largely reduced. According to EDX analysis (Fig. S2†), the percentage of Si in as-prepared carbon particles was about 1.15 at%, and it was reduced to 0.01% after the washing. That is, about 99% of Si elements were removed by the ultrasonic washing. It is well known that SiO2 can be dissolved out in NaOH solution. Na3H(CO3)2–2H2O salts are dissociated to Na+, OH−, and HCO3− ions in the washing water. As a result, the washing solution becomes highly basic condition enough to dissolve SiO2 in carbon matrix because the mole concentration of Na ions is ten times higher than that of Si in the precursor solution. For the SPC05 and SPC15 carbons obtained after the ultrasonic washing, the element mapping was carried out, and the results were shown in Fig. S3.† It was confirmed that the Si elements are mostly removed in the SPC05 carbon, but a considerable amount of Si elements remains in the SPC15 carbon. Thus, the remained silicon-based oxides plugged the pores, resulting in the decrease in the surface area of the SPC15 carbon, especially in the external surface area, compared with the SPC10 carbon.
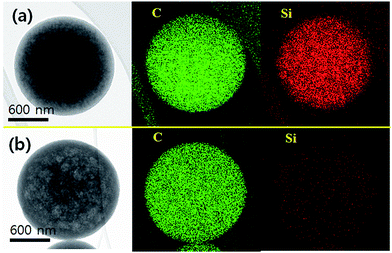 | ||
| Fig. 5 TEM and element mapping for the SPC10 carbons before (a) and after (b) the ultrasonic washing using purified water. | ||
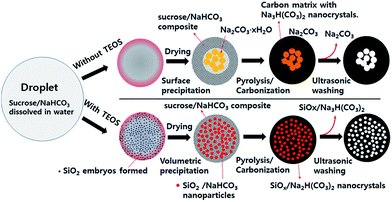
On the base of the results achieved from SEM, TEM, element mapping and XRD analysis, the mechanism of the porous carbon formation in spray pyrolysis was expressed in Fig. 6. In spray pyrolysis, the microstructure of particles is changeable depending on the precipitation behavior of salts during the drying step. As droplets are heated, water evaporation proceeds, which leads to increase the surface concentration of salts. Then, the surface precipitation of salts begins because the surface concentration first reaches a supercritical saturation due to the fast drying of water. On the contrary, the volumetric precipitation occurs when the drying of water is low enough to induce the concentration increment of salts in the whole droplets. Also, the volumetric precipitation of slats can occur in the case that ultrafine colloidal particles exist initially in droplets, because the precipitation tends to first begin on the colloid surface.
When TEOS is not used, the fast water evaporation induces the surface precipitation which generates the surface shell layer of the sucrose/NaHCO3 composite. As droplet temperature increases further, the dehydration of NaHCO3 proceeds in the inside region of droplets, and Na2CO3 nanocrystals are generated progressively. After the drying is complete, the pyrolysis and carbonization of sucrose begins. In this step, NaHCO3 is turned into Na3H(CO3)2 nanocrystals via partial pyrolysis under a N2 environment. The formed Na2CO3 or Na3H(CO3)2 nanocrystals are removed easily by the ultrasonic washing and will contribute to form mesopores or macropores. In the case of using TEOS, SiO2 embryos exist initially in droplets. As the water evaporation proceeds, the sucrose/NaHCO3 composite particles are formed via the volumetric precipitation. In this step, SiO2 embryos are trapped within the sucrose/NaHCO3 matrix. Also, some SiO2 embryos take part in forming NaHCO3/SiO2 composited nanoparticles. Thereafter, the resulting sucrose/NaHCO3 composite particles are changed into carbon and Na3H(CO3)2 or Na3H(CO3)2/SiO2 composited nanoparticles via pyrolysis and carbonization processes. The existence of Na3H(CO3)2/SiO2 composited nanoparticles formed in carbon matrix are identified from the HR-TEM images of particles before the washing (Fig. S4†). Finally, Na3H(CO3)2/SiO2 nanoparticles are extracted out of carbon matrix in the ultrasonic washing step, forming a lot of mesopores as shown in Fig. 3(e).
In precipitation and carbonization processes, the size or distribution of Na3H(CO3)2/SiO2 composited nanoparticles within the carbon matrix can be affected by the content of TEOS. When no TEOS is used, the precipitated Na2CO3 is decomposed and grown as Na3H(CO3)2 nanocrystals of about 100 nm in the core of the hollow carbon matrix in the pyrolysis and carbonization step. This is the cause of the observed macropores of about 100 nm in the TEM image (Fig. 3(c)) and the pore size distribution (Fig. 1(b)). However, according to the pore size distribution derived from the adsorption isotherm (Fig. 1(b), inset), all carbons prepared using TEOS do not have macropores of about 100 nm. This result indicates that the SiO2 embryos do change the size and distribution of water-soluble salt precipitates. That is, the SiO2 embryos are involved in forming Na3H(CO3)2/SiO2 nanoparticles during the carbonization and prevent Na2CO3 from growing into large crystals.
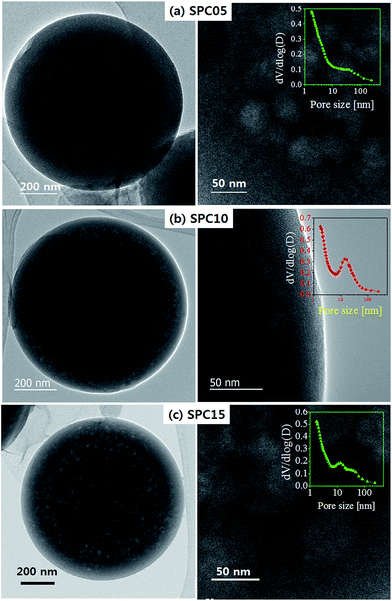
To confirm the effect of TEOS contents, TEM images and pore size distributions derived from the adsorption branch are shown in Fig. 7. The SPC05 carbon has mesopores of about 40–50 nm, which indicates that the Na3H(CO3)2/SiO2 nanoparticles of about 40–50 nm are formed and distributed in the carbon matrix. At low TEOS content, the SiO2 embryos do not seem to be enough to avoid the growth of sodium carbonates in the carbonization step. With increasing the TEOS content, more SiO2 embryos are present in the initial precursor solution and act as seeds for precipitation. Resultantly, most sodium carbonates are converted to Na3H(CO3)2/SiO2 nanoparticles of approximately 15–20 nm rather than growing into large individual crystals. Also, the Na3H(CO3)2/SiO2 nanoparticles are distributed throughout the carbon matrix and contribute to generate a lot of mesopores when removing through a washing process. This hypothesis is evidenced from the TEM image (Fig. 7(b)) or the pore size distribution (Fig. 7(b), inset) for the SPC10 carbon. When the TEOS content is high (in the case of SPC15 carbon), the number of Na3H(CO3)2/SiO2 nanoparticles seems to be too large to be independently distributed in the carbon matrix. That is, in the carbonization step, particle growth occurs by agglomeration between Na3H(CO3)2/SiO2 nanoparticles. As a result, the SPC15 carbon has mesopores of about 40–50 nm with the pores of 15–20 nm in the pore size distribution (inset of Fig. 7(c)).
3.3 CV and EIS measurement
The electrochemical properties of carbons prepared were evaluated by cyclic voltammetry (CV) and electrochemical impedance spectroscopy (EIS) measurements. The specific capacitance (C) is calculated from the CV data using the following equation:
 | (1) |
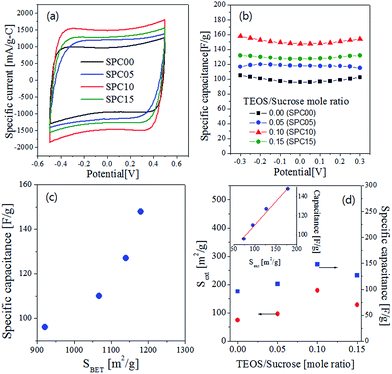
Fig. 8(a) is the CV curves which have nearly a rectangular shape, indicating that the adsorption and desorption of ions are well achieved reversely. The specific capacitance values are displayed in Fig. 8(b) as a function of the applied voltages. The carbons (SPC05, SPC10, SPC15) prepared by using TEOS have higher specific capacitance than the SPC00 carbon. The specific capacitance at 0.0 V was summarized in Table 2. The SPC10 carbon has the largest capacitance (148 F g−1) which is about 1.5 times larger than that (96 F g−1) of the SPC00 carbon. If ions can be adsorbed on all surfaces, the capacitance should increase linearly with the total surface area. To confirm the surface area effect, the specific capacitance at 0.0 V was expressed as a function of the BET surface area (Fig. 8(c)). The specific capacitance does not have a linear relation with the BET surface area, indicating that all surfaces do not contribute to the adsorption of ions. The external surface area (Sext) and the specific capacitance were displayed as a function of the TEOS/sucrose mole ratio in Fig. 8(d). Both the external surface and the specific capacitance exhibit a similar behavior for the change of the TEOS/sucrose mole ratio. As shown in the inset of Fig. 8(d), the specific capacitance increases linearly with the external surface area. These results indicate that the increase in the specific capacitance of carbons prepared by using TEOS is mainly attributed to the increase of the external surface due to the formation of many mesopores.
| Sample name | Specific capacitance [F g−1] | Rd [Ω] | σ [Ω s−1/2] | D [cm2 s−1] |
|---|---|---|---|---|
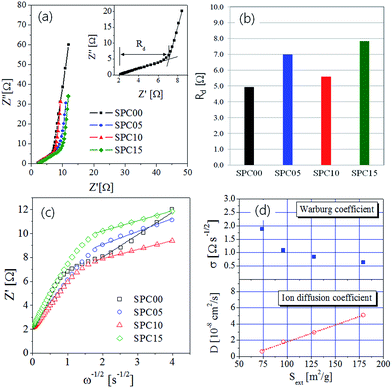
| SPC00 | 96 | 4.9 | 1.878 | 0.60 × 10⁻⁸ |
| SPC05 | 110 | 7.0 | 1.087 | 1.79 × 10⁻⁸ |
| SPC10 | 148 | 5.6 | 0.646 | 5.07 × 10⁻⁸ |
| SPC15 | 127 | 7.8 | 0.847 | 2.95 × 10⁻⁸ |
EIS experiments were conducted to further examine the basic electrochemical behavior of synthesized carbon materials. Fig. 9(a) is the Nyquist plot for the impedances obtained in the frequency range from 0.01 Hz to 500 Hz. The intercept of the real axis (Z′) in the Nyquist plot is corresponding to the equivalent series resistance (ESR) associated with the bulk electrolyte/electrode material/current collector interfaces. As the frequency decreases, the impedance is close to a vertical curve that can be observed in a typical supercapacitor. As shown in the inset of Fig. 9(a), there is a liner relation with a slope of 45° between Z′(Re) and Z′′(Im) in the high frequency region. This is corresponding to the Warburg impedance, which represents the frequency dependent diffusion of ions within the porous electrode. That is, the real axis value (Z′) in this linear region is corresponding to the diffusion resistance (Rd) of ions. The estimated diffusion resistance values were summarized in Table 2 and showed in Fig. 9(b). The carbons prepared by using TEOS have the diffusion resistance slightly greater than the SPC00 carbon. In terms of ion diffusion, mesopores are more helpful than micropores. If carbon has only micropores, the ion adsorption is limited near the surface region of microporous carbon matrix. That is, the ion diffusion length is short. If carbon has mesopores along with micropores, the mesopores allows ions to penetrate deeper into the porous carbon matrix, thereby increasing the effective surface area that is substantially involved in ion sorption. This situation is good for improving the specific capacitance because of the substantially increment in the effective surface area for ion sorption. On the other hand, the deep penetration of ions lengthens the diffusion path, resulting in the increase of the ion diffusion resistance. Thus, the increase in the diffusion resistance (Rd) of carbons prepared using TEOS is due to the elongation of the diffusion path by the formation of more mesopores with increasing micropores. The SPC10 carbon has a smaller Rd value than the SPC05 or SPC15 carbons, but has the largest number of mesopores (Sext). According to Fig. 1(b), large mesopores of about 15 nm were generated only at the SPC10 carbon, which is thought to be a cause of relatively small diffusion resistance.
The carbon porosity directly affects the diffusion rate of ions. Warburg impedance (ZW) is basically created by the diffusion of ions in porous carbon electrodes and expressed by the following equation:44
| ZW = σω−1/2(1 − j) | (2) |
 | (3) |
4. Conclusions
Porous carbon spheres were synthesized by spray pyrolysis, and TEOS was investigated as an additive to control the porosity and microstructure. The addition of TEOS to the precursor solution containing sucrose and NaHCO3 was found to effectively increase the specific surface of carbon spheres. In particular, the use of TEOS was very effective in generating more mesopores. As a result, the external surface area of carbons prepared using TEOS was about 2.4 times larger than that of the carbon produced without TEOS. In terms of the BET surface area or the external surface area, the optimum content of TEOS was determined as 0.1 in mole ratio to sucrose. The microstructure of carbon spheres prepared by spray pyrolysis was also changed by the use of TEOS. When TEOS was not used, hollow carbon spheres with a thick microporous layer were generated. On the other hand, the carbons prepared by using TEOS showed a filled structure with micropores and mesopores in the entire carbon spheres. A possible formation mechanism for different carbon structures has been proposed on the basis of TEM, element mapping and XRD analysis results. According to the evaluation of the electrochemical performance, the carbons prepared suing TEOS showed an enhanced specific capacitance due to an increase in specific surface area. The ion-sorption capacitance was linearly related to the increase of external surface area with the change of TEOS content. In addition, the ion diffusion coefficient calculated from the Randle's plot of EIS data increased linearly with increasing external surface area. Given this, the addition of TEOS to the precursor solution in the spray pyrolysis was experimentally proved to be a simple and effective way of preparing highly mesoporous carbons spheres having high ion diffusion rate and large effective surface area substantially involved in the ion sorption.Acknowledgements
This research was supported by Basic Science Research Program through the National Research Foundation of Korea (NRF) funded by the Ministry of Science, ICT & Future Planning (Grant No. 2015R1A2A2A03006558).Notes and references
- B. Li, F. Dai, Q. Xiao, L. Yang, J. Shen, C. Zhang and C. Cai, Energy Environ. Sci., 2016, 9, 102 CAS.
- M. Zhi, F. Yang, F. Meng, M. Li, A. Manivannan and N. Wu, ACS Sustainable Chem. Eng., 2014, 2, 1592 CrossRef CAS.
- F. Lai, Y. Huang, L. Zuo, H. Gu, Y.-E. Miao and T. Liu, J. Mater. Chem. A, 2016, 4, 15861 CAS.
- Y. Shen, X. Zhu, L. Zhu and B. Chen, Chem. Eng. J., 2017, 314, 336 CrossRef CAS.
- G. P. Rao, C. Lu and F. Su, Sep. Purif. Technol., 2007, 58, 224 CrossRef CAS.
- R. H. Baughman, A. A. Zakhidov and W. A. de Heer, Science, 2002, 297, 787 CrossRef CAS PubMed.
- Q. Zhang, J.-Q. Huang, W.-Z. Qian, Y.-Y. Zhang and F. Wei, Small, 2013, 9, 1237 CrossRef CAS PubMed.
- A. Jain, S. Jayaraman, M. Ulaganathan, R. Balasubramanian, V. Aravindan, M. P. Srinivasan and S. Madhavi, Electrochim. Acta, 2017, 228, 131 CrossRef CAS.
- S. Mezzavilla, C. Baldizzone, K. J. Mayrhofer and F. Schüth, ACS Appl. Mater. Interfaces, 2015, 7, 12914 CAS.
- V. Chabot, D. Higgins, A. Yu, X. Xiao, Z. Chen and J. Zhang, Energy Environ. Sci., 2014, 7, 1564 CAS.
- C. Si, Z. Sun and F. Liu, Nanoscale, 2016, 8, 3207 RSC.
- M. Diba, D. W. H. Fam, A. R. Boccaccini and M. S. P. Shaffer, Prog. Mater. Sci., 2016, 82, 83 CrossRef CAS.
- C. Lu, S. Liu, F. Zhang, Y. Su, X. Zou, Z. Shi, G. Li and X. Zhuang, J. Mater. Chem. A, 2017, 5, 1567 CAS.
- J. S. Lee, J. Jun, S. Cho, W. Kim and J. Jang, RSC Adv., 2017, 7, 201 RSC.
- S. N. Talapaneni, J. H. Lee, S. H. Je, O. Buyukcakir, T.-W. Kwon, K. Polychronopoulou, J. W. Choi and A. Coskun, Adv. Funct. Mater., 2016, 27, 1604658 CrossRef.
- M. A. Patel, F. Luo, K. Savaram, P. Kucheryavy, Q. Xie, C. Flach, R. Mendelsohn, E. Grafunkel, J. V. Lockard and H. He, Carbon, 2017, 114, 383 CrossRef CAS.
- J.-S. Yu, S. Kang, S. B. Yoon and G. Chai, J. Am. Chem. Soc., 2002, 124, 9382 CrossRef CAS PubMed.
- Y. Yang, K. Chiang and N. Burke, Catal. Today, 2011, 178, 197 CrossRef CAS.
- D.-W. Wang, F. Li, G. Q. Lu and H.-M. Cheng, Carbon, 2008, 46, 1593 CrossRef CAS.
- F.-Q. An, D. Zhang, X.-X. Yue, G.-L. Ou, J.-F. Gao and T.-P. Hu, Korean J. Chem. Eng., 2016, 33, 576 CrossRef CAS.
- J. Kim, S. Y. Oh, J. Y. Park and Y. Kim, Korean J. Chem. Eng., 2016, 33, 344 CrossRef CAS.
- G. Srinivas, V. Krungleviciute, Z.-X. Guo and T. Yildirim, Energy Environ. Sci., 2014, 7, 335 CAS.
- M. Antonietti, N. Fechler and T.-P. Fellinger, Chem. Mater., 2014, 26, 196 CrossRef CAS.
- S.-M. Alatalo, K. Qiu, K. Preuss, A. Marinovic, M. Selvila, M. Sillanpää, X. Guo and M.-M. Titirici, Carbon, 2016, 96, 622 CrossRef CAS.
- R. Ryoo, S. H. Joo and S. Jun, J. Phys. Chem. B, 1999, 103, 7743 CrossRef CAS.
- J. Lee and J. Kim, Adv. Mater., 2006, 18, 2073 CrossRef CAS.
- D. Zhu, Y. Wang, W. Lu, H. Zhang, Z. Song, D. Luo, L. Gan, M. Liu and D. Sun, Carbon, 2017, 111, 667 CrossRef CAS.
- A. Ahmadpour and D. D. Do, Carbon, 1999, 34, 471 CrossRef.
- L. Muniandy, F. Adam, A. R. Mohamed and E.-P. Ng, Microporous Mesoporous Mater., 2014, 197, 316 CrossRef CAS.
- H. N. Tran, S.-J. You and H.-P. Chao, J. Environ. Manage., 2017, 118, 322 CrossRef PubMed.
- S. E. Skrabalak and K. S. Suslick, J. Am. Chem. Soc., 2006, 128, 12642 CrossRef CAS PubMed.
- S. E. Skrabalak and K. S. Suslick, J. Phys. Chem. C, 2007, 111, 17807 CAS.
- H. Xu, J. Guo and K. S. Suslick, Adv. Mater., 2012, 24, 6028 CrossRef CAS PubMed.
- R. Balgis, T. Ogi, A. F. Arif, G. M. Anilkumar, T. Mori and K. Okuyama, Carbon, 2015, 84, 281 CrossRef CAS.
- A. F. Arif, Y. Chikuchi, R. Balgis, T. Ogi and K. Okuyama, RSC Adv., 2016, 6, 83421 RSC.
- C. Wang, Y. Wang, J. Graser, R. Zhao, F. Gao and M. J. O'Connell, ACS Nano, 2013, 7, 11156 CrossRef CAS PubMed.
- P. H. Kim and K. Y. Jung, RSC Adv., 2016, 6, 1686 RSC.
- M. E. Fortunato, M. Rostam-Abadi and K. S. Suslick, Chem. Mater., 2010, 22, 1610 CrossRef CAS.
- R. Balgis, T. Ogi, W.-N. Wang, G. M. Anilkumar, S. Sago and K. Okuyama, Langmuir, 2014, 30, 11257 CrossRef CAS PubMed.
- Y. Yan, F. Zhang, Y. Meng, B. Tu and D. Zhao, Chem. Commun., 2007, 2867 RSC.
- J. E. Hampsey, Q. Hu, L. Rice, J. Pang, Z. Wu and Y. Lu, Chem. Commun., 2005, 3606 RSC.
- S. E. Skrabalak, Phys. Chem. Chem. Phys., 2009, 11, 4930 RSC.
- J. C. Groen, L. A. A. Peffer and J. Pérez-Ramírez, Micropor. Mesopor. Mater., 2003, 60, 1 CrossRef CAS.
- A. Singh and A. Chandra, Sci. Rep., 2016, 6, 25793 CrossRef CAS PubMed.
- S.-K. Kim and H. S. Park, RSC Adv., 2014, 4, 47827 RSC.
Footnote |
| † Electronic supplementary information (ESI) available. See DOI: 10.1039/c7ra01999h |
| This journal is © The Royal Society of Chemistry 2017 |

