 Open Access Article
Creative Commons Attribution 3.0 Unported Licence
Positron annihilation lifetime, cation distribution and magnetic features of Ni1−xZnxFe2−xCoxO4 ferrite nanoparticles
Hossein Nikmanesh *ab,
Parviz Kamelia,
Seyed Morteza Asgarianb,
Shiva Karimia,
Mahmood Moradib,
Zohreh Kargarb,
Joao Ventura
 c,
Bernardo Bordaloc and
Hadi Salamatia
aPhysics Department, Isfahan University of Technology, Isfahan 84156-83111, Iran. E-mail: h.nikmanesh@yahoo.com
bPhysics Department, College of Sciences, Shiraz University, Shiraz 71946-84795, Iran
cIFIMUP, IN-Institute of Nanoscience and Nanotechnology, Departamento de Fisica, Faculdade de Ciencias, Universidade do Porto, Rua do Campo Alegre, 687, 4169-007 Porto, Portugal
First published on 21st April 2017
Abstract
A series of Zn and Co-substituted nickel ferrite nanoparticles of nominal composition Ni1−xZnxFe2−xCoxO4 (x = 0, 0.1, 0.2, 0.3, 0.4, 0.5) have been synthesized by the PVA assisted sol–gel method. The reported structural and magnetic properties of the samples were investigated by X-ray diffraction (XRD), field emission scanning electron microscopy (FESEM), Fourier transform infrared spectroscopy (FTIR) and vibrating sample magnetometry (VSM). Also, the effect of these substitutions on vacancy distribution is investigated with positron annihilation lifetime spectroscopy (PALS). The cation distribution is inferred from the X-ray diffraction using the MAUD program to investigate ion occupancy, the exact coordinates of the atoms and unit cell dimensions. XRD analysis using the Rietveld refinement technique proves the crystalline structure and the growth of pure, single-phase and nanosize substituted nickel ferrite. These results are confirmed by the performed FESEM and FTIR studies. Magnetic measurements revealed that the values of the saturation magnetization (Ms) in the Ni1−xZnxFe2−xCoxO4 samples gradually increased for doping levels up to x = 0.4, then decreasing for further content. Also, the coercivity showed an overall decreasing trend with increasing doping. The positron lifetime spectra of the substituted nickel ferrite were decomposed into three-lifetime components, τ1, τ2, τ3. First of all, τ1, is depends on the positrons that do not get trapped by the vacancy defects. The second lifetime component, τ2, is attributed to positrons annihilation in vacancy-type defects in ferrite nanoparticles. The final lifetime, τ3, is due to the annihilation of positrons across nanoparticles in the free volume of ferrite structure. Also, magnetic behaviors could be explained by positron annihilation lifetime spectroscopy.
1. Introduction
In recent years, spinel ferrites have been extremely studied for their effective application in microwave devices, information storage systems, sensors, loading coils, magnetic fluids and medical diagnostics.1–6 Thus, much attention has been focused on the preparation and characterization of these materials.6–8 Spinel ferrites have the general chemical formula (A2+)[B23+]O42−, where A2+ and B23+ are divalent (i.e. Co, Ni, Mn, Zn, …) and trivalent (i.e. Fe, Cr, …) cations occupying tetrahedral (A site) and octahedral (B site) interstitial positions of the fcc lattice formed by O2− ions. As the cations in the two sites (A and B) are antiferromagnetically ordered, the magnetic properties observed in spinel ferrites are due to the unbalanced magnetic moments of the A and B sites. It is well known that the magnetic moment of the A and B sites depends on the cation distribution in these sites.7–9 The knowledge of the cation distribution and spin alignment is essential to develop materials and to obtain the desired magnetic properties for the above-mentioned applications. In this regard, the investigation of the defect structure of nanosize ferrites is attracting a large amount of attention,9–12 because of the significant role of vacancy-type defects in altering the electrical, magnetic and optical properties of bulk and nano-materials. Positron annihilation lifetime spectroscopy (PALS) is a sensitive technique for the characterization of the electronic structure and type and density of vacancy-type defects that can be straightforwardly and effectively applied in materials science, especially in spinel ferrites.12One of the important class of spinel ferrites that is widely used in engineering and technology is nickel ferrite. Nickel ferrite (NiFe2O4) is a well-known inverse spinel ferrite in the bulk state with Ni2+ ions on B sites and Fe3+ ions distributed equally among A and B sites.7 However, when nickel ferrite is synthesized at the nanoscale, it presents a mixed spinel structure with cations distributed on both A and B sites.13–15 In addition, nickel–zinc ferrite is one of the soft magnetic materials which has large resistivity (106 Ω cm), high saturation magnetization, a high Curie temperature (570 °C), low coercivity and low dielectric.16,17 Thus, the doping of metal ions in the nickel spinel structure may result to tune the structural, morphological, electrical and magnetic properties that lead to improve these properties for technological progress. For example, doping of nickel ferrites with zinc ions as a mixed spinel was studied by Rahimi and co-workers.14 They showed that Zn2+ cations replaced Ni2+ in the tetrahedral sites so that the magnetic properties are changed. Thus, the saturation magnetization (Ms) initially increased for low doping levels but decreased with higher dopant concentration. Also, they showed that coercivity decreased by increasing Zn content due to the decrease of magnetocrystalline anisotropy constant. Saffari et al.15 investigated the effects of Co-substitution on the magnetic properties of NiCoxFe2−xO4 ferrites. They demonstrated that while Ms remained nearly constant with increasing Co3+, the coercivity (Hc) increased significantly. Parvatheswara et al. studied the structure and magnetic behavior of nickel zinc cobalt ferrites. They reported that the cobalt substitution instead of zinc enhances the saturation magnetization while initial permeability decreases.18 Generally, it would be useful if both saturation magnetization and coercivity could be held high or low upon the substitution. Thus, in view of the above discussions, the Zn–Co doped Ni1−xZnxFe2−xCoxO4 could show different magnetic behaviors that can be useful for various applications.
The present work deals with the cation distribution and magnetic properties of zinc–cobalt substituted nickel ferrite Ni1−xZnxFe2−xCoxO4 (x = 0, 0.1, 0.2, 0.3, 0.4, 0.5) synthesized by the PVA (polyvinyl alcohol) assisted sol–gel route. PALS was used to evaluate the vacancy type defects due to cobalt–zinc doped nickel ferrite. We attempt to find up a consistent correlation between the magnetic properties and the cation distribution and the defects concentration estimated by PALS in the prepared samples.
2. Experimental procedure
2.1. Samples preparation
Here, the polyvinyl alcohol (PVA) assisted sol–gel method was adopted for synthesizing Zn–Co substituted nickel ferrite samples. Iron nitrate (Fe(NO3)3·9H2O), nickel nitrate (Ni(NO3)2·6H2O), cobalt nitrate (Co(NO3)2·6H2O), zinc nitrate (Zn(NO3)2·4H2O), and PVA were taken as the raw materials and weighted according to the stoichiometric ratio. At first, the PVA solution was prepared by dissolving PVA powders in deionized water (3% w/v) at a temperature of about 80 °C until the solution became clear. At this point, and in order to avoid aggregation of the PVA in the water, the powder was slowly sprinkled in water under constant stirring. Then, the sols were prepared by dissolving all raw nitrate in deionized water. After constant stirring, the sols were added drop by drop to the clear PVA solution. This solution was then heated to 90 °C and treated in constant stirring for 24 h till a gel was obtained. The temperature of the gel was then increased to 140 °C for 2 h until the water evaporated entirely and the gel was dried. Finally, the dried precursor was sintered at 800 °C for 4 h with heating rate 2 °C min−1.2.2. Samples characterization
X-ray diffraction (XRD) pattern of all samples was obtained on a Philips X'Pert Pro MPD X-ray diffractometer with Cu-Kα radiation (λ = 0.154 nm). We have employed the Material Analysis Using Diffraction (MAUD) program, version 2.54 for Rietveld analysis. It is designed to refine simultaneously both cation distribution and structural properties (lattice cell constants and atomic positions and occupancies). Positron annihilation lifetime measurements were performed using a slow–fast gamma–gamma coincidence spectrometer with time resolution (full width at half maximum; FWHM) of 250 ps for gamma rays emitted from a 60Co source at room temperature. A total of about 106 coincidence events were collected in each lifetime spectrum. A source of strength ∼15 μCi from 22NaCl deposited on a Mylar foil with 7 μm thickness was used. The lifetime spectra were analyzed using the program Pasqual.19 The source corrections were obtained with measurements on defect-free Al samples. The variances of all of the fitted positron annihilation lifetime spectra lied in a range of reasonable values, between 0.97 and 1.06. The morphology of the annealed samples was determined by field emission scanning electron microscopy (FESEM; model S-4160). Also, the analysis of the samples formation was done using Fourier transform infrared spectroscopy (FTIR; Jasco 860 plus). Finally, magnetic hysteresis loops of the samples were recorded using a vibrating sample magnetometer (VSM; Lake Shore 7307) with a maximum field of ±10 kOe.3. Results and discussions
3.1. X-ray diffraction analysis
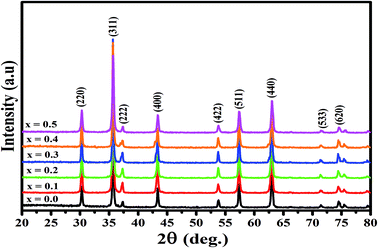
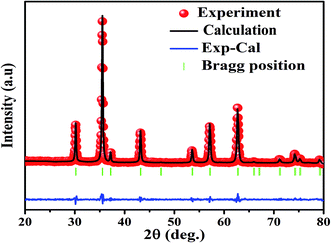
The X-ray diffraction spectra of Ni1−xZnxFe2−xCoxO4 (x = 0, 0.1, 0.2, 0.3, 0.4, 0.5) are shown in Fig. 1. The entire XRD patterns show the reflections belonging to cubic spinel structure with space group Fd3m and no extra peaks have been observed in the XRD patterns. The crystal structures were obtained using the MAUD program. The fitting quality of the experimental data was checked by weighted profile R-factor (Rwp), the expected R-factor (Rexp), and the goodness of the fit .20 In this fitting process, crystal lattice constant and cation distribution were determined. Fig. 2 shows a typical Rietveld analysis for the Ni0.5Zn0.5Fe1.5Co0.5O4 sample. In Table 1 and Fig. 3 are shown the variation of the lattice constant obtained from the MAUD program. The values of the lattice parameter ‘a’ are almost constant, but do not show a regular trend with increasing Zn–Co content, due to the different type of cation distribution and ionic radii in the doped-samples. The initial increase of lattice parameter can be related to the replacement of the smaller Ni2+ ions (0.55 Å, 0.69 Å) by the larger Zn2+ ions (0.60 Å, 0.74 Å)21 in A and B sites. Also, the decrease of lattice parameter above x = 0.3 can be caused by the replacement of larger Fe2+ ions (0.63 Å, 0.78 Å) by smaller Co2+ ions (0.58 Å, 0.74 Å) in A and B sites. In addition, a fraction of the B sites is occupied by Co3+ instead of Fe3+ ions. Therefore, the different ionic radii of the cations and the type of ions occupying A and B sites can result in the enhancement or reduction of the lattice parameters.
| X | aMAUD (Å) | ath (Å) | Rwp | Rexp | χ | rA (Å) | rB (Å) |
|---|---|---|---|---|---|---|---|
| x = 0 | 8.3752 | 8.3756 | 15.42 | 11.81 | 1.32 | 0.5188 | 0.7305 |
| x = 0.1 | 8.3798 | 8.3791 | 18.17 | 12.53 | 1.45 | 0.5313 | 0.7292 |
| x = 0.2 | 8.3777 | 8.3772 | 22.56 | 12.74 | 1.76 | 0.5313 | 0.7261 |
| x = 0.3 | 8.3801 | 8.3800 | 21.92 | 12.45 | 1.76 | 0.5374 | 0.7355 |
| x = 0.4 | 8.3776 | 8.3773 | 19.62 | 12.04 | 1.62 | 0.5409 | 0.7348 |
| x = 0.5 | 8.3718 | 8.3714 | 17.11 | 12.42 | 1.37 | 0.5410 | 0.7341 |
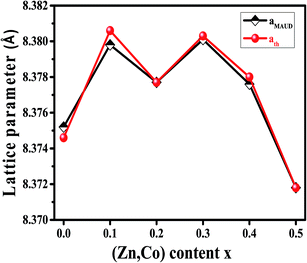 | ||
| Fig. 3 Variation of lattice parameter obtained by MAUD and theoretical lattice parameter of Ni1−xZnxFe2−xCoxO4 samples. | ||
3.2. FESEM morphology
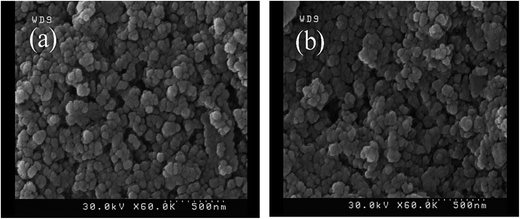
The morphology and microstructure of the samples were studied by FESEM images. The FESEM images of NiFe2O4 and Ni0.5Zn0.5Fe1.5Cr0.5O4 samples are shown in Fig. 4. The images show that particles are in the nanometer range (with average particle size about 60 nm), nearly spherical in shape and a tendency for agglomerated due to crystal growth and their magnetic interactions. Also, zinc and cobalt substituted in nickel ferrite overall seemed to have no effect on particle size.3.3. Cations distribution
The physical properties of ferrites are sensitive to the nature, valence and distribution of cations over the A and B sites. Thus, the knowledge and obtaining of suitable cation distribution can be helpful to understand the behavior of their magnetic and electrical properties.To determine the mechanism of Zn–Co substitution in Ni1−xZnxFe2−xCoxO4, the following three assumptions were considered. First of all, structural refinements were looked for, assuming that Zn2+ ions occupied A and B sites. The second assumption was that Co2+ ions went into both A and B sites (because of the preference position of Co2+).22 In the third assumption, we considered that Co3+ existed in the B sites because of charge valence, lattice parameter and magnetic properties. In fact, to confirm these assumptions, we calculated the mean ionic radii of A and B sites (rA and rB) for all the samples:23
 | (1) |
 | (2) |
| X | Tetrahedral sites (A) | Octahedral sites (B) |
|---|---|---|
| x = 0.0 | (Ni0.132+Fe0.723+Fe0.152+) | (Ni0.822+Ni0.053+Fe0.123+Fe1.012+) |
| x = 0.1 | (Ni0.112+Zn0.12+Fe0.613+Fe0.152+Co0.032+) | (Ni0.762+Ni0.033+Fe0.123+Fe1.012+Co0.062+Co0.013+) |
| x = 0.2 | (Ni0.12+Zn0.142+Fe0.63+Fe0.112+Co0.052+) | (Ni0.672+Ni0.033+Zn0.062+Fe0.123+Fe0.952+Co0.132+Co0.023+) |
| x = 0.3 | (Ni0.12+Zn0.22+Fe0.543+Fe0.12+Co0.062+) | (Ni0.572+Ni0.033+Zn0.12+Fe0.113+Fe0.952+Co0.212+Co0.033+) |
| x = 0.4 | (Ni0.092+Zn0.232+Fe0.53+Fe0.082+Co0.12+) | (Ni0.482+Ni0.033+Zn0.172+Fe0.113+Fe0.912+Co0.232+Co0.073+) |
| x = 0.5 | (Ni0.082+Zn0.252+Fe0.493+Fe0.052+Co0.132+) | (Ni0.392+Ni0.033+Zn0.252+Fe0.113+Fe0.852+Co0.272+Co0.13+) |
3.4. Positron annihilation lifetime spectroscopy
The positron annihilation lifetime spectra of the Ni1−xZnxFe2−xCoxO4 (x = 0.0, 0.1, 0.2, 0.3, 0.4 and 0.5) ferrites were resolved into three components τ1, τ2 and τ3 with their relative intensities I1, I2 and I3, respectively. The variation of the lifetime components and their intensities versus x are shown in Fig. 5. The smallest lifetime component (τ1) is related to the annihilation of positrons that do not get trapped by the defects within the samples and a small contribution from the result of Bloch state residence time of trapped positrons.25 Also, the parapositronium formation in the samples with lifetime 125 ps and intensity of one-third of the orthopositronium intensity I3 has a negligibly small contribution in this component.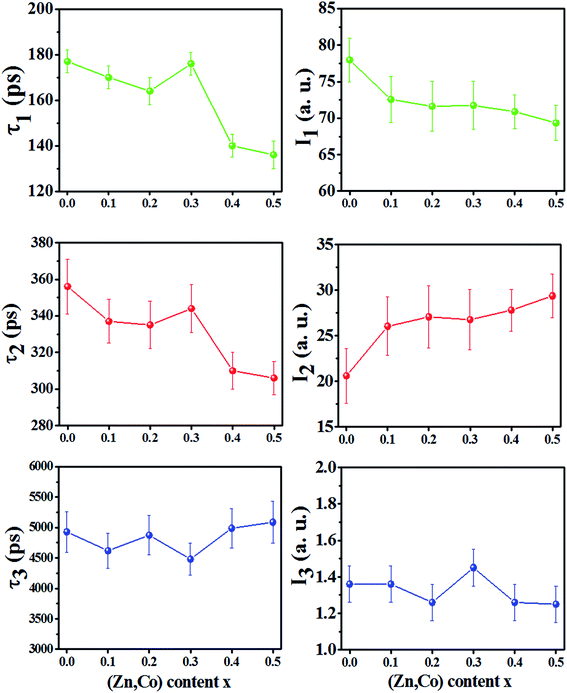 | ||
| Fig. 5 Variation of positron lifetime components and their intensities vs. x content for Ni1−xZnxFe2−xCoxO4 samples. | ||
The lifetime component τ2 is due to annihilation of positrons in vacancy type defects within the grain and the grain surface of the samples. The reported diffusion length of positrons in oxide materials is between 10–60 nm (ref. 26–28) and also diffusion length decrease with increasing in trapping site density.29,30 Therefore, since in these nanoparticles, the trapping site density (cationic vacancies of A and B sites) is high, the mean diffusion length of positrons in sample nanoparticles is a few nanometers. Consequently, we expect that more positrons annihilate in the grains of the nanoparticles. In nanoferrites, the lifetime component τ2 is mainly due to the annihilation of positrons in vacancies of the A and B sites.10,31,32 In the spinel structure, oxygen anions form octahedral (B) sites surrounded by six oxygen ions and tetrahedral (A) sites occupied by metallic cations surrounded by four oxygen ions. Therefore, the B sites have more minus charge and are bigger than the A sites. These sites can trap positrons and the lifetime of positrons in B sites is smaller than A sites. Therefore, from Fig. 5 it can be deduced that, for the x = 0.0 until x = 0.3 samples, more positrons are annihilated in the A sites, while for the x = 0.4 and 0.5 samples, more positrons are annihilated in the B sites. As it is shown in Table 1 for x = 0.0 sample, since the radius of Ni2+ (0.55 Å in A sites) and Fe2+ (0.61 Å in A sites) are bigger than the radius of A sites (0.5188 Å), some of the cations do not occupy A sites and form monovacancies in tetrahedral sites. This behavior is similar for the x = 0.1, 0.2 and 0.3 samples, a number of A sites are not occupied with cations because the cation radius is larger than the tetrahedral radius. For the x = 0.4 and 0.5 samples, the radius of the A site increased whereas the radius of the B site decreased (Table 1). Because of the larger radius of the Zn2+ and Co2+ ions in the A sites, they occupy A sites by pushing the oxygen atoms along the body diagonals of octants of the spinel structure. This causes the shrinkage of the octahedral sites and some of the metallic cations may leave B sites as monovacancies and do not occupy these sites. Therefore, the cationic vacancies decreased in A sites and increased in B sites and the cationic vacancies at the B sites became the predominant trapping centers for positrons. Since B site has more minus charge than the A site, the positron lifetime decreases. Also, the small decrease in τ2 for the x = 0.1 and 0.2 samples compared to the x = 0.0 and 0.3 can be due to the increase in the number of cationic vacancies in the B sites because of decreasing in the radius of B sites (rB).
The intensity of I2 increases with increasing in x content. This is due to the larger radius of Zn2+ and Co2+ compare to Ni2+ and Fe3+ cations. This show that the number of vacancies in the samples increases with increasing x.
The nanosecond component τ3, is indicative of the formation of orthopositronium (O-Ps) atoms in the large free volumes in the intergranular regions of the nanoparticles. O-Ps atoms in materials were annihilated through ‘‘pick-off” process and their lifetime reduced from 140 ns in vacuum to typically 1–5 ns. The variation of τ3 and its very small intensity (∼1.3%) is due to the agglomeration of nanoparticles in powder and does not reflect the effects of any change in the number of vacancies within the nanoparticles due to the x content.
The cumulative effect of all of the positron annihilations in the samples can be studied using the mean positron lifetime, τm, defined as:25,31–33
 | (3) |
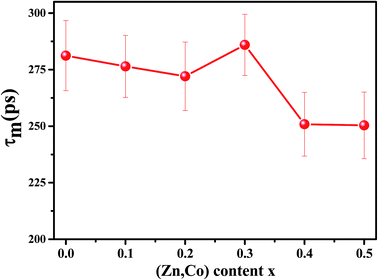
Because of a large number of counted coincidence events and the stability of the positron annihilation lifetime spectrometer, τm has a high statistical accuracy.33 The mean positron annihilation lifetime of the samples as a function of x (Zn and Co content) is shown in Fig. 6. As shown, the τm for the x = 0.0–0.3 samples is larger than for the x = 0.4 and 0.5 samples, confirming the annihilation of most of the positrons in A sites for the x = 0.0–0.3 samples and in the B sites for the x = 0.4 and x = 0.5 samples. Since A sites have smaller minus charge than B sites, the mean positron lifetime in A sites is larger than in B sites.
3.5. FTIR spectroscopy
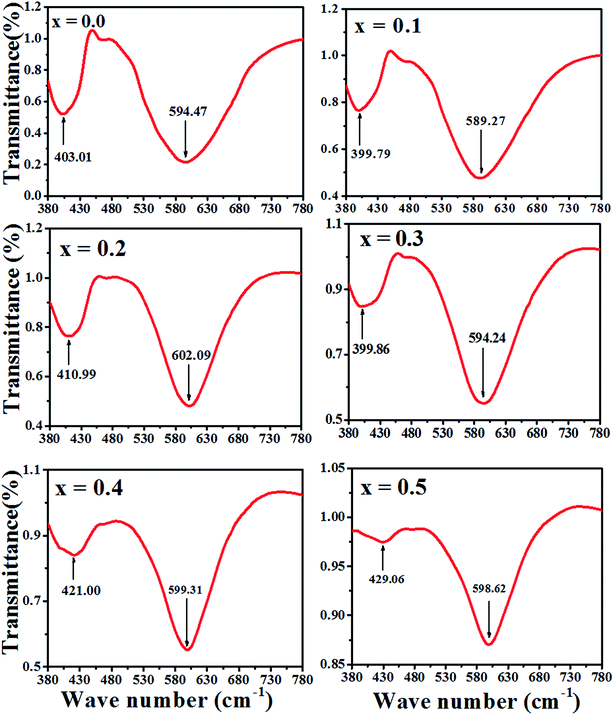
The Fourier transform infrared spectroscopy (FTIR) spectrum were recorded at 300 K in the wave number range of 380–7800 cm−1. The spectra for the samples as a function of Zn–Co substitution are shown in Fig. 7. Two main absorption bands are observed between 399–610 cm−1. The high frequency band, ν1 (590–610 cm−1) is a referenced stretching vibration of the cation–anion band in tetrahedral sites (A), while the low frequency band, ν2 (400–420 cm−1) corresponds to the stretching vibration of the cation–anion band in octahedral sites (B).34 Therefore, these two bands ν1 and ν2 confirm the formation of a spinel ferrite structure.35 The degree of covalent bonding determines the band position for the A and B sites. Actually, the Fe–O distance at the A sites is smaller than at the B sites. Therefore, covalent banding of Fe–O in A sites is stronger than B sites.36 It can be concluded that vibration stretching of tetrahedral sites occurs in higher wave number. The variation of the band position of ν1 and ν2 are shown in Fig. 7. The slight shift in the ν1 and ν2 peak position for the samples might be due to the distribution of Zn2+, Co2+ and Co3+ which replace Ni2+, Fe2+ and Fe3+ ions and to the distribution creation of vacancies in samples observed in the 'Positron annihilation lifetime spectroscopy' study. The reduction of the ν1 and ν2 depth intensities for two samples of x = 0.4 and 0.5 can be due to the increase in vacancies in these samples, as shown with I2 in Fig. 5.3.6. Magnetic properties
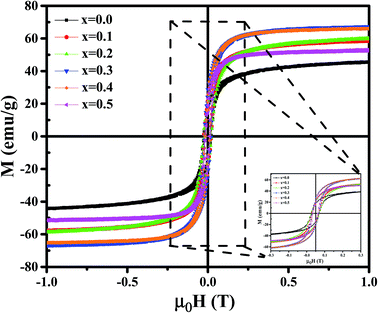
Magnetic properties of Ni1−xZnxFe2−xCoxO4 (x = 0, 0.1, 0.2, 0.3, 0.4, 0.5) ferrites were evaluated using VSM and the results of the hysteresis curves of all samples are shown in Fig. 8. From this figure, the values of saturation magnetization (Ms), remanent magnetization (Mr) and coercivity (Hc) were estimated and tabulated in Table 3. It can be seen that Ms initially increased with increasing doping level up to x = 0.4, decreasing for further content. This behavior can be explained by the cation distribution on the basis of the experimental data of magnetization and lattice parameters. The observed magnetic moment per unit formula nexpB in units of Bohr magneton was obtained from:23
 | (4) |
| X | Ms (emu g−1) | Mr (emu g−1) | Hc (T) | nexpB (μB) | ncalB (μB) | K1 (erg cm−3) ×103 | |
|---|---|---|---|---|---|---|---|
| x = 0 | 46 | 18 | 0.019 | 0.39 | 1.93 | 1.97 | 191.9 |
| x = 0.1 | 59 | 21 | 0.018 | 0.35 | 2.48 | 2.51 | 167.7 |
| x = 0.2 | 60 | 19 | 0.02 | 0.31 | 2.54 | 2.51 | 205.5 |
| x = 0.3 | 67 | 22 | 0.016 | 0.32 | 2.84 | 2.85 | 161.3 |
| x = 0.4 | 66 | 17 | 0.011 | 0.25 | 2.81 | 2.91 | 127.8 |
| x = 0.5 | 53 | 20 | 0.01 | 0.37 | 2.27 | 3.00 | 89.5 |
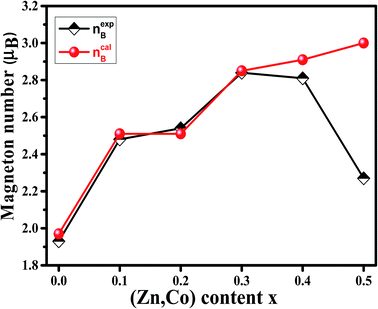 | ||
| Fig. 9 Variation of calculated (ncalB) and experimental (nexpB) magneton number of Ni1−xZnxFe2−xCoxO4 samples. | ||
For a more thorough explanation of the magnetic behavior of Zn–Co substitution in Ni ferrites, we considered separately the magnetic behavior of Ni1−xZnxFe2O4 and NiFe2−xCoxO4 samples which have been reported previously.14,15 In Ni1−xZnxFe2O4, it was observed that the saturation magnetization initially increased up to x = 0.3 and decreases for further content, which can be explained by two-Neel's sub-lattice model. Non-magnetic Zn2+ ions are occupying A sites and fractional Zn2+ ions are occupying B sites replacing Ni2+. So Fe3+ and Fe2+ migrated in both sites. Thus, the net magnetic moment increased with increasing Zn2+ due to the larger reduction in the magnetic moment of A sites compared to those of B sites.
In NiFe2−xCoxO4, VSM result demonstrated that Ms remained nearly constant with increasing Co3+ substitution. The observed slight changes in Ms might be due to the type of cation distribution, which can be explained by Co3+ occupying both A and B sites. By comparing the behavior of Ms in the two above systems, it can be concluded that the here observed behavior of the saturation magnetization in Ni1−xZnxFe2−xCoxO4 is between the two.
To justify the behavior of Ni1−xZnxFe2−xCoxO4, one should consider the cation distribution, PALS and Neel's two sub-lattice model. According to the Neel's model, the magnetic ordering in the spinel ferrites is based on the Neel's two sub-lattices (A-sites and B-sites) and the resultant magnetization is the difference between magnetization of octahedral site (B-site) and tetrahedral site (A-site), provided that they are collinear and anti-parallel to each other. For the x = 0.1, 0.2 and 0.3 samples, some cations do not occupy the A sites and therefore monovacancies could form. So, the magnetization of the A sites will be smaller than that of B sites. Also, since the Zn2+ ion has no magnetic moment, the net magnetic moment is increased with increasing Zn content due to a decrease in fraction of magnetic moment of A site and an increase in the net magnetic moment of B sites. By considering Neel's model, it can be concluded that the saturation magnetization increases until x = 0.3. After that, the net magnetic moment decreases for x = 0.4 and x = 0.5. This may be due to the weakening of A–B exchange interactions, decreasing the number of magnetic linkages occurring between tetrahedral (A) and octahedral (B) cations. In addition, it can be related to an increase in the number of cation vacancies in these two samples that, as argued in Section 3.4, are mainly distributed in the B sites.
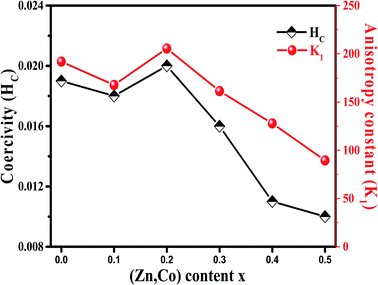
It is evident from Table 3, that the coercivity gradually decreases except for x = 0.2. To describe the process of coercivity, we use:40
 | (5) |
 (where b is due to the crystal anisotropy), Ms is the saturation magnetization (the magnetization near Ms can be written by
  ) and μ0 is the permeability of free space.22,37
Firstly, the room temperature experimental data M vs. H were fitted by equation  and the value of b and Ms were obtained and used to calculate K1. The obtained values of K1 are reported in Table 3. It is observed that the anisotropy constant decreased, which leads to the decrease in coercivity except for x = 0.2, as shown in Fig. 10. This figure shows a good agreement between the coercivity and anisotropy constant values for the Ni1−xZnxFe2−xCoxO4 samples.
The overall change (decrease with increase in x value) of the coercivity and anisotropy are similar to the overall change of the mean positron lifetime, τm. As shown in Fig. 5 and 10, the samples that have higher τm, have larger anisotropy constant. Since τm is proportional to electron density of vacancy, therefore the vacancies with less the electron density may cause larger anisotropy constant.
4. Conclusions
In this work, Ni1−xZnxFe2−xCoxO4 (x = 0, 0.1, 0.2, 0.3, 0.4, 0.5) nanoparticles ferrites were synthesized by sol–gel method using PVA as surfactant. The FESEM images showed that the particles were in the nanosize range. XRD and FTIR analysis confirmed the formation of a spinel ferrite structure and Rietveld refinements using the MAUD program based on XRD gave the cation distributions in all of the samples. The investigations of defects in the samples were carried out using positron lifetime spectroscopy. According to positron annihilation, the dominant of vacancies in x = 0.0–0.3 samples are cationic vacancies in A sites whereas for x = 0.4 and 0.5 samples, cationic vacancies in B sites are mainly predominant. Also, the number of vacancies increases with increasing x content. A good agreement is observed between nexpB and ncalB for the prepared samples. The obtained values of anisotropy constant decreased with increasing dopant content except in the x = 0.2 sample, consistent with the coercivity values. Also, the overall change of the coercivity and anisotropy are similar to the overall change of the mean positron lifetime.Acknowledgements
Two first authors acknowledge the financial support of Iran National Science Foundation: INSF (95004056).References
- R. C. Pullar, Prog. Mater. Sci., 2012, 57, 1191–1334 CrossRef CAS.
- M. Y. Nassar and M. Khatab, RSC Adv., 2016, 6, 79688–79705 RSC.
- Y. Xu, D. Sun, H. Hao, D. Gao and Y. Sun, RSC Adv., 2016, 6, 98994–99002 RSC.
- W. Hu, N. Qin, G. Wu, Y. Lin, S. Li and D. Bao, J. Am. Chem. Soc., 2012, 134, 14658–14661 CrossRef CAS PubMed.
- H. Nikmanesh, M. Moradi, G. H. Bordbar and R. S. Alam, Ceram. Int., 2016, 42, 14342–14349 CrossRef CAS.
- M. Pardavi-Horvath, J. Magn. Magn. Mater., 2000, 215, 171–183 CrossRef.
- S. Azhagushanmugam, N. Suriyanarayanan and R. Jayaprakash, Phys. Procedia, 2013, 49, 44–48 CrossRef CAS.
- K. K. Kefeni, T. A. Msagati and B. B. Mamba, Mater. Sci. Eng., B, 2017, 215, 37–55 CrossRef CAS.
- C. Chinnasamy, A. Narayanasamy, N. Ponpandian, K. Chattopadhyay, K. Shinoda, B. Jeyadevan, K. Tohji, K. Nakatsuka, T. Furubayashi and I. Nakatani, Phys. Rev. B: Condens. Matter Mater. Phys., 2001, 63, 184108 CrossRef.
- Z. Kargar, S. Asgarian and M. Mozaffari, Nucl. Instrum. Methods Phys. Res., Sect. B, 2016, 375, 71–78 CrossRef CAS.
- S. Ghosh, P. Nambissan and R. Bhattacharya, Phys. Lett. A, 2004, 325, 301–308 CrossRef CAS.
- A. Mukherjee, M. Banerjee, S. Basu, P. Nambissan and M. Pal, J. Phys. D: Appl. Phys., 2013, 46, 495309 CrossRef.
- T. Prabhakaran and J. Hemalatha, Ceram. Int., 2016, 40, 3315–3324 CrossRef.
- M. Rahimi, P. Kameli, M. Ranjbar, H. Hajihashemi and H. Salamati, J. Mater. Sci., 2013, 48, 2969–2976 CrossRef CAS.
- F. Saffari, P. Kameli, M. Rahimi, H. Ahmadvand and H. Salamati, Ceram. Int., 2015, 41, 7352–7358 CrossRef CAS.
- J. S. Ghodakea, R. C. Kambale, T. J. Shinde, P. K. Maskar and S. S. Suryavanshi, J. Magn. Magn. Mater., 2016, 401, 938–942 CrossRef.
- M. N. Akhtar, M. A. Khan, M. Ahmad, M. S. Nazir, M. Imran, A. Ali, A. Sattar and G. Murtaz, J. Magn. Magn. Mater., 2017, 421, 260–268 CrossRef CAS.
- B. P. Rao and O. F. Caltun, J. Optoelectron. Adv. Mater., 2006, 8, 995 CAS.
- C. Pascual-Izarra, A. W. Dong, S. J. Pas, A. J. Hill, B. J. Boyd and C. J. Drummond, Nucl. Instrum. Methods Phys. Res., Sect. A, 2009, 603, 456–466 CrossRef CAS.
- B. H. Toby, Powder Diffr., 2006, 21, 67–70 CrossRef CAS.
- A. S. Group, Database of Ionic Radii, 1976, http://www.abulafia.mt.ic.ac.uk/shannon/ptable.php Search PubMed.
- S. Karimi, P. Kameli, H. Ahmadvand and H. Salamati, Ceram. Int., 2016, 42, 16948–16955 CrossRef CAS.
- A. M. Wahba and M. B. Mohamed, Ceram. Int., 2014, 40, 6127–6135 CrossRef.
- R. Valenzuela, Magnetic ceramics, Cambridge University Press, vol. 4, 2005 Search PubMed.
- R. Krause-Rehberg and H. S. Leipner, Positron annihilation in semiconductors: defect studies, Springer Science & Business Media, vol. 127, 1999 Search PubMed.
- F. A. Selim, M. H. Weber, D. Solodovnikov and K. G. Lynn, Phys. Rev. Lett., 2007, 99, 085502 CrossRef CAS PubMed.
- F. A. Selim, D. Solodovnikov, M. H. Weber and K. G. Lynn, Appl. Phys. Lett., 2007, 91, 104105 CrossRef.
- G. Yuan, C. Li, J. Yin, Z. Liu, D. Wu and A. Uedono, J. Phys. D: Appl. Phys., 2012, 45, 445305 CrossRef.
- C. Hiibner, T. Staab and R. Krause-Rehberg, Appl. Phys. A: Mater. Sci. Process., 1995, 61, 203–206 CrossRef.
- P. J. Schultz and K. G. Lynn, Rev. Mod. Phys., 1988, 60, 701 CrossRef CAS.
- P. Nambissan, C. Upadhyay and H. Verma, J. Appl. Phys., 2003, 93, 6320–6326 CrossRef CAS.
- S. Chakraverty, S. Mitra, K. Mandal, P. Nambissan and S. Chattopadhyay, Phys. Rev. B: Condens. Matter Mater. Phys., 2005, 71, 024115 CrossRef.
- F. Tuomisto and I. Makkonen, Rev. Mod. Phys., 2013, 85, 1583 CrossRef CAS.
- Y. Mohammadifar, H. Shokrollahi, Z. Karimi and L. Karimi, J. Magn. Magn. Mater., 2014, 366, 44–49 CrossRef CAS.
- A. Pradeep, P. Priyadharsini and G. Chandrasekaran, J. Magn. Magn. Mater., 2008, 320, 2774–2779 CrossRef CAS.
- B. Evans and S. Hafner, J. Phys. Chem. Solids, 1968, 29, 1573–1588 CrossRef CAS.
- D. Neupane Dipesh, L. Wang, H. Adhikari, J. Alam and S. R. Mishra, J. Alloys Compd., 2016, 688, 413–421 CrossRef.
- G. Tang, D. Ji, Y. Yao, S. Liu, Z. Li, W. Qi, Q. J. Han, X. Hou and D. L. Houless, Appl. Phys. Lett., 2011, 98, 072511 CrossRef.
- D. Mane, U. Devatwal and K. Jadhav, Mater. Lett., 2000, 44, 91–95 CrossRef CAS.
- M. Gabal, S. Kosa and T. Almutairi, J. Magn. Magn. Mater., 2014, 356, 37–41 CrossRef CAS.
| This journal is © The Royal Society of Chemistry 2017 |

