
 Open Access Article
 This Open Access Article is licensed under a Creative Commons Attribution-Non Commercial 3.0 Unported Licence
Non-contact Mn1−xNixFe2O4 ferrite nano-heaters for biological applications – heat energy generated by NIR irradiation
Robert Pązik *ab,
Emilia Zachanowiczc,
Błażej Pożniakd,
Małgorzata Małeckaa,
Aleksander Zięcinaa and
Łukasz Marciniaka
*ab,
Emilia Zachanowiczc,
Błażej Pożniakd,
Małgorzata Małeckaa,
Aleksander Zięcinaa and
Łukasz Marciniaka
aInstitute of Low Temperature and Structure Research, PAS, Okólna 2, 50-422 Wrocław, Poland. E-mail: R.Pazik@int.pan.wroc.pl; Web: http://www.int.pan.wroc.pl Fax: +48-71-344-10-29; Tel: +48-71-3954-190
bMedicinal Chemistry Department, Institute of Biotechnology, University of Rzeszow, Pigonia 1, 35-959 Rzeszow, Poland
cPolymer Engineering and Technology Division, Wroclaw University of Technology, 50-370 Wrocław, Poland
dDepartment of Pharmacology and Toxicology, Faculty of Veterinary Medicine, Wrocław University of Environmental and Life Sciences, Ul. Norwida 25, 50-375 Wrocław, Poland
First published on 24th March 2017
Abstract
Mn1−xNixFe2O4 nanoparticles with primary particle size of 6 nm ± 4 nm were synthesized using fast and effective microwave stimulated technique without addition of surfactants or other specific agents to open more flexible post-surface modification potential. Structural, chemical and morphological characterization were performed using XRD, SEM-EDS and TEM techniques. DLS and absorption measurements were performed in order to evaluate hydrodynamic size of particles/objects and nanoparticles dispersion stability upon addition of stabilizing agents in water. The J774.E murine macrophage and U2OS human osteosarcoma cells exposed to particle dispersions revealed high loading of macrophages and moderate loading of osteosarcoma cells. Difference was ascribed to phagocytic activity of macrophages and their explicit role in elimination of particulate matter under in vivo conditions. It was shown that the effective heat generation can be achieved with Mn1−xNixFe2O4 magnetic ferrites by using NIR light irradiation instead of AC magnetic field reaching temperatures suitable for application in hyperthermia-based therapies.
1. Introduction
For more than thirty years ferrite nanoparticles have attracted considerable attention due to their outstanding magnetic properties and high prospect in biomedical applications such as magnetic drug delivery, magnetic resonance imaging, magnetic separation or hyperthermia.1–5 There are thousands of publications devoted to the most representative and incredibly popular Fe3O4 nanoparticles. On the other hand, rather less efforts are directed towards the MnFe2O4 nanoparticles substituted with Ni2+ ions. However number of articles is constantly increasing due to fact that MnFe2O4 is more chemically stable (lack of Fenton reaction leading to cytotoxicity) and has better or comparable magnetic properties.6–10 What makes these materials interesting is that the MnFe2O4 is a typical normal spinel whereas NiFe2O4 shows relatively high cationic disorder (inverted spinel). In fact, substitution of Mn2+ with Ni2+ leads to the compositional and structural dependent magnetic properties like for instance in the case of Co1−xMnxFe2O4 ferrites.11,12Development of new non-contact nano-heaters, especially for the heat-triggered drug release or hyperthermia, is of great importance especially for theranostics. However, several challenges were identified like proper control over particle size distribution, morphology, surface modification, biocompatibility, stability in biological media, controlling target temperature, safe dosage and other factors.13 Usually heating of magnetic nanoparticles is realized by taking advantage of their magnetic properties. By using alternating magnetic field nanoparticles heat inductively due to the magnetic and residual losses (Neel, Brownian relaxations) upon magnetization–demagnetization cycles.4 In one study, it was shown that in order to destroy completely cancer tumor the action of elevated temperature (42–50 °C) must be sustained for minimum 30 minutes.14
Alternative way of heat energy generation, in the nanoparticle systems, relies on non-contact, direct sample irradiation with light using different wavelengths within the so called biological optical window (650–1350 nm) being harmless for the illuminated tissues.15–17 Moreover, the effect of light to heat conversion might be used not only for ablation of tumors but also, materials showing this functionality might act as agents for heat triggered drug delivery as well.18 Last four years brought into the light several scientific reports showing huge prospects of utilizing magnetic iron oxide nanoparticles for photothermal therapies19–24 by stimulation with NIR irradiation as well as Espinosa et al. proposed to take advantage out of synergistic effect of both magnetic and NIR light to heat conversion realized simultaneously.21 Except idea of using magnetic nanoparticles it was shown that the same effect can be achieved on multi walled carbon nanotubes in the first (650–950 nm) and second (1000–1350 nm) biological windows25 as well as metallic nanoparticles or quantum dots.17,26
In this paper, we report on attractive possibility of heat energy generation in Mn1−xNixFe2O4 by direct NIR irradiation performed on dry nanopowders and their dispersions without using alternating magnetic field. In our previous studies we have observed the chemical transformation of the Fe3O4 into α-Fe2O3 and strong temperature effects during micro-Raman measurements when MFe2O4 nanoparticles were exposed to the NIR irradiation.27 Already, several very interesting papers devoted to the MnFe2O4 nanoferrites for application in hyperthermia induced by AC magnetic field can be found.13,28,29 However, there is no single scientific report on inducing heat energy in Ni2+ substituted nanoparticles of the Mn1−xNixFe2O4 using NIR irradiation. Since the dispersions of nanoparticles were prepared in water, the 808 nm diode was used as the excitation source (instead of 975 nm). Comparing to the latter wavelength (commonly used in nanoparticles co-doped with lanthanides ions like Yb3+–Er3+) the 808 nm is 25 times less absorbed by water. Therefore, possibility of overheating the healthy cells exposed to this wavelength is strongly reduced. Few important aspects of the cytotoxic effects of nanoparticles were discussed on standard J774.E murine macrophages and U2OS human osteosarcoma cell lines as well.
2. Experimental section
2.1. Apparatus
X-ray powder diffraction (XRD) measurements were performed using X'Pert PRO X-ray diffractometer (Cu, Kα1: 1.54060 Å) (PANalytical). Transmission electron microscopy (TEM) and selective area electron diffraction were carried out using Philips CM-20 Super Twin microscope, operated at 200 kV. Preparation of the samples involved deposition of ethanol/water nanoparticle colloid droplet on the carbon covered copper microscope grid and drying under IR lamp. Mean particle size determination was performed using volume-weighted equation:
 | (1) |
2.2. Synthesis of Mn1−xNixFe2O4 nanoparticles
The Mn1−xNixFe2O4 nanoparticles were synthesized using well described in the literature non-hydrolytic approach with microwave stimulation as a driving force of the chemical reaction.12,27,30 The x value represents molar content of Ni2+ substitution and was chosen to be 0.2, 0.5 as well as 0.8, respectively. Described preparation procedure is based on example of the 0.5 g final product fabrication with use of following substrates: Mn(acac)2 (99%, Alfa Aesar), Ni(acac)2 (99%, Alfa Aesar), as well as Fe(acac)3 (99%, Alfa Aesar). Acac abbreviation refers to the acetylacetonate ligand. Therefore, for preparation of the nanoparticles with given composition Mn0.5Ni0.5Fe2O4 0.28638 g Mn(acac)2, 0.2906 g of Ni(acac)2, and 1.56515 g Fe(acac)3, were taken respectively. Metal complexes were transferred to 70 ml of acetophenone (99%, Sigma Aldrich, without further purification) immediately forming an intense red solution and subsequently moved to the PTFE (polytetrafluoroethylene) container which was placed in the Ertec® Magnum V2 microwave reactor. The total reaction time was 90 min at 250 °C and 35 atm. As a product, dark brown suspension containing nanoparticles was obtained. The Mn0.5Ni0.5Fe2O4 was washed with ethanol (96%, Avantor Performance Materials) using laboratory centrifuge (10![[thin space (1/6-em)]](https://www.rsc.org/images/entities/char_2009.gif) 000 rpm, 10 min) until the characteristic acetophenone odour was no longer detectable (usually no less than six times). After removing the mother solution nanoparticles were transferred to ethanol–water mixture (90:10). The batch was divided in two pieces, one part was dried in laboratory drier for XRD, TEM, and SEM-EDS analysis, second part of the colloid was used to perform dispersion stability and cytotoxicity assessments as well as heat energy conversion measurements. Description of the nanoparticle suspensions treatment for biological tests was described in detail, in referring paragraph.
000 rpm, 10 min) until the characteristic acetophenone odour was no longer detectable (usually no less than six times). After removing the mother solution nanoparticles were transferred to ethanol–water mixture (90:10). The batch was divided in two pieces, one part was dried in laboratory drier for XRD, TEM, and SEM-EDS analysis, second part of the colloid was used to perform dispersion stability and cytotoxicity assessments as well as heat energy conversion measurements. Description of the nanoparticle suspensions treatment for biological tests was described in detail, in referring paragraph.
2.3. Cytotoxicity assessment of MnxNi1−xFe2O4 nanoparticles in J774.E murine macrophages and U2OS human osteosarcoma cell line – materials and methods
Cytotoxicity assessment was carried out on murine macrophage (J774.E) and human osteosarcoma (U2OS) cell lines. Both cell lines were obtained from certified providers: U2OS line was obtained from ATCC (Manassas, Va, USA) and J774.E line was obtained from the Institute of Immunology and Experimental Therapy, Polish Academy of Sciences (Wrocław, Poland). The choice of the in vitro model was based on the fact that under in vivo conditions, macrophages form the primary line of response to particulate matter. Thus, they are responsible for the distribution and clearance of nanoparticles and their agglomerates. On the other hand, U2OS is a line derived from human case of osteosarcoma. This type of cancer belongs to one of the most aggressive neoplastic diseases and, apart from surgical treatment, often requires systemic chemotherapy and irradiation. Due to this feature, it seems to be a proper model for testing novel theranostic approaches for systemic use. Cells were cultured in RPMI-1640 medium (Institute of Immunology and Experimental Therapy, Wrocław, Poland) supplemented with 10% fetal bovine serum (FBS, Sigma, USA), L-glutamine (Sigma, UK) and antibiotics (penicillin and streptomycin, Sigma, Germany). For the cytotoxicity assessment, cells were seeded in 96-well-plates (NUNC, Denmark) at a density of 10 × 103 (J774.E) or 3 × 10³ (U2OS) cells per well and pre-incubated at 37 °C for 24 h in a humidified atmosphere of 5% CO2. After that, nanoparticle dispersions were added. Highly stabile concentrated stock dispersions of nanoparticles were prepared and further diluted in ethanol. Dispersions in complete culture medium were prepared by adding an appropriate volume of a given dilution to provide constant (non-cytotoxic) exposure to the diluent. Cells were exposed to the nanoparticle dispersions for 24 h (5% CO2, 37 °C). Control cells were exposed to the supernatant of the highest particle concentration subjected to ultracentrifugation for 3 h. This step was undertaken to exclude possible toxic effects of potential soluble compound e.g. released ions, contaminants. No such effect was observed. After 24 h, the MTT assay was carried out. The test is based on the enzymatic reduction of the tetrazolium salt MTT [3-(4,5-dimethylthiazol-2-yl)-2,5-diphenyl-tetrazoliumbromide] in living, metabolically active cells. Preliminary experiment showed no interference of nanoparticles with either MTT or formazan in a cell-free system. After 2 h of incubation, cells were lysed and left for complete dissolution of purple-colored metabolite. After 24 h, the optical density (OD) was measured by means of a microplate reader (ELx800, BioTek, USA) at the wavelength of 570 nm. The OD of control cells was taken as 100%. The results were obtained from at least 3 independent experiments.3. Results and discussion
3.1. Structure, morphology and Mn1−xNixFe2O4 nanoparticles dispersion stability
Based on the XRD results (Fig. 1), one can note that the crystal structure of all samples corresponds well with the reference standard describing the MnFe2O4 cubic Fd![[3 with combining macron]](https://www.rsc.org/images/entities/char_0033_0304.gif) m crystallographic system (ICSD card no. 24497). Moreover continues shift of the [3 1 1] plane towards higher 2Θ angles was observed as an effect of the cell parameters change induced by the substitution of the bigger Mn2+ (0.66 Å at C.N. 4) cation by smaller one Ni2+ (0.55 Å), respectively.31
m crystallographic system (ICSD card no. 24497). Moreover continues shift of the [3 1 1] plane towards higher 2Θ angles was observed as an effect of the cell parameters change induced by the substitution of the bigger Mn2+ (0.66 Å at C.N. 4) cation by smaller one Ni2+ (0.55 Å), respectively.31
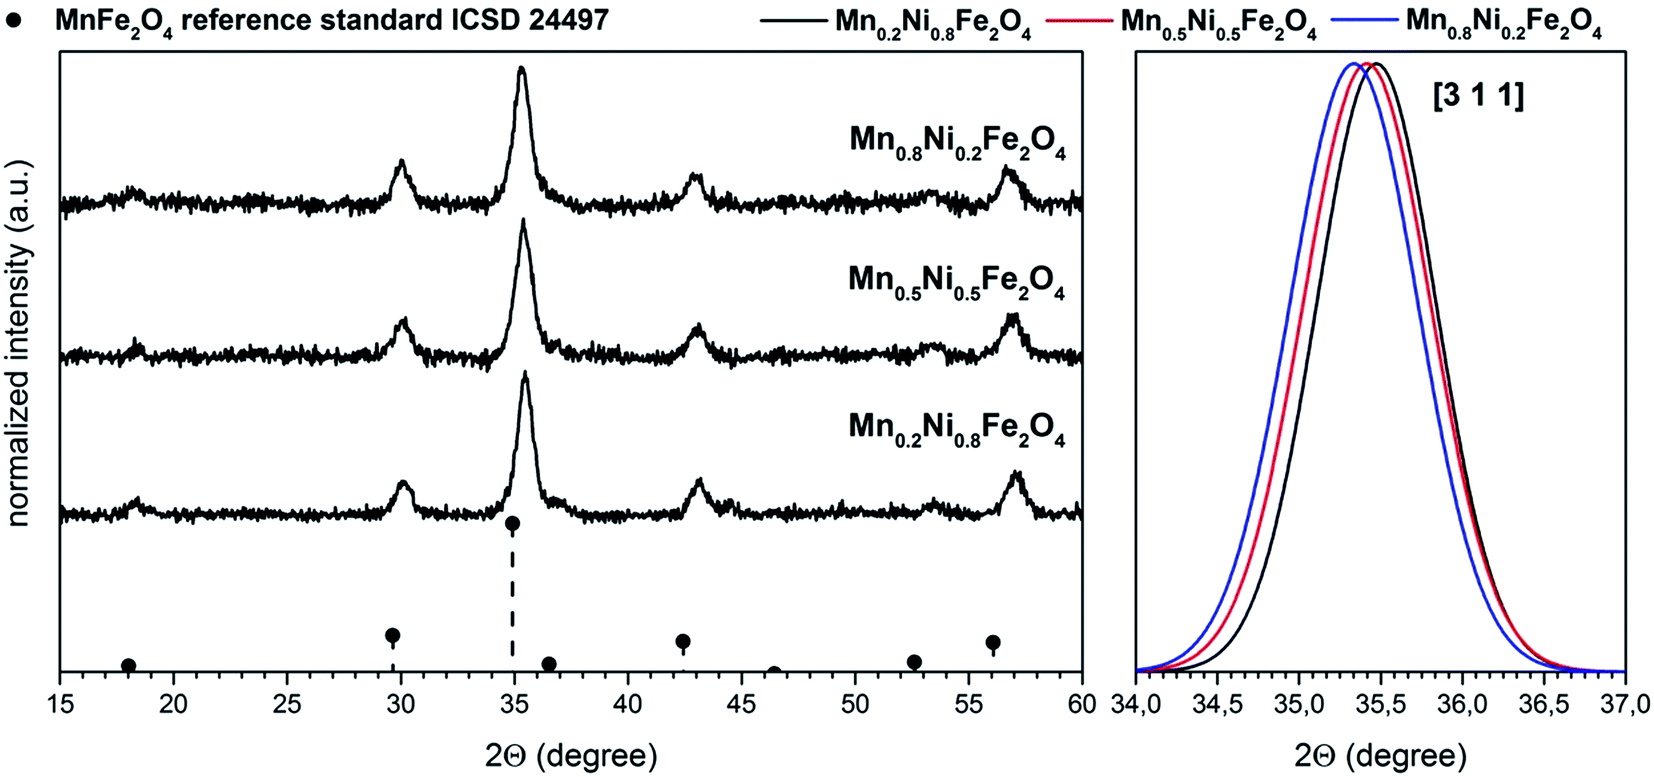 | ||
| Fig. 1 XRD patterns of the Mn1−xNixFe2O4 nanoparticles together with (3 1 1) plane shift induced by Ni2+ doping. | ||
SEM-EDS elemental analysis (Fig. 2) confirmed a desired chemical composition of all nanoparticles within tested Ni2+ concentration range. This approach can be further easily adopted for the synthesis of other ferrites with great flexibility in chemical compositions12,27,30,32 as well as extended for different types of mixed metal oxides.33–36 Representative TEM image (Fig. 3) gave a direct confirmation of the presence of small and spherical nanoparticles with primary size of 6 nm ± 4 nm (primary particle size refers to the size related to dry powders) with relatively low agglomeration degree. SAED picture shows typical electron diffraction image characteristic for ferrite family providing additional confirmation of structural purity.
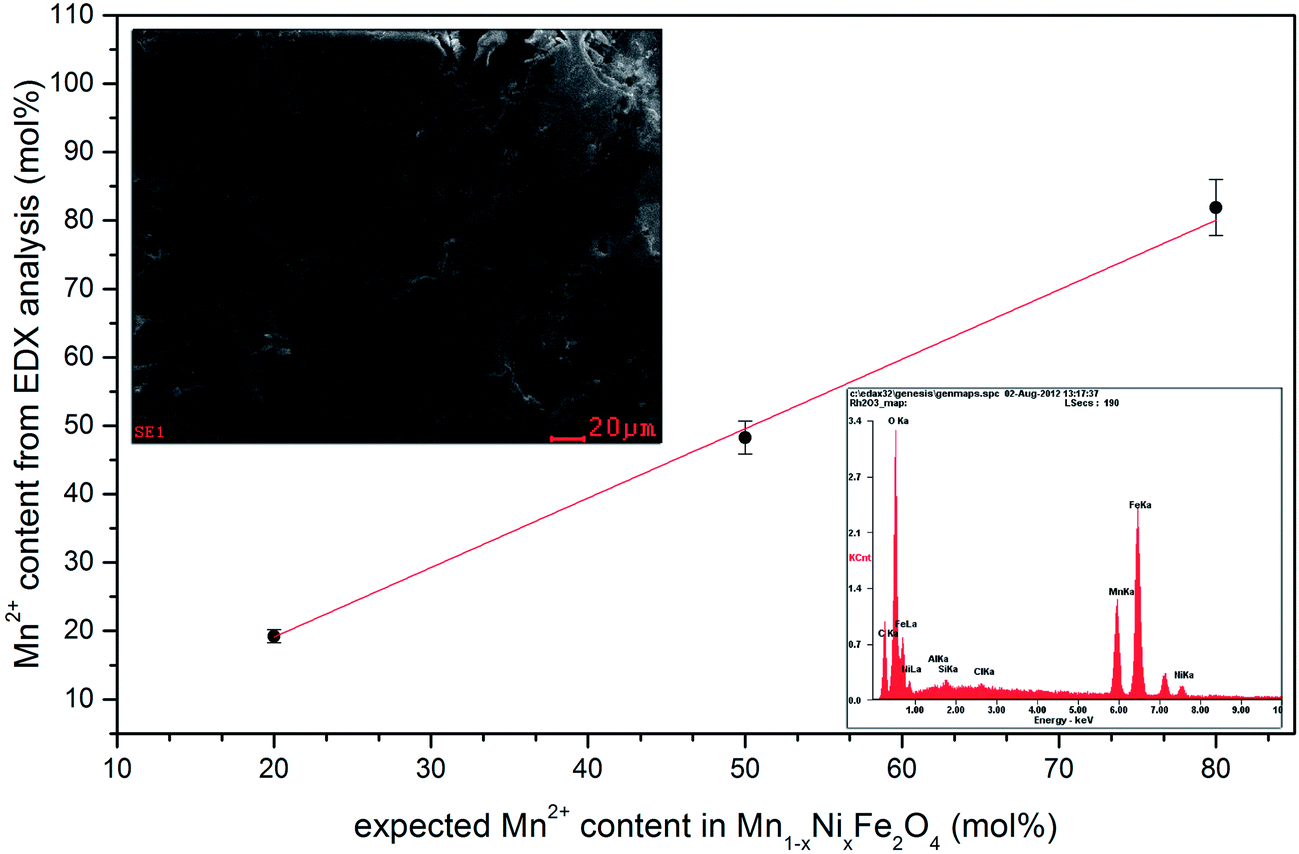 | ||
| Fig. 2 SEM-EDS analysis of the Mn1−xNixFe2O4 nanoparticles. | ||
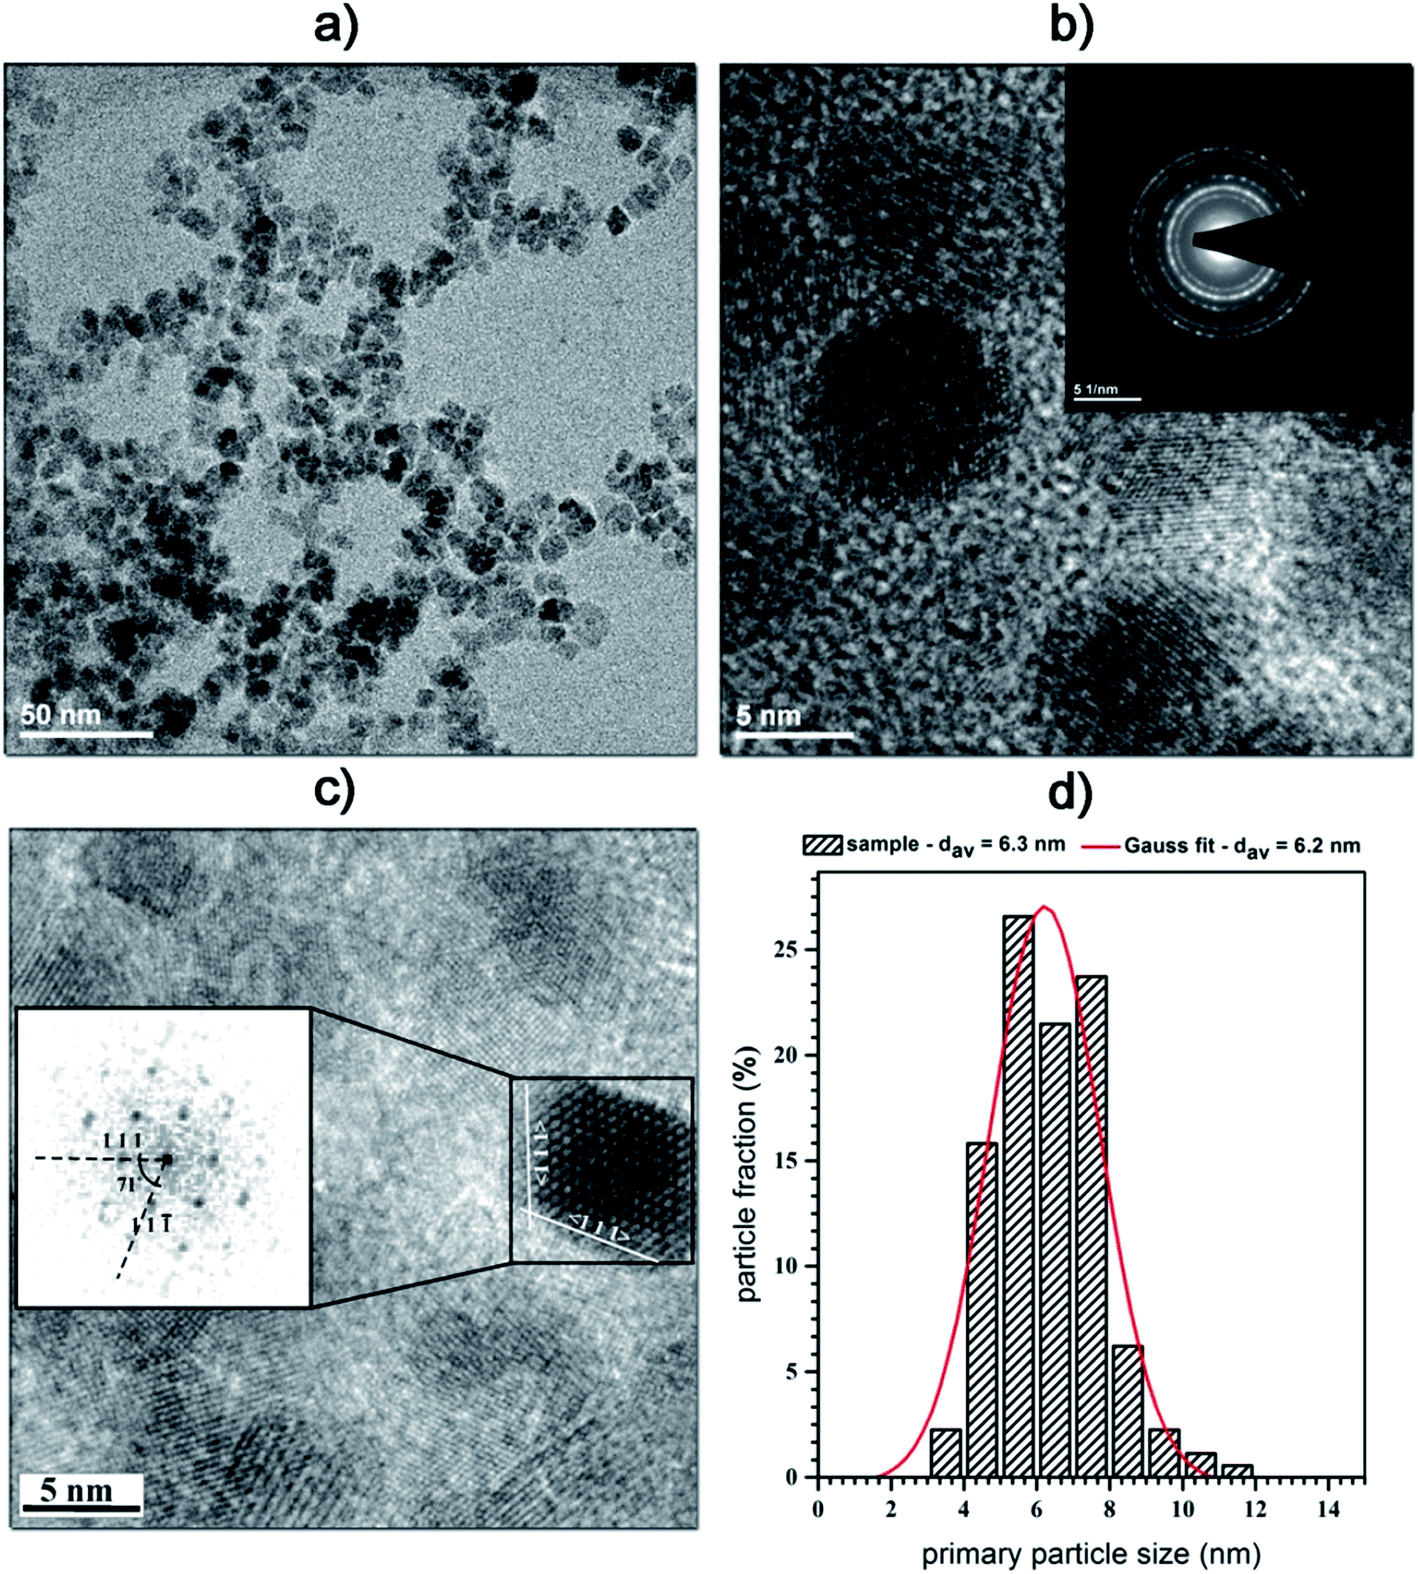 | ||
| Fig. 3 Representative TEM and SAED images of the Mn0.8Ni0.2Fe2O4 nanoparticles and its particle size distribution. | ||
DLS technique (both instruments Zetasizer and NS 500) was utilized to give a quick answer on the non-modified nanoparticle state in the water dispersion since the main focus was placed on application of such objects in the heat energy transfer bio-applications. Both instruments shown the same results implying that, independent of the chemical composition, the hydrodynamic size was around 90 nm in all cases with low polydispersity index (PDI). The main difference between particle size estimated from TEM and DLS can be related directly to the action of water promoting agglomeration process as well as so-called formation of particle clusters (magnetic clustering) since fabricated nanoparticles were not treated with any special surface modifying agents (surfactants).
The time dependent absorption spectra were performed in order to test the effect of additives (water, RPMI buffer, cell medium, phosphocreatine (PCr), adenosine-tri-phosphate (ATP) as well as bovine serum albumin (BSA)) on the stability of nanoparticle dispersions. We assumed that at time zero, the absorbance of nanoparticles in water dispersions at 390 nm has a maximum value (100%). Therefore, the measurements were conducted over 6 hours, at predefined time points. Time-dependent changes in absorbance were directly related to the amount of absorbers remaining in the dispersion. Afterwards the stability curves were re-constructed (Fig. 4). One can note that BSA together with PCr provided the best conditions for particle stabilization, almost the same effect was observed for the cell medium (no surprise since it contains relevant proteins) whereas RPMI buffer and ATP both had detrimental effect on nanoparticle stability. Both RPMI and ATP, due to their destabilizing effect on nanoparticles, can be used also for particle separation from the solution if necessary. This simple technique can be extremely helpful in fast estimation of the possible stabilizing/destabilizing behavior of different substances, electrolytes and etc. What is worth mentioning is that the nanoparticles dispersed only in water shown rather good stability over studied period of time.
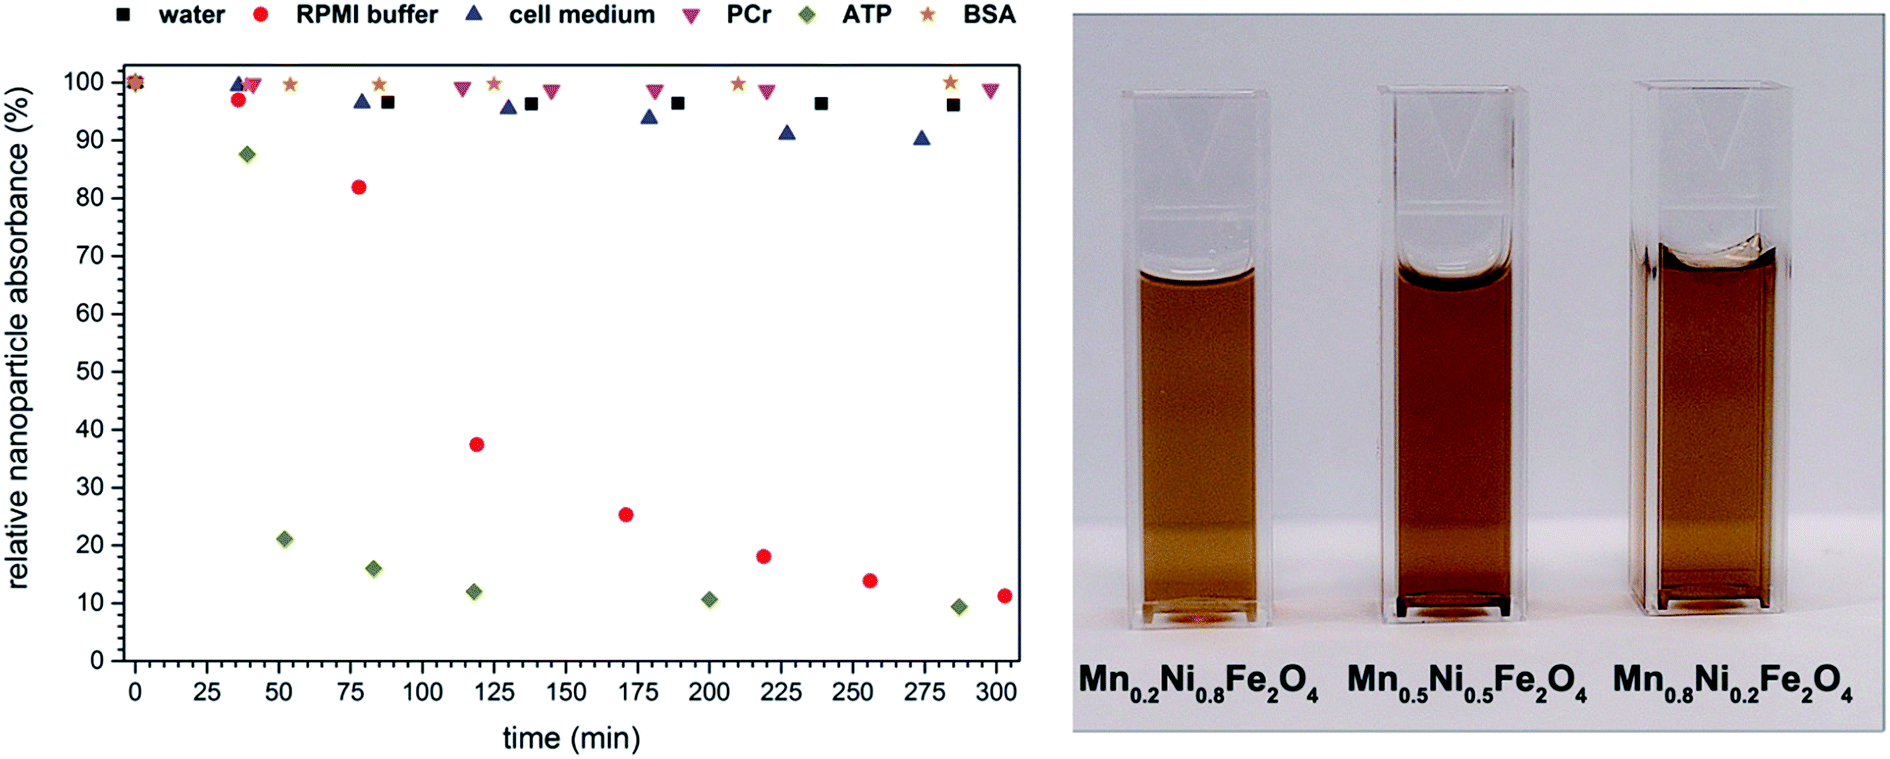 | ||
| Fig. 4 Time dependence of nanoparticles dispersions absorbance effect of different stabilizing agents. | ||
3.2. In vitro assessment of Mn1−xNixFe2O4 nanoparticles cytotoxicity to J774.E murine macrophages and U2OS human osteosarcoma cells
Since in the scientific literature controversies exist regarding the use of colorimetric assays for nanoparticle cytotoxicity studies, in our previous papers we have described the use of trypan blue exclusion assay (TBEA) as a non-colorimetric method to determine particle toxicity. Although useful, this method is rather labor-intensive and problematic with higher number of different materials to assess. The major problem with the use of colorimetric assays (like MTT) in nanoparticle cytotoxicity assessment is the intensive color of many such materials (including ferrites) at higher concentrations and possible interactions with the dyes. Thus, in this studies the maximum concentration applied (10 μg ml−1) was chosen based on the lack of interaction with the MTT assay and inhibitory concentrations known from studies on related materials.12 Comparison of particle cytotoxicity in two cell lines is visualized in Fig. 5.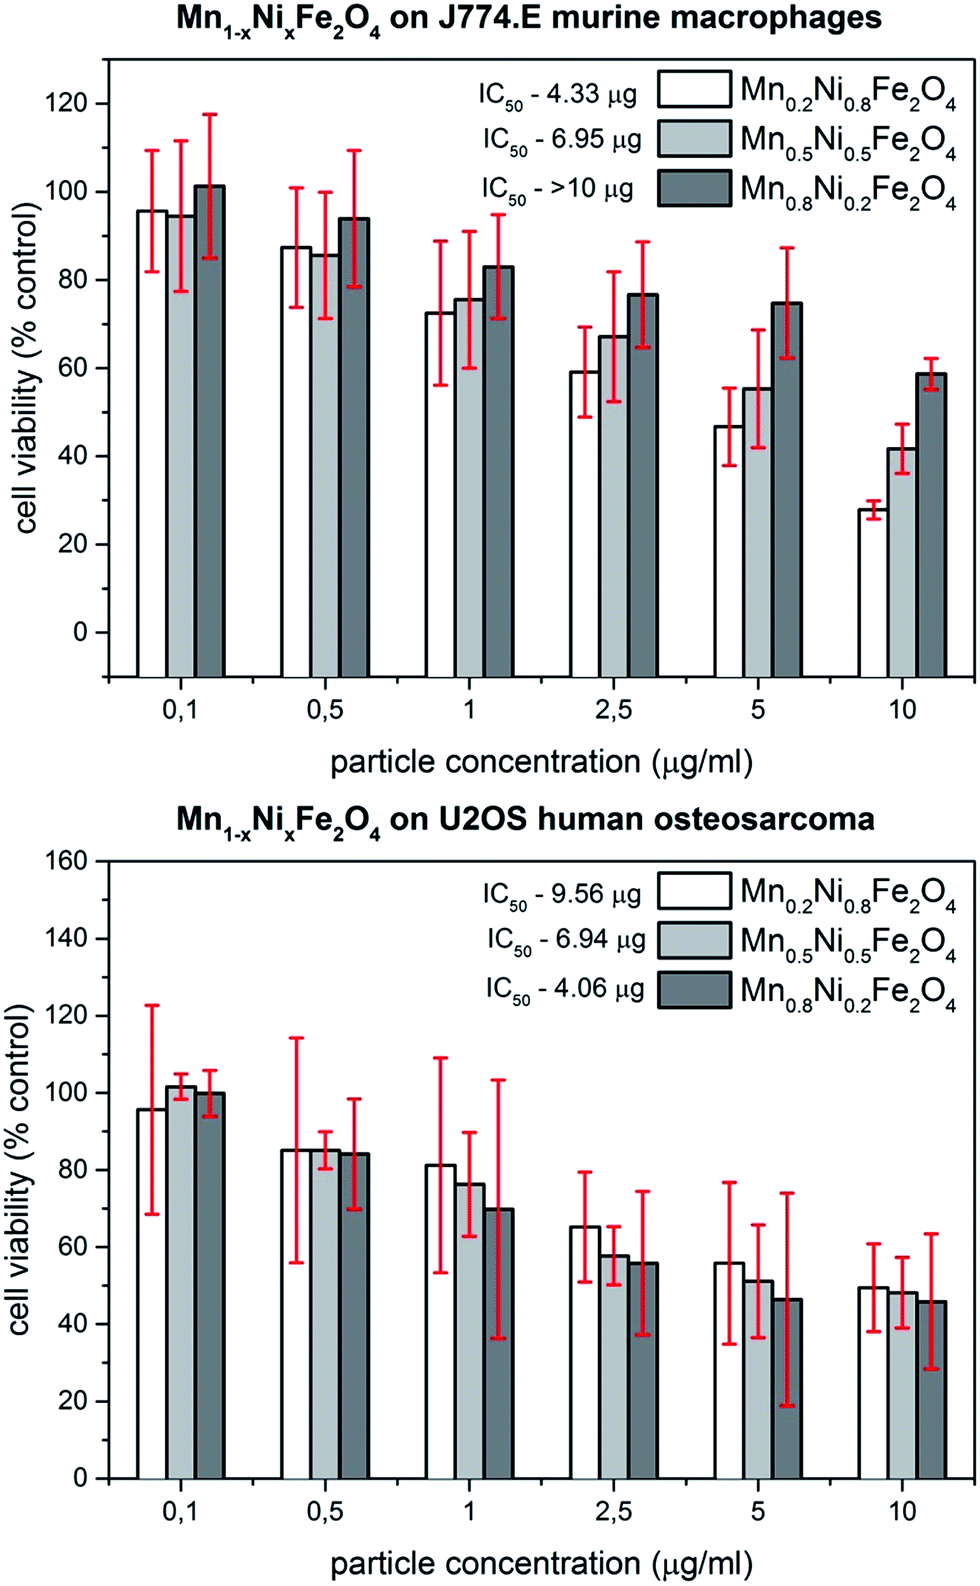 | ||
| Fig. 5 Viability of J774.E and U2OS cell lines exposed to Mn0.2Ni0.8Fe2O4; Mn0.5Ni0.5Fe2O4 and Mn0.8Ni0.2Fe2O4 nanoparticles for 48 h as determined by MTT assay. | ||
In case of macrophages, an interesting tendency was observed. The lower the concentration of manganese in the particle, the higher the cytotoxicity of the material. This can be seen in the values of the particle concentration that decreases cell viability by 50% (IC50). For J774.E cells, the IC50 values are 4.33; 6.95 and >10 μg ml−1 for Mn0.2Ni0.8Fe2O4; Mn0.5Ni0.5Fe2O4 and Mn0.8Ni0.2Fe2O4, respectively. Surprisingly, this effect was not seen in U2OS cells where the curve of inhibition looks more uniform. The IC50 values for these cells are 9.57; 6.94 and 4.06 μg ml−1 for Mn0.2Ni0.8Fe2O4; Mn0.5Ni0.5Fe2O4 and Mn0.8Ni0.2Fe2O4, respectively. In general, both cell types seem to exhibit detrimental effects when exposed to the studied nanoparticles. In our previous study on Co1−xMnxFe2O4 ferrite nanoparticle cytotoxicity in the same set of cell lines a more differentiated response was observed.12
While macrophages have shown concentration-dependent loss of viability, osteosarcoma cells seemed not to be lethally affected. The difference between these studies may be associated with the applied assay. Since TBEA measures the number of living cells and MTT test measures the metabolic activity of cells, the resulting two parameters may be different for the same exposure. In such case, MTT assay may allow for the detection of sub-lethal derangements in cell physiology producing lower IC50 values compared to TBEA. Similar to our previous study, visual inspection of cells exposed to particle dispersions revealed high loading of macrophages and low to moderate loading of osteosarcoma cells (Fig. 6). This difference is related to phagocytic activity of macrophages and their natural role in elimination of particulate matter under in vivo conditions. Since the Mn0.8Ni0.2Fe2O4 nanoparticles shown the lowest cytotoxic effects this sample was chosen for further characterization of light to heat conversion.
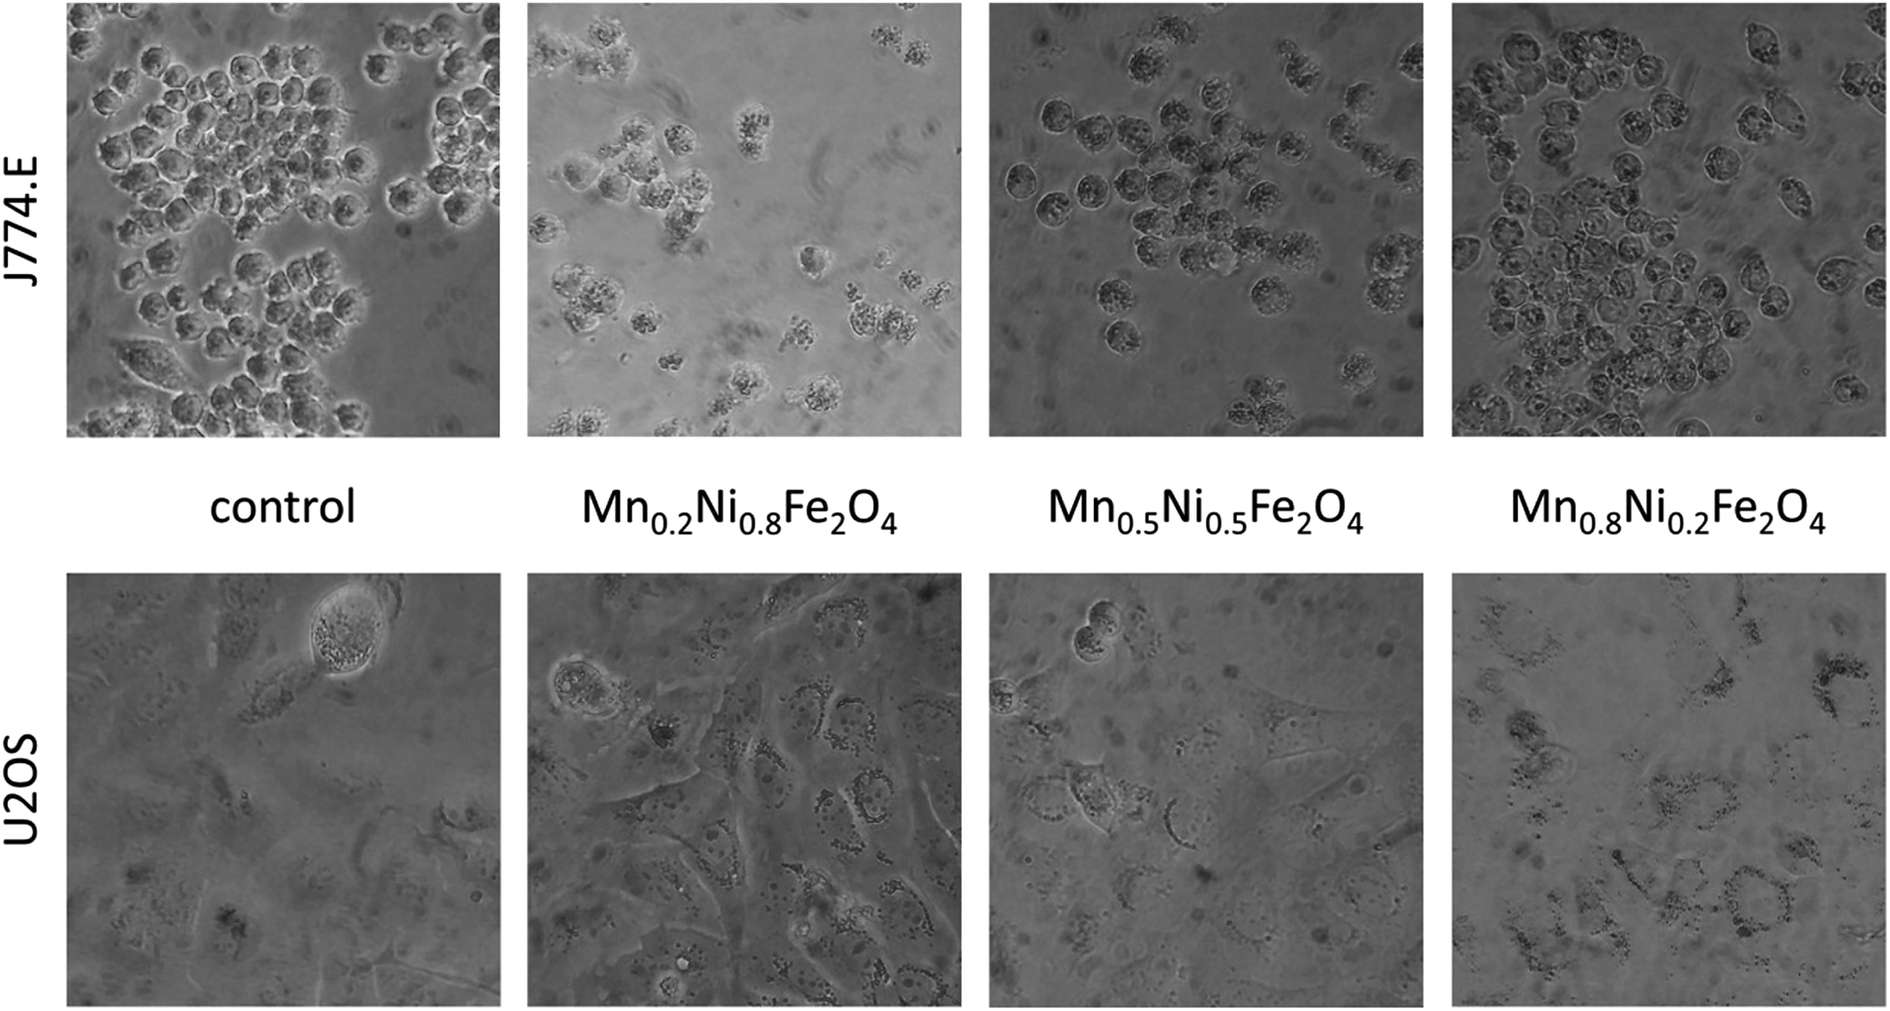 | ||
| Fig. 6 Cell morphology in control (leftmost panels) and exposed cells of J774.E and U2OS cell lines (concentration of 10 μg ml−1, magnification: 400×). Brown granules of internalized agglomerates are particularly visible in J774.E macrophages. | ||
3.3. Conversion of NIR light to heat energy
Light to heat conversion results on dispersions of nanoparticles containing different concentrations of magnetic material (0.3 up to 3 mg ml−1) were plotted in Fig. 7 as a function of laser power density and exposure time. For comparison, test of heat generation on dry powders was performed as well (see inset in Fig. 7). However, due to the extremely rapid heating of dried nanoparticles, it was impossible to measure temperature time dependence with the applied measuring system.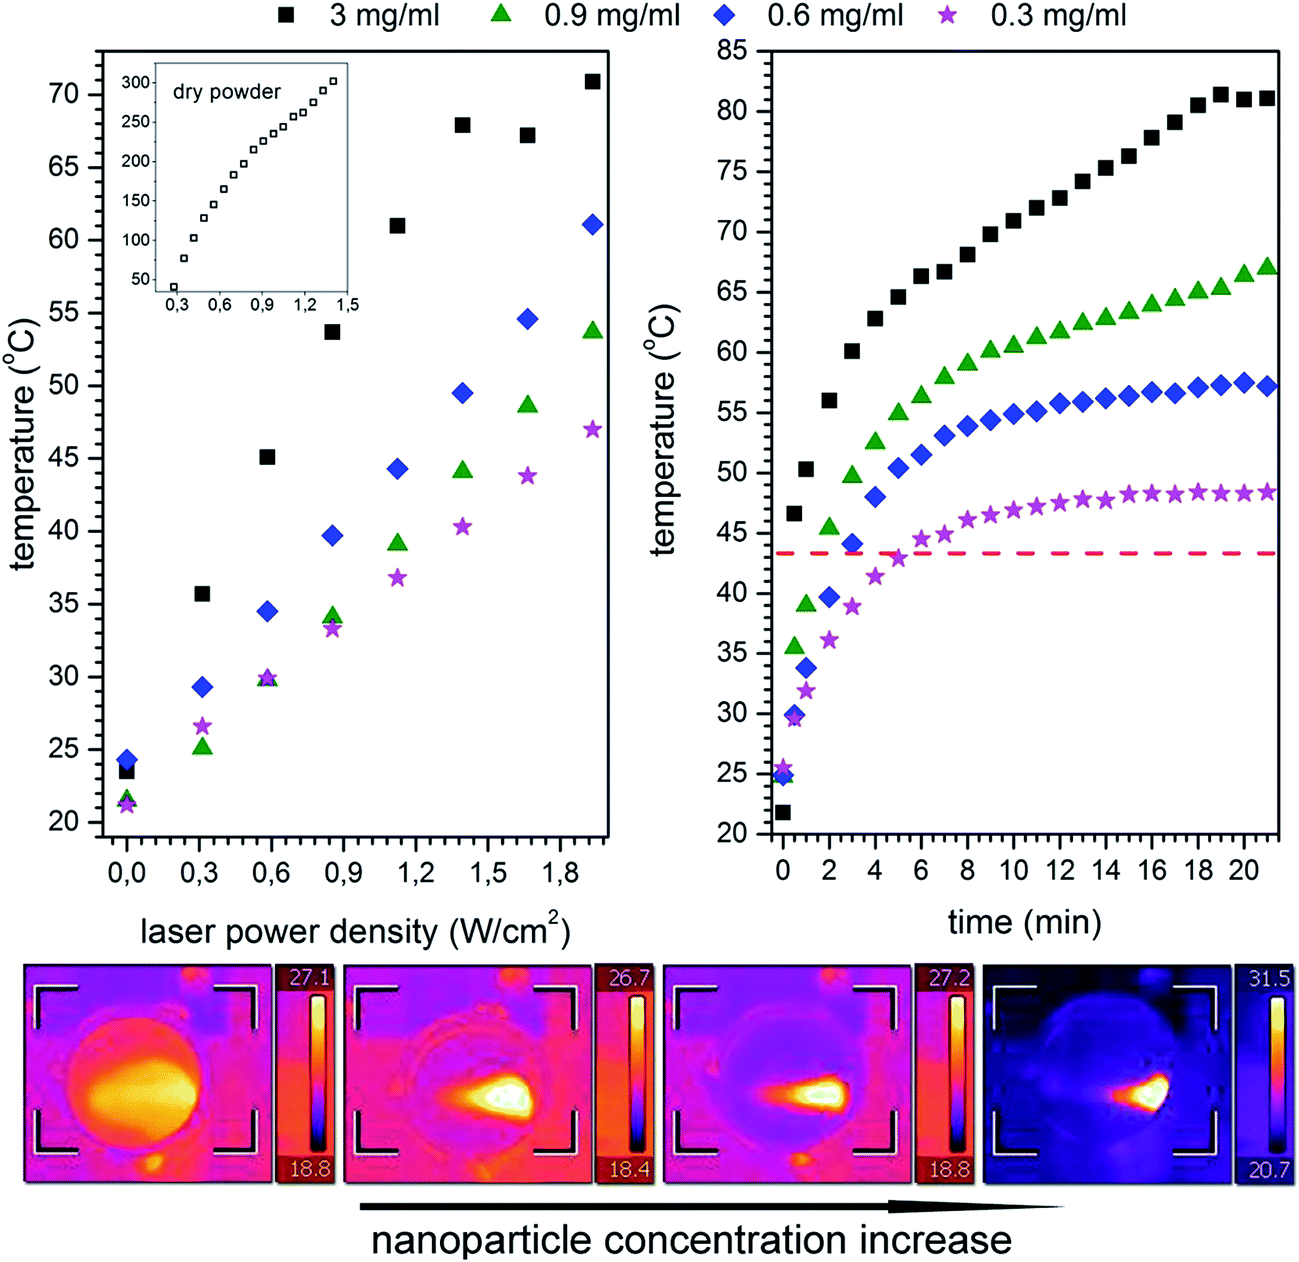 | ||
| Fig. 7 Laser power dependence on nanoparticles dispersion temperature (left) as well as evolution of the sample temperature over time (right). Inset in left figure shows results achieved for dry powder. Bottom images show concentration effect on dispersion heating ability after 60 s. | ||
The maximum temperature achieved on dry powders in this study was 300 °C at laser power of 1.5 W cm−2. The heating capacity of the Mn1−xNixFe2O4 was calculated by the specific absorption rate for the nanoparticle dispersions defined as follows:
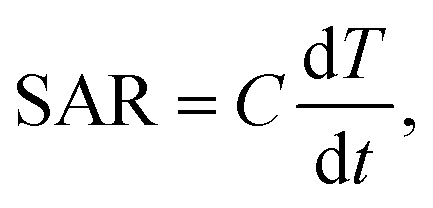 | (2) |
| C = (WnanoparticleCnanoparticle + WwaterCwater)/(Wnanoparticle + Wwater), | (3) |
| Particle concentration (mg ml−1) | dT/dt (°C s−1) | SAR (W g−1) |
|---|---|---|
| 3 | 28.5 | 119.35 |
| 0.9 | 14.2 | 59.44 |
| 0.6 | 8.9 | 37.25 |
| 0.3 | 6.4 | 26.78 |
This depends on the type of dipolar interactions which are strongly related to the particle diameter, shape, surface coating thus synthetic route.29,38 The SAR values are proportional to the nanoparticle concentration in dispersions and increase almost linearly. It can be seen that the increase in nanoparticles concentration has resulted in faster heating. However, at a cost of worse light penetration through the sample which is being absorbed and further blocked by particles placed in the proximal portion of the dispersion. For the low concentration regimes, not exceeding 300 μg ml−1, which is still high enough in terms of possible cytotoxicity, sample heating occurs within the whole volume almost evenly. Further studies on optimization of the beam size, shape etc. for more efficient light penetration and absorption as well as nanoparticles modification will be necessary to conduct in future.
Fig. 8 presents the absorption spectra of Mn0.8Ni0.2Fe2O4 nanoparticle dispersions as a function of their concentration. In the case of the most concentrated samples signal saturation was achieved upon exciting nanoparticles concentration above 250 μg ml−1 (very strong absorption). Therefore such calculations make sense only for the less concentrated samples. In order to calculate the efficiency of the light to heat conversion at 808 nm well known formula was used:
| Φabs808 = σabs808/σext808 | (4) |
| σext808 = αext808/cNPs | (5) |
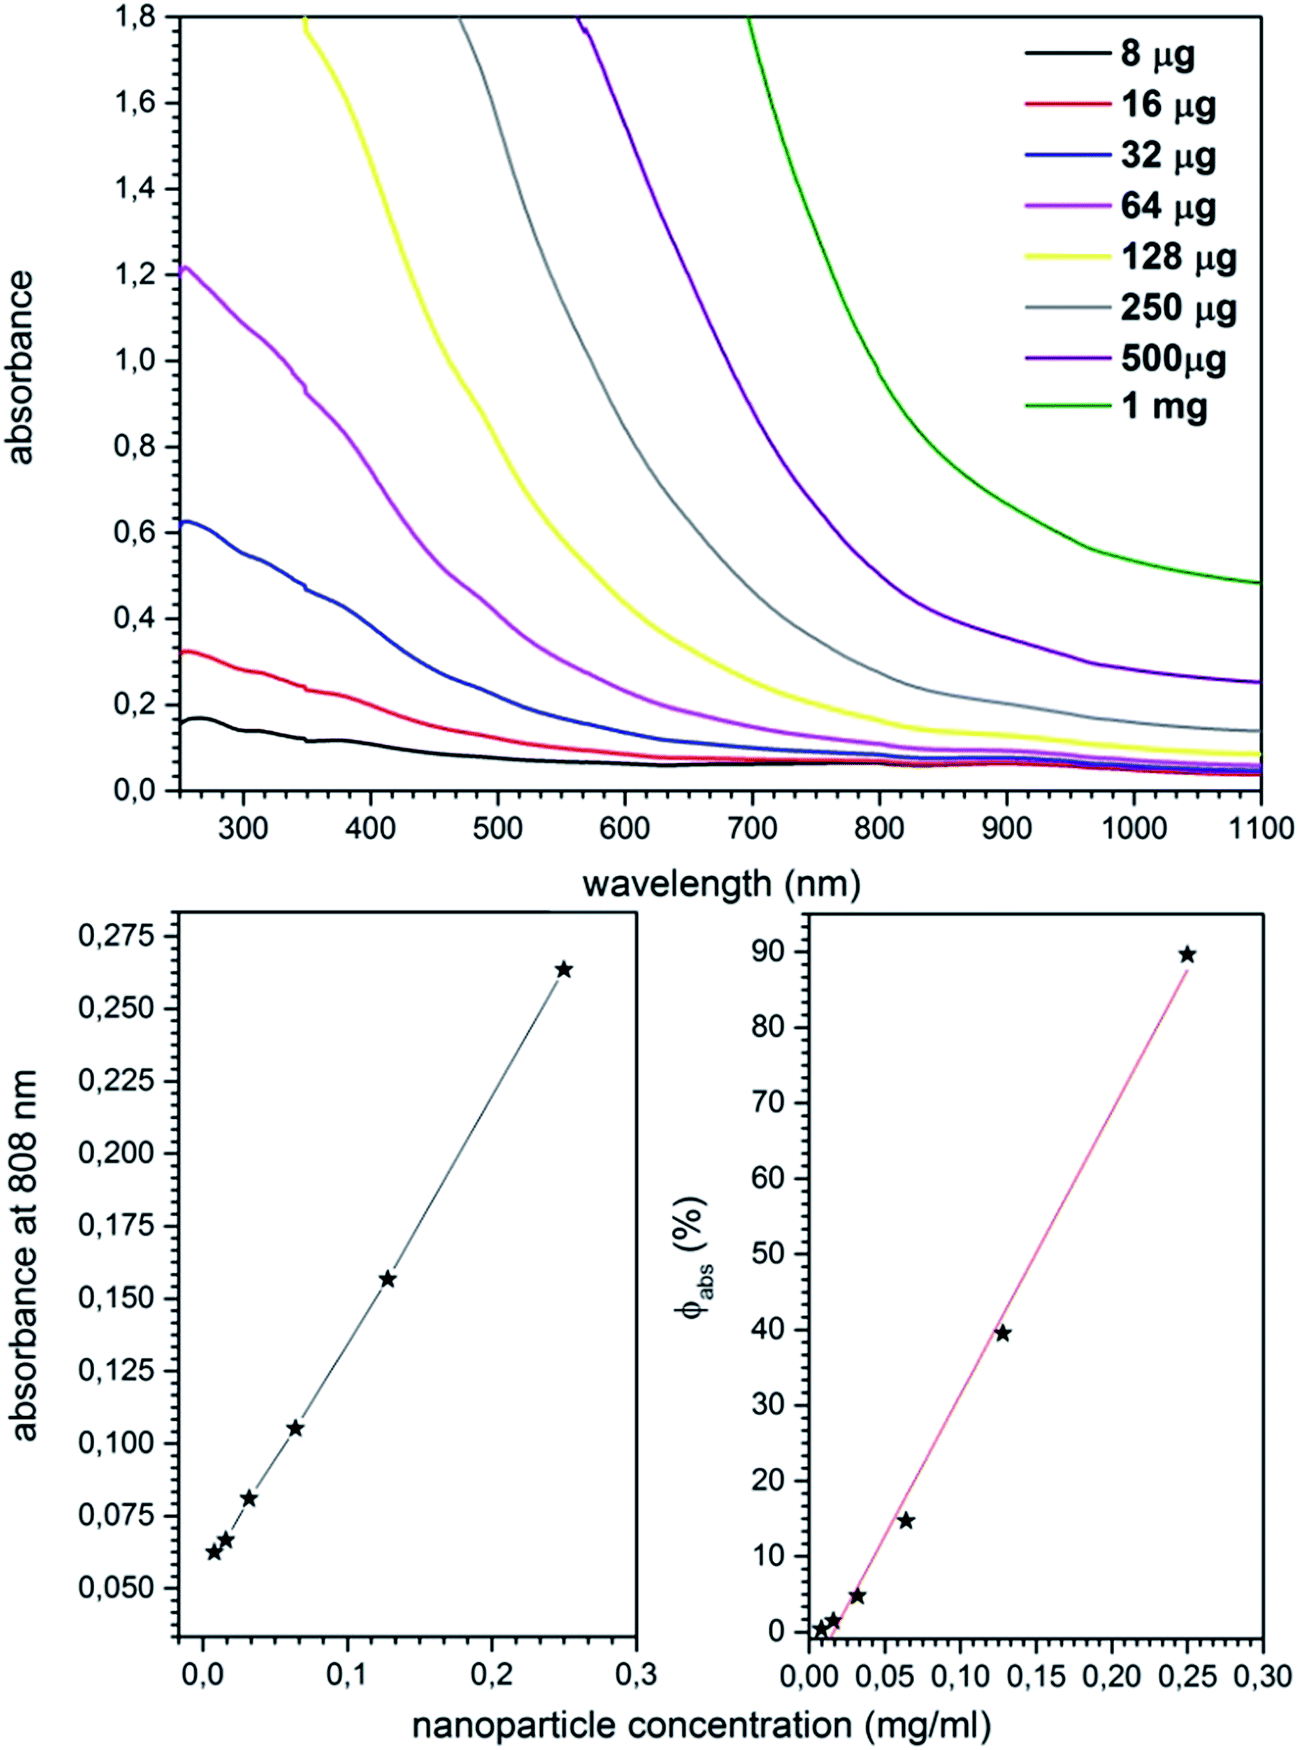 | ||
| Fig. 8 Absorption spectra of Mn0.8Ni0.2Fe2O4 nanoparticle dispersion (upper), dispersion absorbance and conversion efficiency (Φabs) as a function of nanoparticle concentration (bottom). | ||
4. Conclusions
Mn1−xNixFe2O4 nanoparticles with primary particle size of 6 nm ± 4 nm were synthesized using fast and effective microwave stimulated technique without addition of surfactants or other specific agents to open more flexible post-surface modification potential. It was shown that the absorption measurements can be successfully used for studies of stabilizing/destabilizing effects of certain molecules on nanoparticles stability in water dispersions.Both tested cell lines, J774.E murine macrophages and U2OS human osteosarcoma, exhibited dose-dependent cytotoxic effects upon interaction with the investigated nanoparticles. Comparison with previously studied ferrites Co1−xMnxFe2O4 has shown more differentiated cellular response with indication on lower cytotoxicity of Mn1−xNixFe2O4 nanoparticles. Similar to our previous report, cells exposed to particle dispersions revealed high loading of macrophages and moderate loading of osteosarcoma cells. This difference was ascribed to phagocytic activity of macrophages and their natural role in elimination of particulate matter under in vivo conditions.
It was shown that the Mn1−xNixFe2O4 nanoparticles dispersion shown effective light-to-heat conversion upon exposure of samples to NIR irradiation which can be potentially attractive in thermal based bio-related applications without use of external AC magnetic field. The calculated SAR was proportional to the nanoparticle concentration and increased linearly with particle concentration. Increase of nanoparticles amount leads to faster heating, but at a cost of worse light penetration through the sample. It was proven that the sufficient temperature for the thermal based therapies and temperature induced drug release can be achieved on Mn1−xNixFe2O4 ferrite nanoparticles with use of the NIR radiation instead of the AC magnetic field quite effectively.
Acknowledgements
The authors would like to thank M.Sc. E. Bukowska for XRD measurements. Financial support of the National Science Centre in course of realization of the Project ‘Smart nanoparticles for bio-imaging and drug delivery’ no. UMO-2011/01/D/ST5/05827 is gratefully acknowledged.References
- M. Arruebo, R. Fernández-pacheco, M. R. Ibarra and J. Santamaría, Nano Today, 2007, 2, 22–32 CrossRef
.
- P. Pallab, G. Jyotsnendu, S. Gopal, D. S. Haladhar, P. M. Kaushala, B. Jayesh, B. Rinti and B. Dhirendra, J. Biomed. Mater. Res., Part B, 2007, 81, 12–22 Search PubMed
- T. B. Huff, L. Tong, Y. Zhao, M. N. Hansen, J.-X. Cheng and A. Wei, Nanomedicine, 2007, 2, 125–132 CrossRef CAS PubMed
- D. H. Kim, D. E. Nikles and C. S. Brazel, Materials, 2010, 3, 4051–4065 CrossRef CAS
- D. H. Kim, D. E. Nikles, D. T. Johnson and C. S. Brazel, J. Magn. Magn. Mater., 2008, 320, 2390–2396 CrossRef CAS
- A. Faraz, M. Saqib, N. M. Ahmad, F. Rehman, A. Maqsood, M. Usman, A. Mumtaz and M. H. Hassan, J. Supercond. Novel Magn., 2012, 25, 1025–1033 CrossRef
- K. P. Chae, W. O. Choi, J. Lee, B. Kang and S. H. Choi, J. Magn., 2013, 18, 21–25 CrossRef
- E. R. Kumar, A. S. Kamzin and T. Prakash, J. Magn. Magn. Mater., 2015, 378, 389–396 CrossRef CAS
- R. Kesavamoorthi and C. R. Raja, J. Supercond. Novel Magn., 2016, 29, 2729–2734 CrossRef CAS
- S. K. Jesudoss, J. J. Vijaya, L. J. Kennedy, P. I. Rajan, H. A. Al-Lohedan, R. J. Ramalingam, K. Kaviyarasu and M. Bououdina, J. Photochem. Photobiol., B, 2016, 165, 121–132 CrossRef CAS PubMed
- C. Fernandes, C. Pereira, M. P. Fernandez-Garcia, A. M. Pereira, A. Guedes, R. Fernandez-Pacheco, A. Ibarra, M. R. Ibarra, J. P. Araujo and C. Freire, J. Mater. Chem. C, 2014, 2, 5818–5828 RSC
- E. Zachanowicz, A. Zięcina, P. A. Mikołajczyk, K. Rogacki, M. Małecka, K. Marycz, M. Marędziak, B. Poźniak, M. Nowakowska, M. Tikhomirov, J. Miller, R. J. Wiglusz and R. Pązik, Eur. J. Inorg. Chem., 2016, 2016, 5315–5323 CrossRef CAS
- Z. Beji, A. Hanini, L. S. Smiri, J. Gavard, K. Kacem, F. Villain, J. M. Grenèche, F. Chau and S. Ammar, Chem. Mater., 2010, 22, 5420–5429 CrossRef CAS
- Q. A. Pankhurst, J. Connolly, S. K. Jones and J. Dobson, J. Phys. D: Appl. Phys., 2003, 36, R167–R181 CrossRef CAS
- D. Jaque and F. Vetrone, Nanoscale, 2012, 4, 4301–4326 RSC
- C.-H. Quek and K. W. Leong, Nanomaterials, 2012, 2, 92–112 CrossRef CAS
- D. Jaque, L. Martínez Maestro, B. del Rosal, P. Haro-Gonzalez, A. Benayas, J. L. Plaza, E. Martín Rodríguez and J. García Solé, Nanoscale, 2014, 6, 9494–9530 RSC
- K.-T. Yong, I. Roy, M. T. Swihart and P. N. Prasad, J. Mater. Chem., 2009, 19, 4655–4672 RSC
- H. Chen, J. Burnett, F. Zhang, J. Zhang, H. Paholak and D. Sun, J. Mater. Chem. B, 2014, 2, 757–765 RSC
- M. Chu, Y. Shao, J. Peng, X. Dai, H. Li, Q. Wu and D. Shi, Biomaterials, 2013, 34, 4078–4088 CrossRef CAS PubMed
- A. Espinosa, R. Di Corato, J. Kolosnjaj-Tabi, P. Flaud, T. Pellegrino and C. Wilhelm, ACS Nano, 2016, 10, 2436–2446 CrossRef CAS PubMed
- S. Shen, S. Wang, R. Zheng, X. Zhu, X. Jiang, D. Fu and W. Yang, Biomaterials, 2015, 39, 67–74 CrossRef CAS PubMed
- S. Shen, F. Kong, X. Guo, L. Wu, H. Shen, M. Xie, X. Wang, Y. Jin and Y. Ge, Nanoscale, 2013, 5, 8056–8066 RSC
- Z. Zhou, Y. Sun, J. Shen, J. Wei, C. Yu, B. Kong, W. Liu, H. Yang, S. Yang and W. Wang, Biomaterials, 2014, 35, 7470–7478 CrossRef CAS PubMed
- L. M. Maestro, P. Haro-González, B. del Rosal, J. Ramiro, a J. Caamaño, E. Carrasco, A. Juarranz, F. Sanz-Rodríguez, J. G. Solé and D. Jaque, Nanoscale, 2013, 5, 7882–7889 RSC
- L. M. Maestro, P. Haro-González, A. Sánchez-Iglesias, L. M. Liz-Marzán, J. García Solé and D. Jaque, Langmuir, 2014, 30, 1650–1658 CrossRef CAS PubMed
- R. Pązik, E. Piasecka, M. Małecka, V. G. Kessler, B. Idzikowski, Z. Śniadecki and R. J. Wiglusz, RSC Adv., 2013, 3, 12230 RSC
- E. Mazarío, J. Sánchez-Marcos, N. Menéndez, M. Cañete, A. Mayoral, S. Rivera-Fernández, J. M. De La Fuente and P. Herrasti, J. Phys. Chem. C, 2015, 119, 6828–6834 Search PubMed
- K. Vamvakidis, M. Katsikini, D. Sakellari, E. C. Paloura, O. Kalogirou and C. Dendrinou-Samara, Dalton Trans., 2014, 43, 12754–12765 RSC
- R. Pązik, A. Zięcina, E. Zachanowicz, M. Małecka, B. Poźniak, J. Miller, Z. Śniadecki, N. Pierunek, B. Idzikowski, L. Mrówczyńska, A. Ekner-Grzyb and R. J. Wiglusz, Eur. J. Inorg. Chem., 2015, 4750–4760 CrossRef
- R. D. Shannon, Acta Crystallogr., Sect. A: Cryst. Phys., Diffr., Theor. Gen. Crystallogr., 1976, 32, 751–767 CrossRef
- K. Wilkinson, B. Ekstrand-Hammarström, L. Ahlinder, K. Guldevall, R. Pazik, L. Kępiński, K. O. Kvashnina, S. M. Butorin, H. Brismar, B. Önfelt, L. Österlund, G. a. Seisenbaeva and V. G. Kessler, Nanoscale, 2012, 4, 7383–7393 RSC
- R. Pazik, G. A. Seisenbaeva, S. Gohil, R. Wiglusz, L. Kępiński, W. Strek and V. G. Kessler, Inorg. Chem., 2010, 49, 2684–2691 CrossRef CAS PubMed
- R. Pazik, G. A. Seisenbaeva, R. J. Wiglusz, L. Kepinski and V. G. Kessler, Inorg. Chem., 2011, 50, 2966–2974 CrossRef CAS PubMed
- R. Pazik, R. Tekoriute, S. Håkansson, R. Wiglusz, W. Strek, G. a. Seisenbaeva, Y. K. Gun’ko and V. G. Kessler, Chem.–Eur. J., 2009, 15, 6820–6826 CrossRef CAS PubMed
- S. Abtmeyer, R. Pązik, R. J. Wiglusz, M. Małecka, G. a. Seisenbaeva and V. G. Kessler, Inorg. Chem., 2014, 53, 943–951 CrossRef CAS PubMed
- I. Baker, Q. Zeng, W. Li and C. R. Sullivan, J. Appl. Phys., 2006, 99, 97–100 CrossRef
- N. D. Thorat, V. M. Khot, a B. Salunkhe, a I. Prasad, R. S. Ningthoujam and S. H. Pawar, J. Phys. D: Appl. Phys., 2013, 46, 105003 CrossRef
| This journal is © The Royal Society of Chemistry 2017 |